
A small sideways day sees the Elliott wave count slightly adjusted, which effects the target zone. An alternate hourly Elliott wave count is provided today just in case.
Summary: The target for this upwards wave to end can now be calculated at two degrees as a range from 2,382 to 2,387. If price moves strongly lower and breaks below the blue Elliott channel, then primary wave 3 may be over and primary wave 4 may have arrived.
VIX divergence with price persists and offers a strong warning: if trading this upwards trend, then watch this market closely; there is potential for a surprisingly strong and sharp drop in prices here.
New updates to this analysis are in bold.
Last monthly and weekly charts are here. Last historic analysis video is here.
MAIN ELLIOTT WAVE COUNT
WEEKLY CHART
Click chart to enlarge.
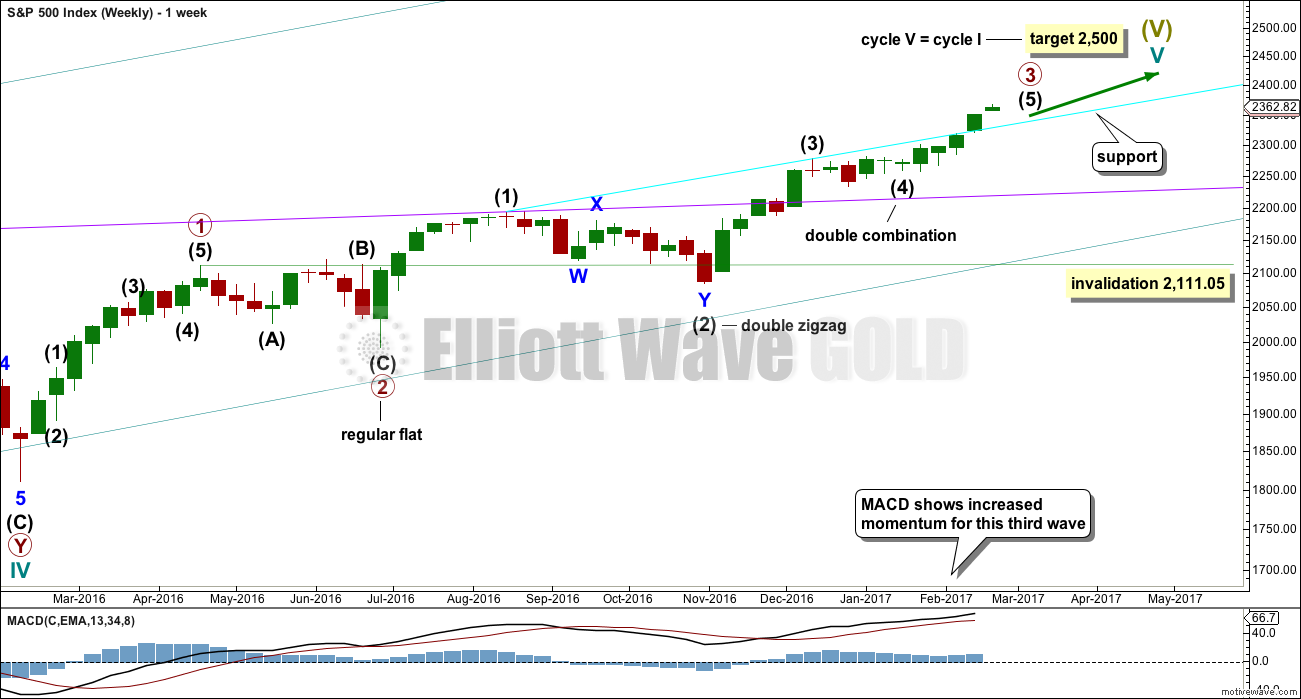
Cycle wave V is an incomplete structure. Within cycle wave V, primary wave 3 may be relatively close to completion.
When primary wave 3 is complete, then the following correction for primary wave 4 may not move into primary wave 1 price territory below 2,111.05.
Primary wave 2 was a flat correction lasting 47 days (not a Fibonacci number). Primary wave 4 may be expected to most likely be a zigzag, but it may also be a triangle if its structure exhibits alternation. If it is a zigzag, it may be more brief than primary wave 2, so a Fibonacci 21 sessions may be the initial expectation. If it is a triangle, then it may be a Fibonacci 34 or 55 sessions.
Primary wave 3 at this stage is either close to completion or may possibly be complete today. The alternate hourly chart below looks at this possibility.
DAILY CHART
Click chart to enlarge.
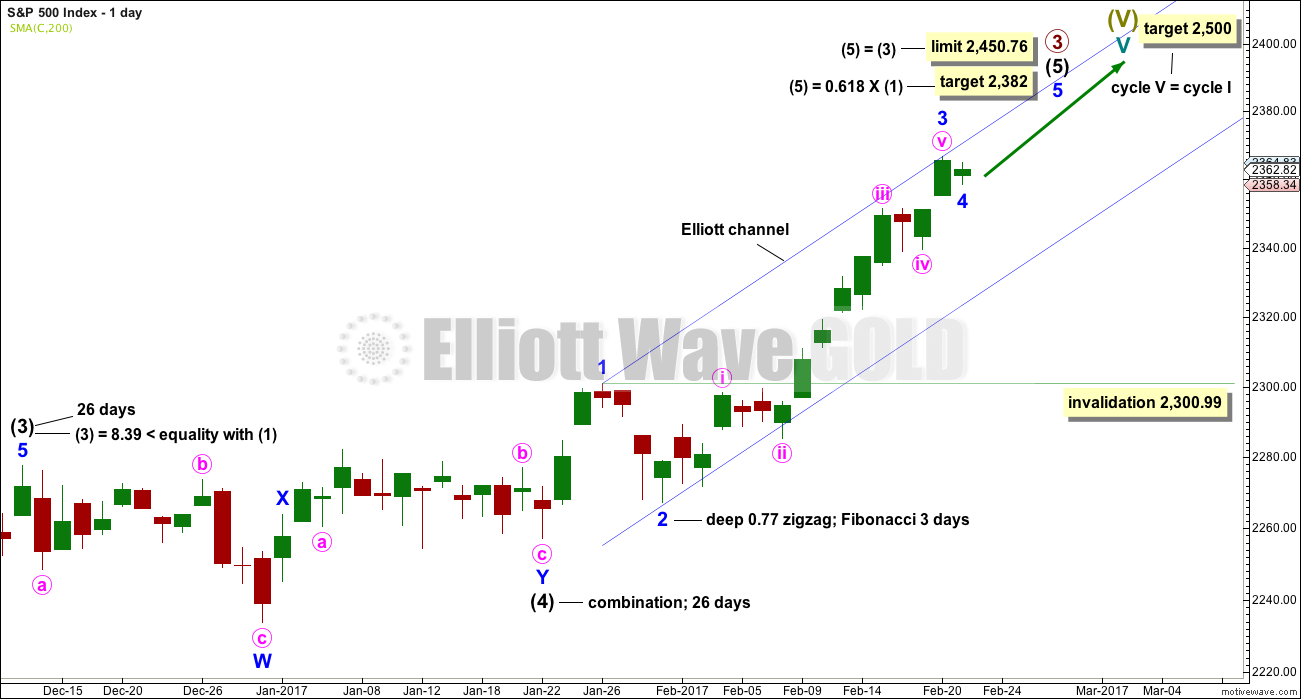
Intermediate wave (4) is a complete combination: zigzag – X – flat. It would have been even in duration with intermediate wave (3), both lasting 26 days.
Intermediate wave (3) is shorter than intermediate wave (1). One of the core Elliott wave rules states a third wave may never be the shortest wave, so this limits intermediate wave (5) to no longer than equality in length with intermediate wave (3) at 2,450.76.
Minor wave 3 still has no Fibonacci ratio to minor wave 1.
Minor wave 2 was a deep 0.77 zigzag lasting three days. Minor wave 4 may have completed today as a small shallow running contracting triangle. It barely shows up on the daily chart compared to minor wave 2, but for this market this is reasonably acceptable. The S&P does not have good proportions; its waves do not always have a good look on all time frames.
Intermediate wave (5) has so far lasted 21 days. It may be expected to be shorter both in length and duration compared to intermediate wave (3). At this stage, an expectation of a Fibonacci 34 days total for intermediate wave (5) looks reasonable, so it may now continue for another 13 days or sessions.
The alternate hourly wave count below expects that intermediate wave (5) may have been over yesterday. If that is correct, it may have lasted 20 days, one short of a Fibonacci 21.
The proportion here between intermediate waves (2) and (4) is acceptable. There is alternation. Both are labelled W-X-Y, but double zigzags are quite different structures to double combinations.
MAIN HOURLY CHART
Click chart to enlarge.
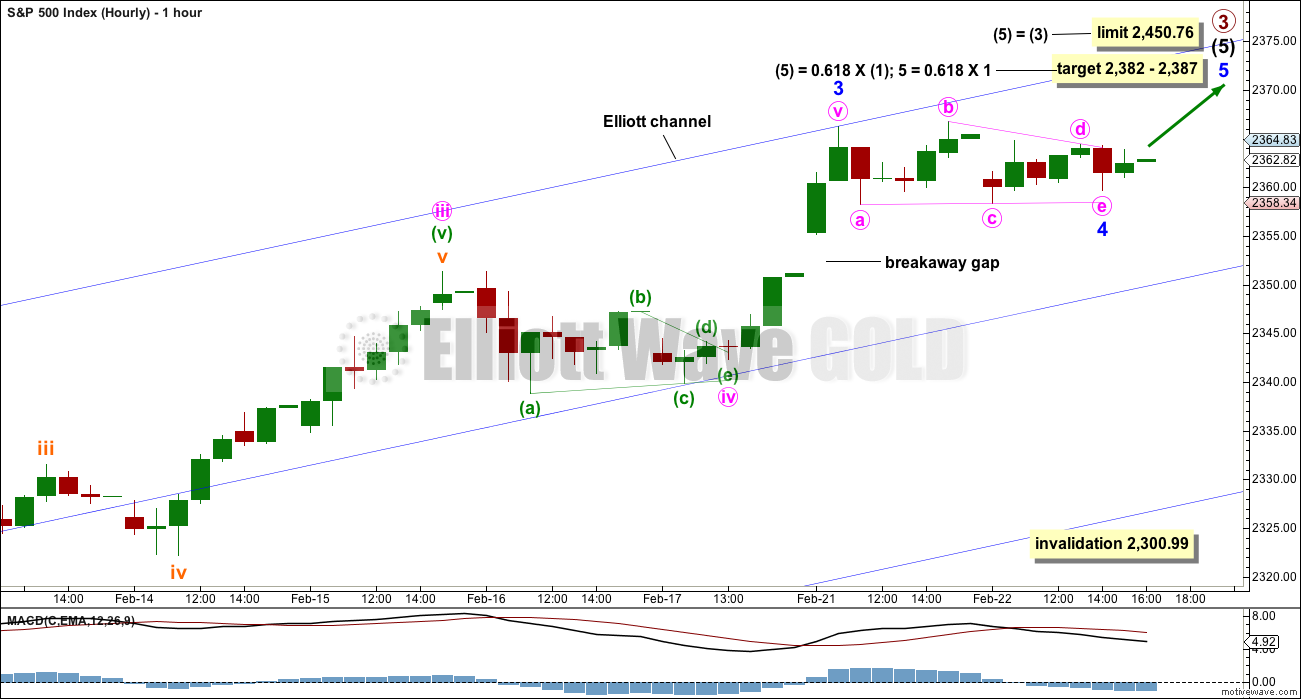
The structure within minor wave 3 is changed for this hourly chart today.
It looks like two small contracting triangles have just completed. The first may have been minute wave iv, and the triangle today may have been minor wave 4. The triangle will remain valid as long as price remains above 2,358.18. Any continuation of minute wave c may not move beyond the end of minute wave a.
If the triangle is invalidated, then it would be possible that minor wave 4 is morphing into a combination. If it does that, then it would be longer lasting and would have better proportion to minor wave 2 at the daily chart level.
Minor wave 4 should remain contained within the Elliott channel. If it gets down that low, it may find support at the lower edge.
If price breaks below the lower edge of the channel, then this main wave count would be discarded and the alternate below would be used.
Minor wave 4 may not move into minor wave 1 price territory below 2,300.99.
If price moves up and away tomorrow, then this wave count would be confirmed with a new high above 2,366.71. The alternate would be discarded. At that stage, the invalidation point may be moved up to the start of minor wave 5 at 2,359.65.
ALTERNATE HOURLY CHART
Click chart to enlarge.
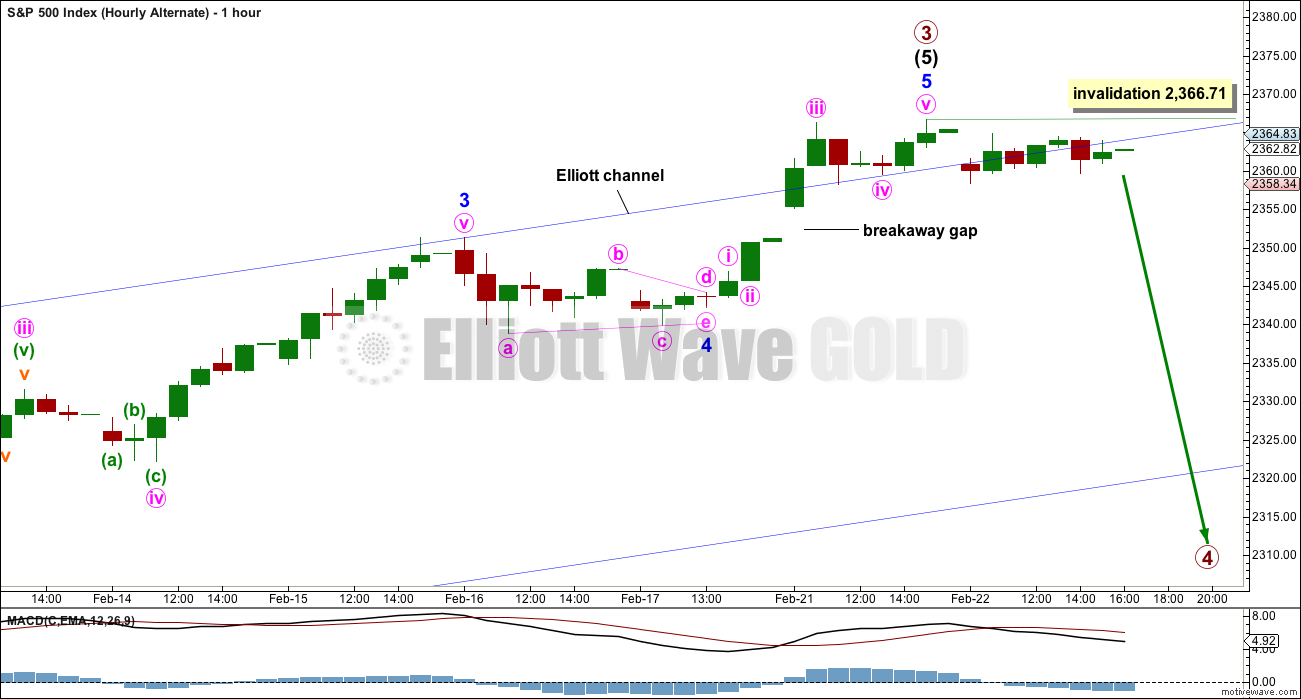
Unfortunately, the confidence point for this alternate wave count, which is too far away to be useful, would be at 2,300.99.
It is possible that primary wave 3 is over and primary wave 4 has just begun. The structure within minor wave 3 for this alternate is seen in the same way as it has been up to this point.
Within a new trend at primary degree, a five down would unfold at least at the hourly chart level if not at the daily chart level. Within that first five down, no second wave correction may move beyond its start above 2,366.71.
If price breaks below the lower edge of the Elliott channel for both hourly wave counts, then the main wave count would be discarded in favour of this alternate. If this alternate is correct, then price may begin a swift sharp downwards movement in the next one to few sessions.
TECHNICAL ANALYSIS
WEEKLY CHART
Click chart to enlarge. Chart courtesy of StockCharts.com.
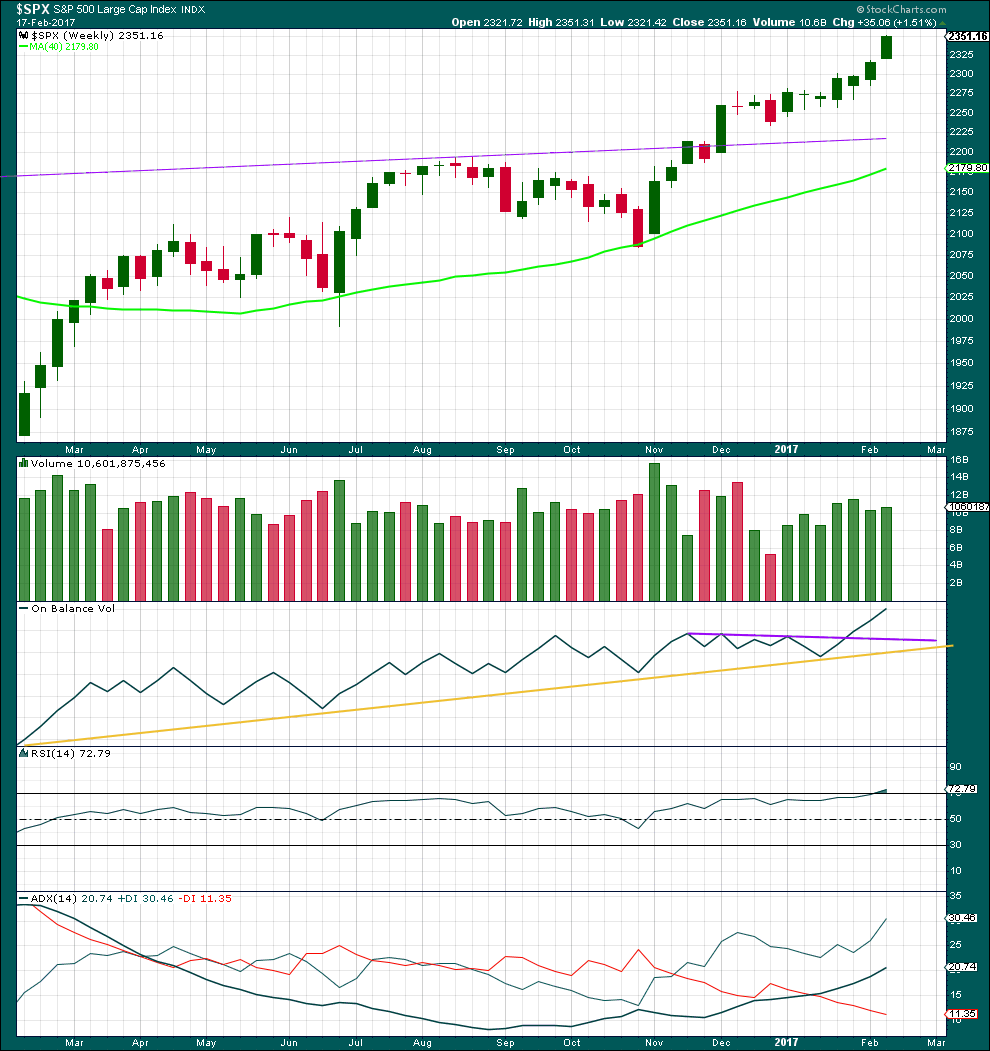
Last week completes the third candlestick in a Three White Soldiers pattern on the weekly chart. This is a bullish continuation pattern. The lower edge of the first candlestick may now offer support about 2,267.21.
A slight increase in volume last week beyond the prior week is also bullish.
On Balance Volume at the weekly chart remains very bullish.
RSI is only just now entering overbought at the weekly chart level. This may remain extreme for a few weeks during a strong trend. At this stage, it does not exhibit any divergence with price to indicate weakness.
ADX still indicates an upwards trend that has some distance to travel before it becomes extreme.
This weekly chart is very bullish indeed.
DAILY CHART
Click chart to enlarge. Chart courtesy of StockCharts.com.
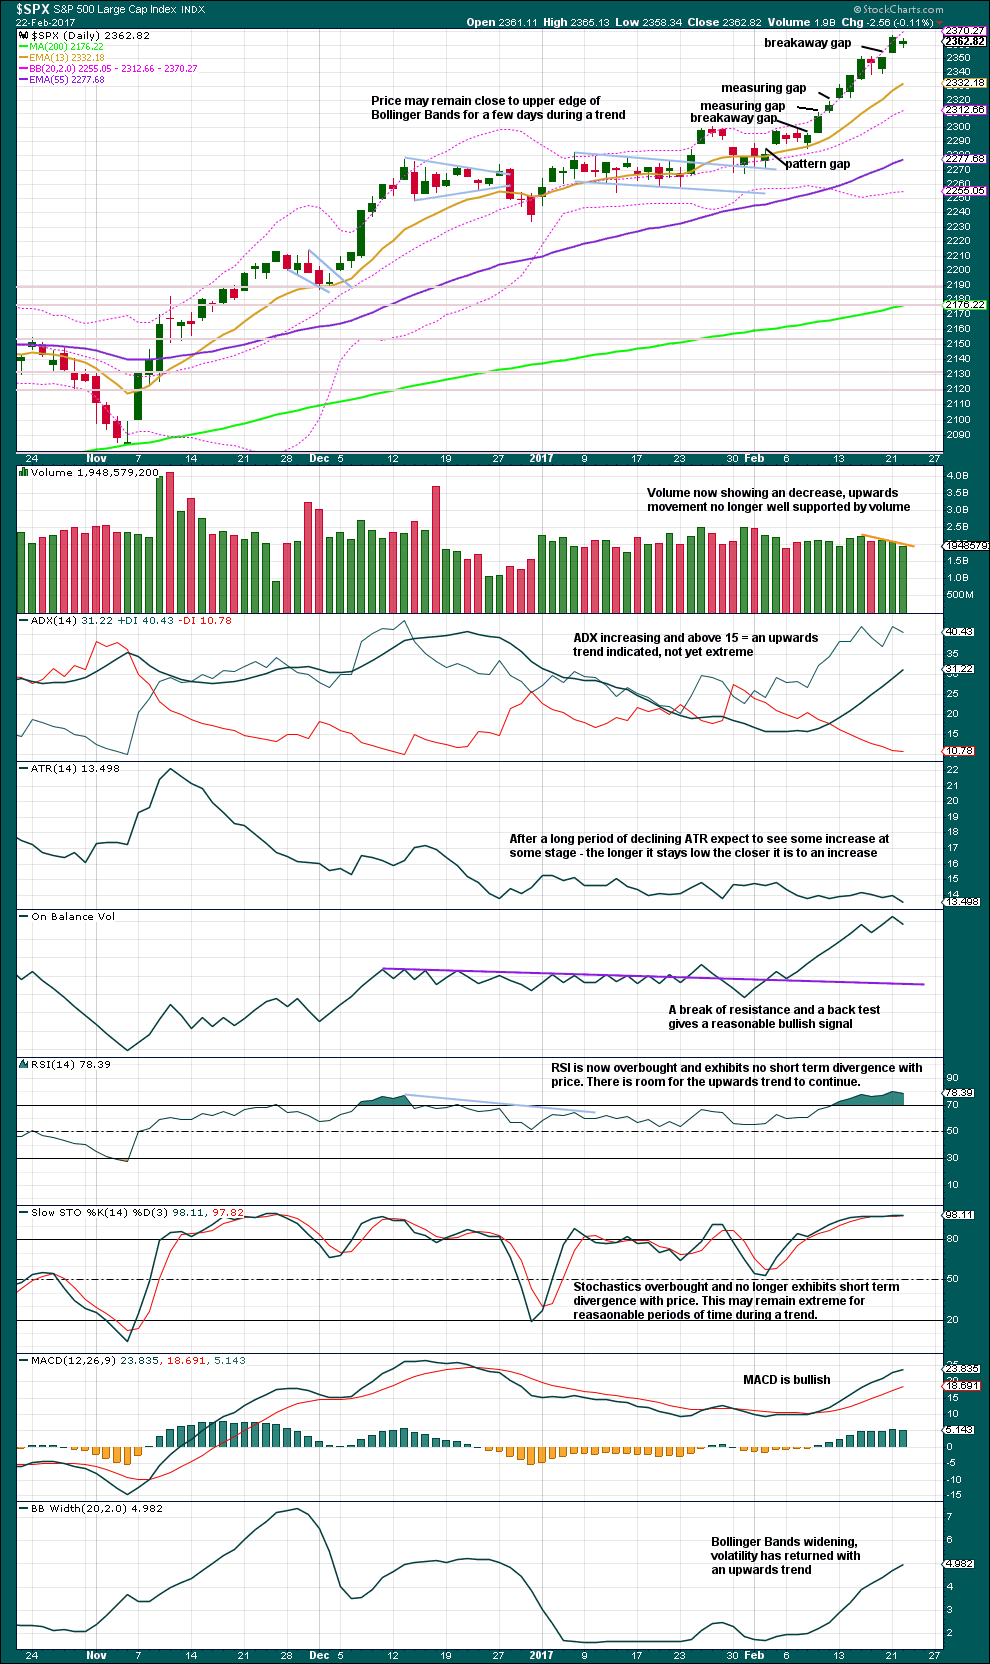
A breakaway gap upwards indicates the small consolidation, lasting only two days, is over. This gap may offer support.
Volume for the last three sessions is light and declining. The upwards movement for price is not supported by volume. Today saw an inside day with the balance of volume downwards, so the fall in price today was not supported by volume. This slightly favours the main hourly Elliott wave count.
ADX will be extreme when it reaches 35 and above, and / or the ADX line reaches above both directional lines. ADX is nearing extreme for the short term trend, but it is not there yet.
Only when there is divergence at highs between RSI and price, while RSI is overbought, will an end to this trend be expected. So far there is no divergence at the daily chart level to indicate weakness. This trend can continue. This chart remains very bullish.
VOLATILITY – INVERTED VIX CHART
Click chart to enlarge. Chart courtesy of StockCharts.com.
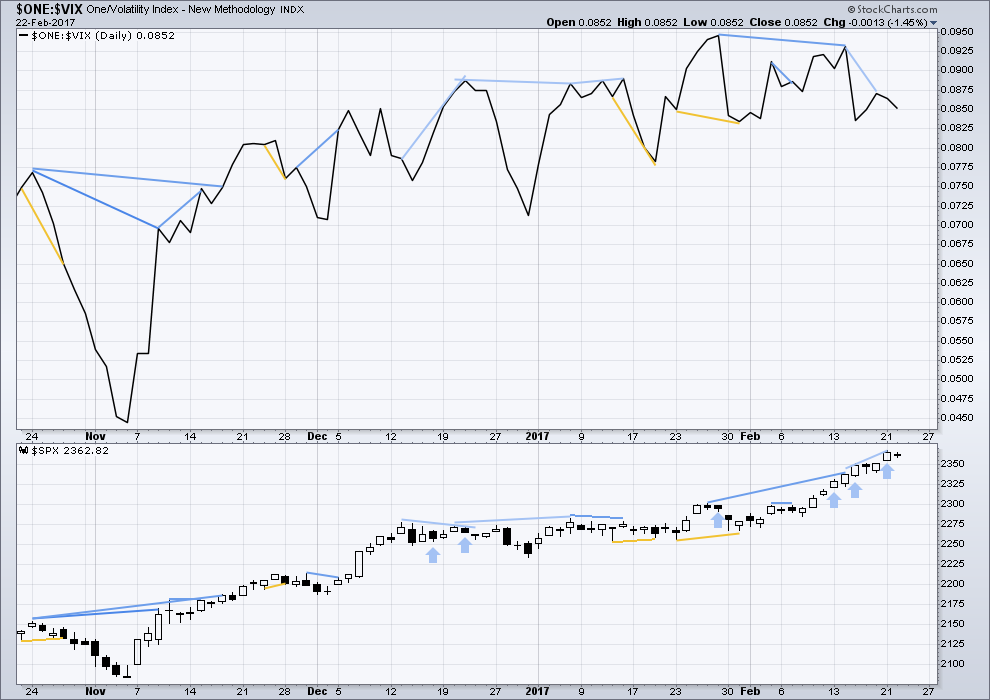
There are a few instances of multi day divergence between price and inverted VIX noted here. Bearish divergence is blue. Bullish divergence is yellow. It appears so far that divergence between inverted VIX and price is mostly working to indicate short term movements spanning one or two days. While this seems to be working more often than not, it is not always working. As with everything in technical analysis, there is nothing that is certain. This is an exercise in probability.
Recent single day and multi day bearish divergence between price and inverted VIX has not been followed by any downwards movement. Price continues to rise higher. Yesterday completes another day where price and VIX diverged: price moved up but volatility increased. Normally, volatility should decline on rising price. There is double multi day divergence now between price and inverted VIX. This is bearish.
Either VIX is now decoupled from this market, or this persistent divergence will be resolved by primary wave 3 ending sooner than expected and primary wave 4 beginning very strongly. This divergence signals traders to be very cautious; assume the trend remains the same, but if entering the trend be aware for the potential here of a swift drop in price and use stops accordingly. Risk no more than 1-5% of equity.
Warning: Watch this market closely. If it begins to move down, then downwards movement could be very quick.
No new divergence is noted today for price and inverted VIX. Short and mid term divergence is still sending warning signals.
BREADTH – AD LINE
Click chart to enlarge. Chart courtesy of StockCharts.com.
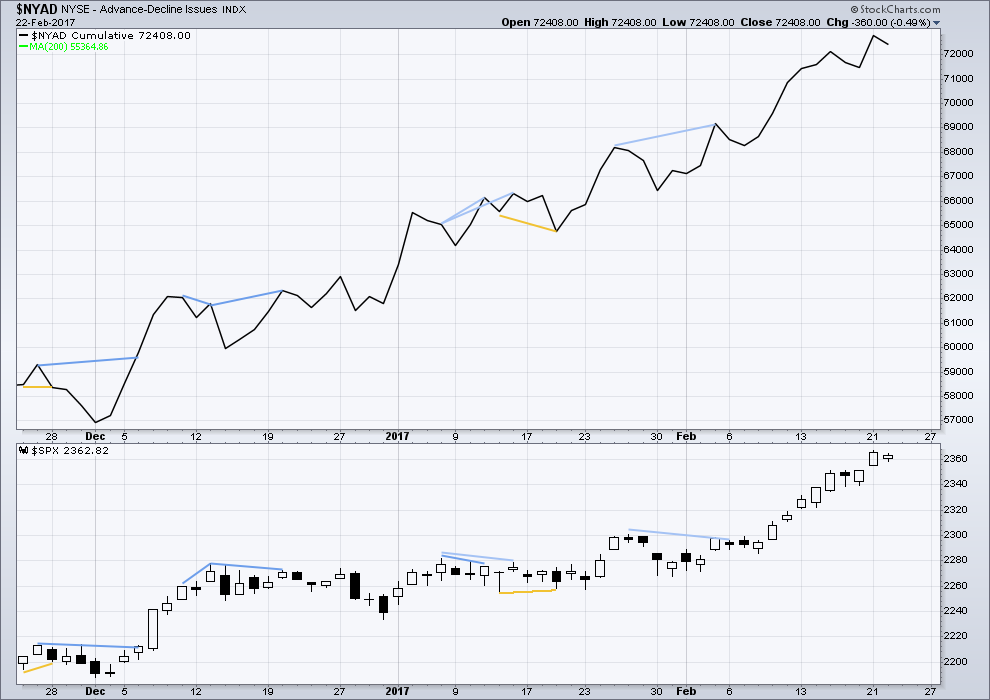
There is no short nor mid term divergence today between price and the AD line. The rise in price to a new high today was accompanied by a corresponding new high in the AD line. The rise in price has support from a rise in market breadth. Lowry’s OCO AD line also shows new highs along with price. Normally, before the end of a bull market the OCO AD line and the regular AD line should show divergence with price for about 4-6 months. With no divergence, this market has support from breadth.
There is no new divergence for some time between price and the AD line. The rise in price is supported by a corresponding rise in market breadth. Price moved sideways today and the balance of volume for the session was downwards. The AD declined with price indicating a normal decline in market breadth. There is no new divergence.
DOW THEORY
The DJIA, DJT, S&P500 and Nasdaq have made new all time highs in December of 2016. This confirms a bull market continues.
This analysis is published @ 8:39 p.m. EST.
Minor 4 now fits perfectly as an expanded flat, with a great Fibonacci ratio between minute waves a and c.
Interesting to note IWM today. It is down over 1% at this time. It looks to me to be a combination “w-x-y” pattern. But I certainly am not Elliott analyst. Just something to note.
At this point in the trading day ( ~1 PM), I am thinking Minor 4 is morphing into something else. It will go essentially sideways to down a bit. But 4th waves are notoriously difficult to forecast as they occur. I’m in a holding pattern.
Over the past couple of weeks, corrections have been tending towards being shallow and even short lived. I expect this would continue to the completion of Minor 5, Intermediate 5 and Primary 3. Then Primary 4 should shake a few tress and ruffle the feathers of the bulls if bulls have feathers. Just my thoughts.
Still could be a double-flat 4 off the 3 high, but would have to turn upward right now.
But continues to fall, so nevermind.
Maybe still… found support at the top of the gap just beyond the 2.618 extension of the second [a] wave.
Yep. That breakaway gap behaved exactly as my textbooks said it should 🙂
Now I just wish that this market would always do that! It sure would make it easier to profit from
2359.65 taken out.
Hey Chris, looks like your Unicorns are really prancing! 😀
They’re looking pretty bullish those Unicorns 🙂
So happy I rounded up a few!! 😀 😀 😀
SVXY puts also pretty sweet…I feel a little guilty after that ten bagger…!
It should go to the beginning of the parabola…
How do you guys square this big red first hour after the gap up opening? It seems to mess up both hourly counts. No triangle now but perhaps a combination minor-4. Or was that teeny gap up the extent of minor-5?
Daily chart still looks okay.
Look at volatlity…it is telling you something…
Question for you, Verne… I’ve only lately been watching inverted VIX, specifically XIV. Does it often lead SPX into reversals, or is the action of the last few days quite unusual?
Everything about the past several weeks is quite unusual. Generally the action with all forms of volatility instruments is co-incident with price action in the indices. The extent and persistence of divergence we have been seeing in recent days is frankly something I have never seen.
Thank you, Verne. That’s really quite helpful. I appreciate it!
Edit: I could have done this myself earlier, but I just overlaid XIV and SPX price plots for the last 18 months. I see what you mean!
Yep! It is remarkable isn’t it? 🙂
Most interesting…gap up openings in both Gold and stocks…exhaustion vs break-away?!
Main hourly count confirmed. Alternate hourly count invalidated.
Thanks Rod. I missed that alternate count invalidation point…
Gann Global Financial recently gave a seminar on the historical price action in Gold, and made a very sttong case for this correction to move lower. There had never been another instance in which a 44% correction immediately went on to exceed the preceeding high.
From the look of the Gold chart today, we may be about to see a historical first. I am wondering what other departures from the expected we may see in these crazy markets, especially with regard to the current bullish signals for equities. If this move in Gold sticks, stocks could be sbout to correct…
Thanks again Lara for the excellent EW analysis!
My friends over at Stansberry research just shot me a really interesting statistic.
Since the year 1945, SPX has printed green in both January and February 27 times.
In each and every case, all 27 times, the index had ended the year in the green!
Here is what is even more impressive, the average total return for those years has been a hefty 24%!! This is a bullish signal that has never been wrong. As we all know, we have seen gains of 1.8% and 4% respectively in the first two months of 2017…so far.
Yesterday I posted that also most interesting observation by W.D. Gann about stock performance in years ending in the number seven, which Gann considered a fatal number for equities. Barring any dramatic change between now and the end of the months, two powerful and diametrically opposing metrics will be at work in determining the fate of the market in the year of our Lord 2017. This is going to great to watch!!
Indeed, diametrically opposed analysis there.
Lowry’s measure of supply and demand, and their Operating Companies Only AD line also suggests at least 4-6 months before this ageing bull market could be over. They have a 91 year history and say that divergence between price and the AD line normally spans 4-6 months before a major turn; selling pressure should increase before a turn and buying power should decline.
So yeah, that’s an interesting stat from Stansberry. What if price turns in October, but ends the year overall higher than January? That could still fit.
Then the year could end green, but it could also be a final high. October allows long enough for 4-6 months of divergence with price and the AD line, and Gann could be mostly right in that the year is terminal.
Maybe?
Indeed! It could be like 2007 that saw the high, but with the worst of the decline coming the following year in 2008…maybe?
I am hoping primary four is a nice sharp Zig Zag to shake out some of this remarkable bullishness. If that happens I think it will be the best buying opportunity we have seen in quite some time….
I often muse on whether we could be in for a surprise by expecting the same topping signals to apply to this market that has applied to previous bull runs. After all, we have never had a previous bull market that has been subject as much relentless bankster pumping as this one has. NDX is now more than 10% past its previous all time highs and other indices are stretched to historic extremes. The DOW notched yet another record consecutive of all time highs with today’s move up. I think considering the degree of inflation of this current market, we have to allow for the possibility that we may not have the luxury of months of preparatory signals to alert us that a top is imminent. I think it is entirely possible that this current market, because of its historic type of top, could well implode in a manner entirely different from previous ones, and could do so with a rapidity and violence inversely commensurate with the remarkable number of year banks have spent in propping it up. I would not be surprised if those thousand point over-night declines we had glimpsed of the past few months are a harbinger of what we could face when this market heads South in earnest. There are way too many folk it seems to me, who are convinced that the banksters can buy the market out of any decline, no matter how deep or violent it is. We will certainly find out if they are right!
I agree Verne, it certainly is possible!
If the wave count is right then this is a multi generational top coming up. It may be unlike anything we have seen in generations, so even Lowry’s with their 91 year history may be surprised.
But still, I have to go with the balance of probability based on past market behaviour. And be prepared to unlikely surprises with alternate wave counts when I can see them and when it’s appropriate.