
Upwards movement for the start of the week breaks above a prior small consolidation with a breakaway gap. Gaps can be useful for trading.
The target given by the Elliott wave count can now be calculated at two degrees, so it widens to a small zone.
Summary: The correction was over more quickly than expected; it was brief and shallow. The target for this upwards wave to end can now be calculated at two degrees as a range from 2,382 to 2,386. If price makes a new low below 2,342.27, then a multi week primary degree correction may have arrived.
VIX divergence with price persists and offers a strong warning: if trading this upwards trend, then watch this market closely; there is potential for a surprisingly strong and sharp drop in prices here.
New updates to this analysis are in bold.
Last monthly and weekly charts are here. Last historic analysis video is here.
MAIN ELLIOTT WAVE COUNT
WEEKLY CHART
Click chart to enlarge.
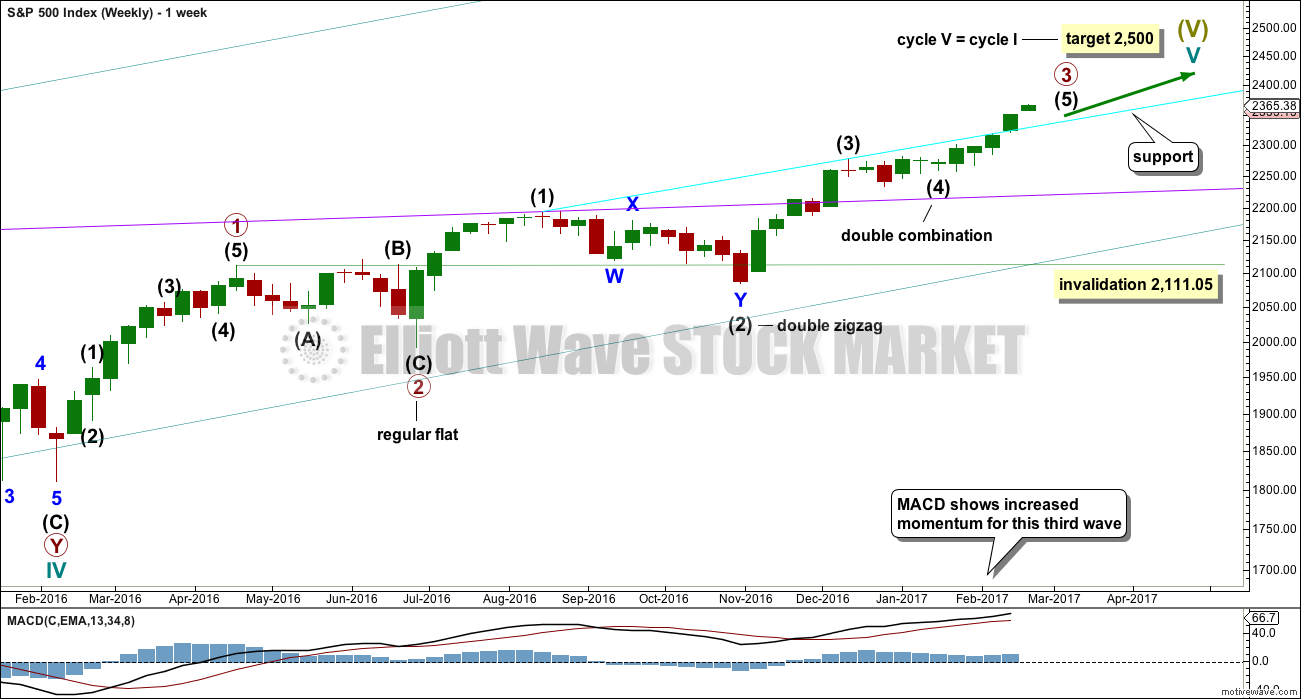
Cycle wave V is an incomplete structure. Within cycle wave V, primary wave 3 may be relatively close to completion.
When primary wave 3 is complete, then the following correction for primary wave 4 may not move into primary wave 1 price territory below 2,111.05.
Primary wave 2 was a flat correction lasting 47 days (not a Fibonacci number). Primary wave 4 may be expected to most likely be a zigzag, but it may also be a triangle if its structure exhibits alternation. If it is a zigzag, it may be more brief than primary wave 2, so a Fibonacci 21 sessions may be the initial expectation. If it is a triangle, then it may be a Fibonacci 34 or 55 sessions.
Primary wave 3 at this stage though is incomplete and shouldcontinue to move price higher if this wave count is correct.
DAILY CHART
Click chart to enlarge.
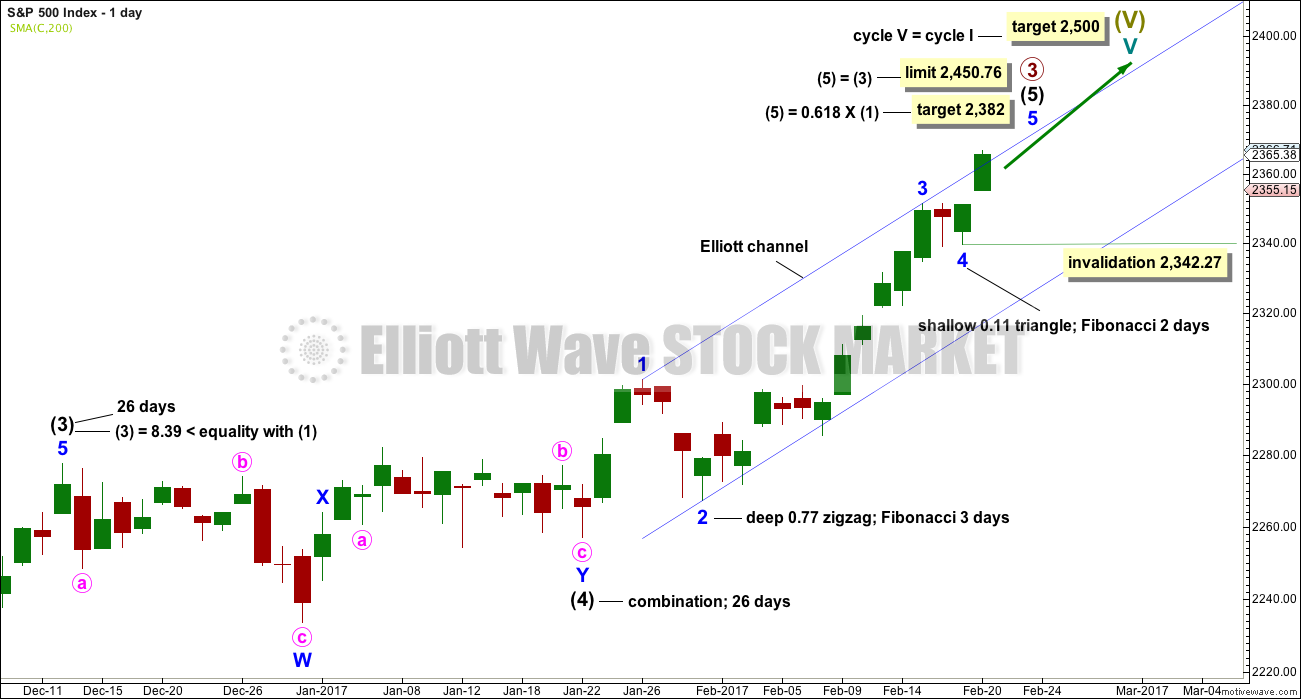
Intermediate wave (4) is a complete combination: zigzag – X – flat. It would have been even in duration with intermediate wave (3), both lasting 26 days.
Intermediate wave (3) is shorter than intermediate wave (1). One of the core Elliott wave rules states a third wave may never be the shortest wave, so this limits intermediate wave (5) to no longer than equality in length with intermediate wave (3) at 2,450.76.
Minor wave 3 has no Fibonacci ratio to minor wave 1.
Minor wave 2 was a deep 0.77 zigzag lasting three days. Minor wave 4 is now complete as a very brief and shallow triangle. There is good alternation and reasonable proportion although triangles normally are more time consuming structures than zigzags.
The invalidation point may be moved up today. Within minor wave 5, no second wave correction may move beyond the start of its first wave below 2,342.27.
Intermediate wave (5) has so far lasted 20 days. It may be expected to be shorter both in length and duration compared to intermediate wave (3). At this stage, an expectation of a Fibonacci 34 days total for intermediate wave (5) looks reasonable, so it may now continue for another 14 days or sessions.
The proportion here between intermediate waves (2) and (4) is acceptable. There is alternation. Both are labelled W-X-Y, but double zigzags are quite different structures to double combinations.
HOURLY CHART
Click chart to enlarge.
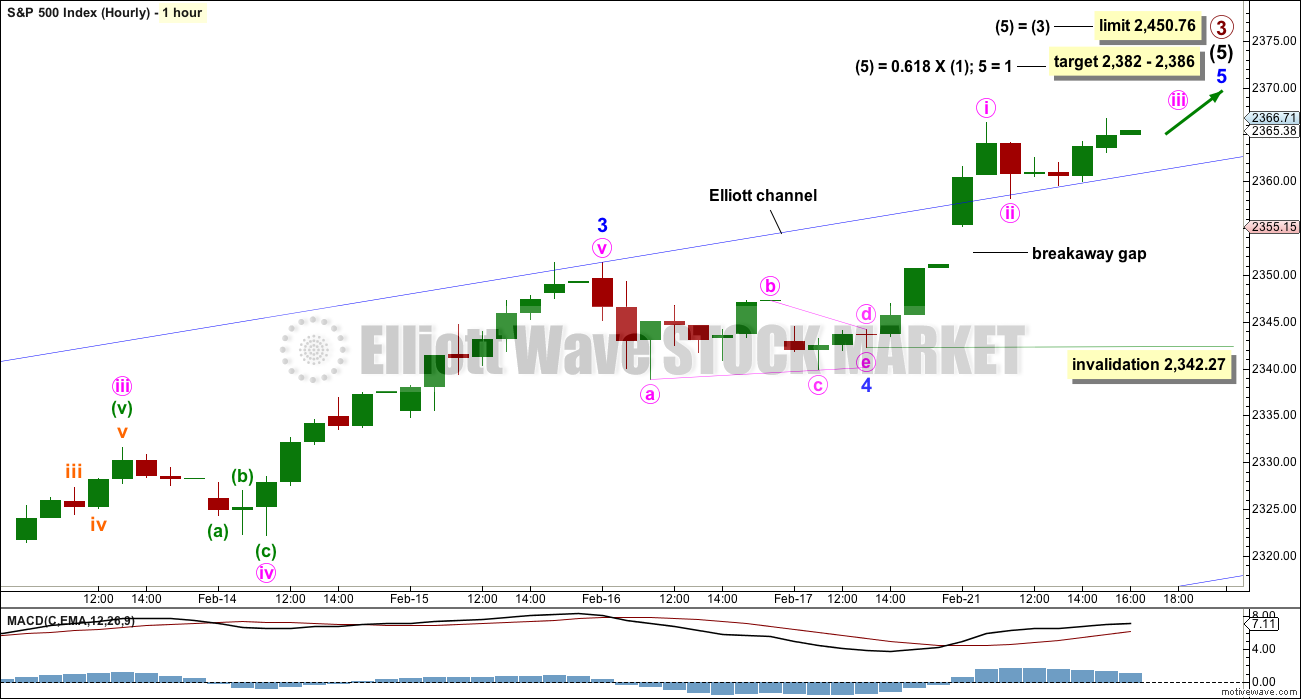
Minor wave 4 will fit as a triangle as labelled, and it is more brief than expected. Upwards movement during Tuesday’s session has now moved too high for it to be considered a part of minor wave 4.
The gap up on the open looks like a classic breakaway gap. These are rarely filled (short to mid term). This may offer support.
Price has broken above the upper edge of the Elliott channel, which is now providing support. With a strong fifth wave, this market is behaving like a commodity.
The target may now be calculated at two degrees, so it widens to a small zone. Because minor wave 3 exhibits no Fibonacci ratio to minor wave 1 it is more likely that minor wave 5 will exhibit a Fibonacci ratio to either of minor waves 3 or 1, and equality in length with minor wave 1 is the most common ratio for a fifth wave.
If price breaks below 2,342.27, then the degree of labelling within minor wave 5 would be moved up one degree. It is possible that it could be over at today’s high. A new low below 2,342.27 would strongly indicate that primary wave 3 could be over in its entirety and primary wave 4 may then have arrived.
TECHNICAL ANALYSIS
WEEKLY CHART
Click chart to enlarge. Chart courtesy of StockCharts.com.
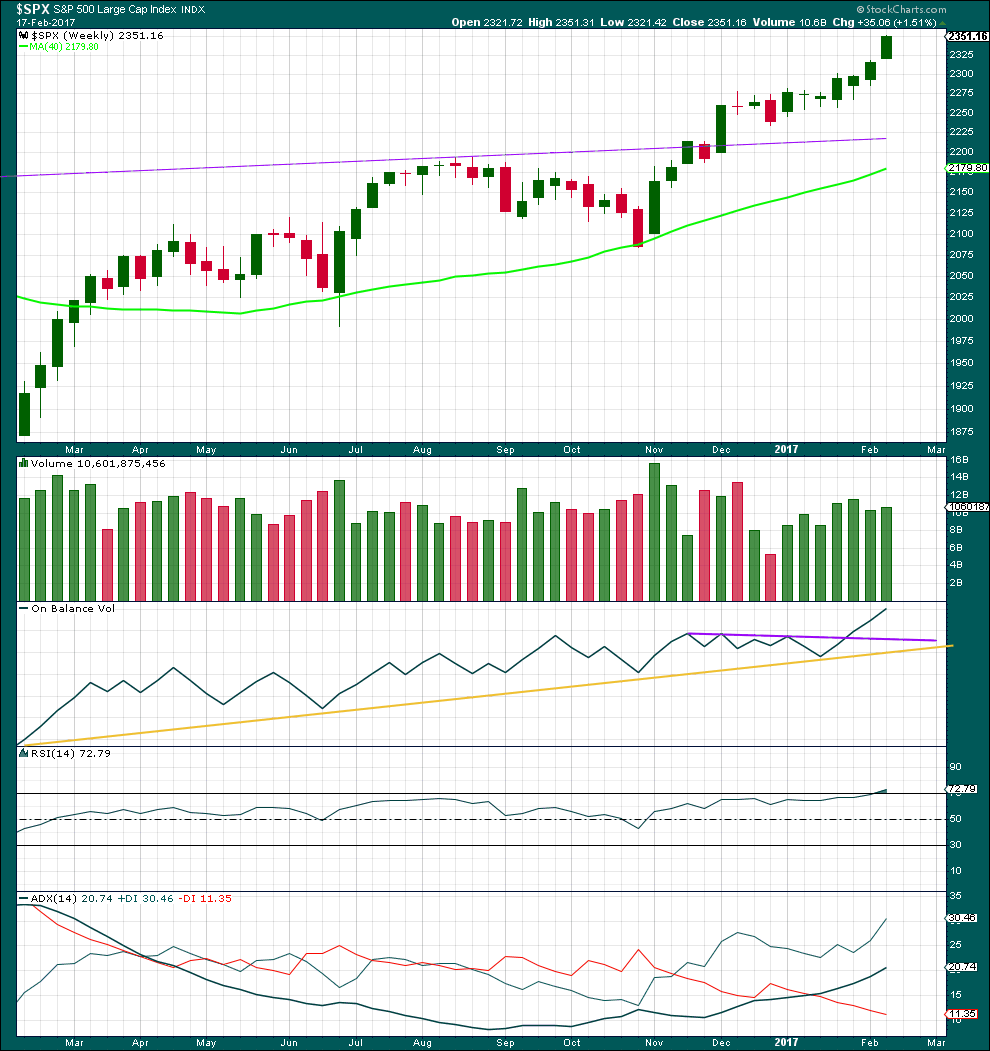
Last week completes the third candlestick in a Three White Soldiers pattern on the weekly chart. This is a bullish continuation pattern. The lower edge of the first candlestick may now offer support about 2,267.21.
A slight increase in volume last week beyond the prior week is also bullish.
On Balance Volume at the weekly chart remains very bullish.
RSI is only just now entering overbought at the weekly chart level. This may remain extreme for a few weeks during a strong trend. At this stage, it does not exhibit any divergence with price to indicate weakness.
ADX still indicates an upwards trend that has some distance to travel before it becomes extreme.
This weekly chart is very bullish indeed.
DAILY CHART
Click chart to enlarge. Chart courtesy of StockCharts.com.
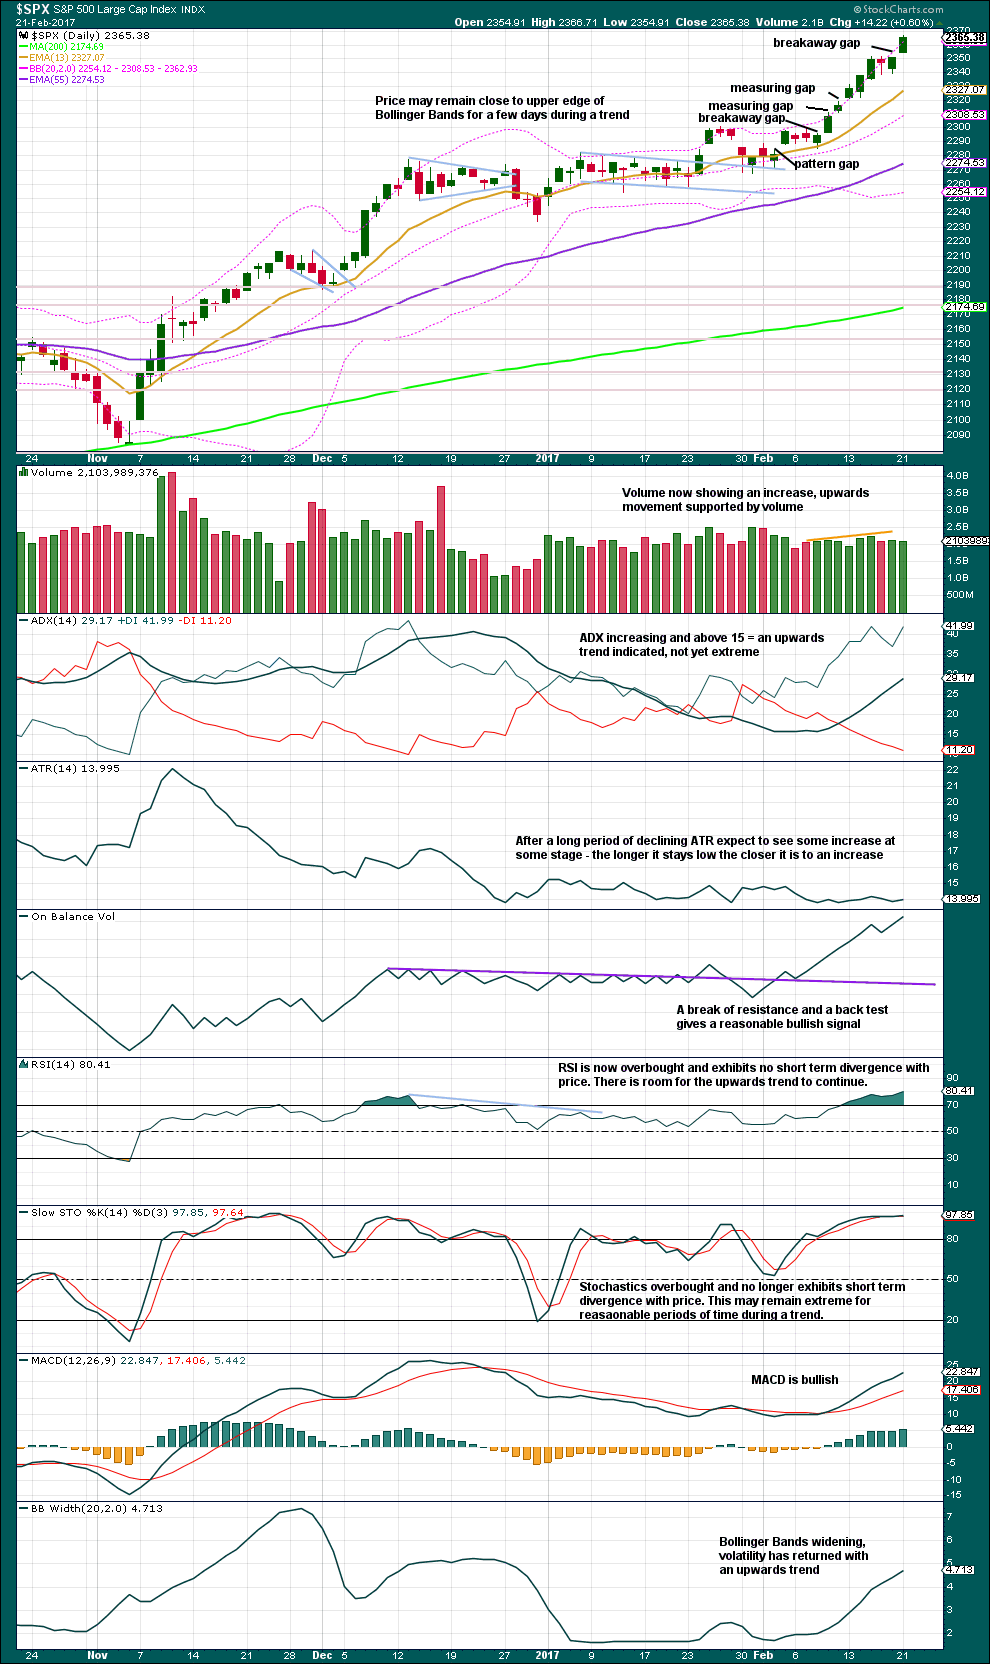
A breakaway gap upwards indicates the small consolidation, lasting only two days, is over. This gap may offer support.
Volume for the last two sessions of upwards movement is light with a slight decline today. The upwards movement in price was not supported by volume today. This is slightly bearish but not enough to call an end to this trend here.
Only when there is divergence at highs between RSI and price, while RSI is overbought, will an end to this trend be expected. So far there is no divergence at the daily chart level to indicate weakness. This trend can continue. This chart remains very bullish.
VOLATILITY – INVERTED VIX CHART
Click chart to enlarge. Chart courtesy of StockCharts.com.
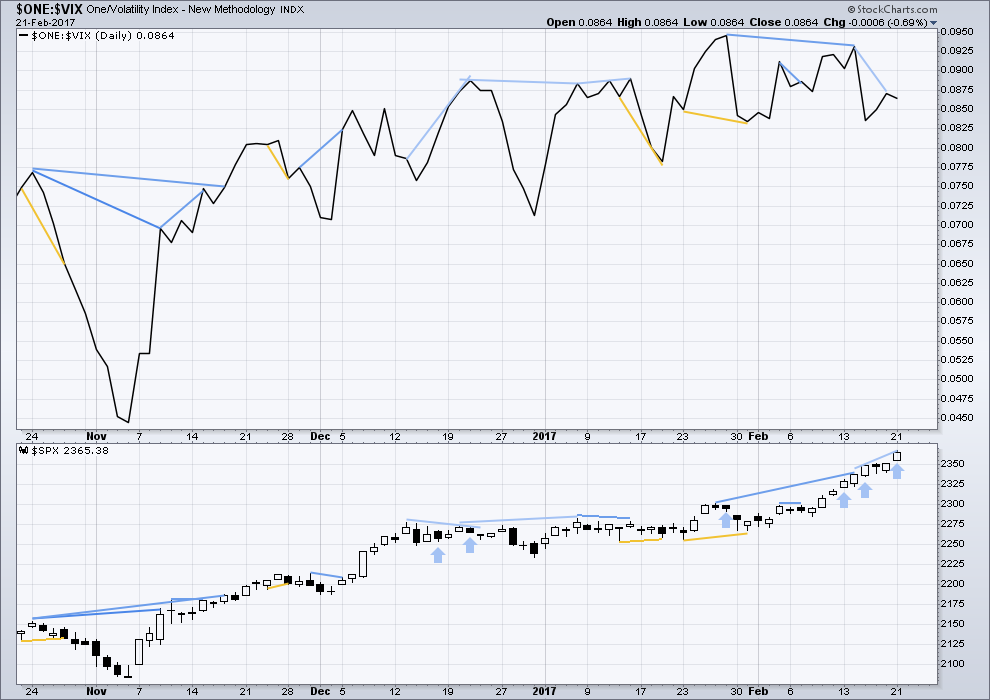
There are a few instances of multi day divergence between price and inverted VIX noted here. Bearish divergence is blue. Bullish divergence is yellow. It appears so far that divergence between inverted VIX and price is mostly working to indicate short term movements spanning one or two days. While this seems to be working more often than not, it is not always working. As with everything in technical analysis, there is nothing that is certain. This is an exercise in probability.
Recent single day and multi day bearish divergence between price and inverted VIX has not been followed by any downwards movement. Price continues to rise higher. Today completes another day where price and VIX diverged: price moved up but volatility increased. Normally, volatility should decline on rising price. There is double multi day divergence now between price and inverted VIX. This is bearish.
Either VIX is now decoupled from this market, or this persistent divergence will be resolved by primary wave 3 ending sooner than expected and primary wave 4 beginning very strongly. This divergence signals traders to be very cautious; assume the trend remains the same, but if entering the trend be aware for the potential here of a swift drop in price and use stops accordingly. Risk no more than 1-5% of equity.
Warning: Watch this market closely. If it begins to move down, then downwards movement could be very quick.
BREADTH – AD LINE
Click chart to enlarge. Chart courtesy of StockCharts.com.
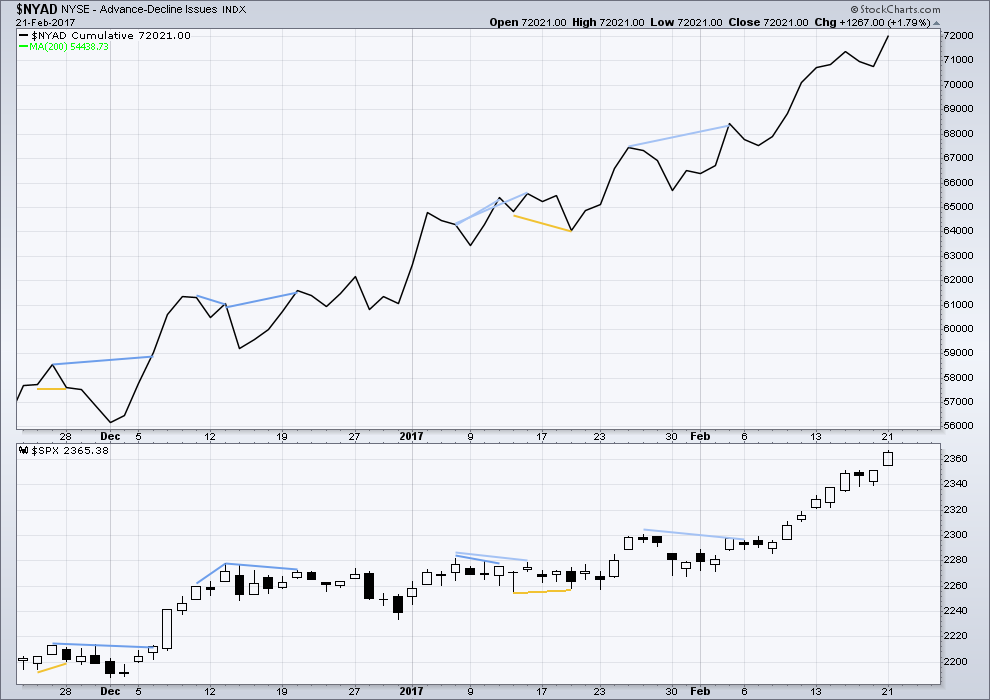
There is no short nor mid term divergence today between price and the AD line. The rise in price to a new high today was accompanied by a corresponding new high in the AD line. The rise in price has support from a rise in market breadth. Lowry’s OCO AD line also shows new highs along with price. Normally, before the end of a bull market the OCO AD line and the regular AD line should show divergence with price for about 4-6 months. With no divergence, this market has support from breadth.
There is no new divergence for some time between price and the AD line. The rise in price is supported by a corresponding rise in market breadth.
DOW THEORY
The DJIA, DJT, S&P500 and Nasdaq have made new all time highs in December of 2016. This confirms a bull market continues.
This analysis is published @ 8:20 p.m. EST.
Lara, if minor-4 triangle is complete, it would have a very small footprint on the daily chart relative to waves 1, 2, and 3. Is that the “right look”? Would that pattern be indicative of the nearly ended euphoric market getting ready for a fall?
You’re right, and I have considered that.
It’s not too bad. And TBH the S&P just doesn’t always have great looking waves at all time frames.
Lara, as per your experience, in which time frame S&P usually have reliable wave counts? And in which time frame its reliability poor? Thanks.
Updated hourly chart:
a triangle may be complete. maybe another upwards gap and go tomorrow? another short little fifth wave?
lets see if this triangle structure holds through the end of this session. if price can stay above 2,358.18 (thats the low I’ve labelled minute a of the triangle) then it will remain valid. A new low below that point and this correction would morph into some kind of combination or flat.
I like the charts; a lot. Is it accurate that a fifth wave often ends mid channel? That would allow a few more days meandering upwards towards the target.
I appears to be time to start planning an exit from my longs that are nicely profitable now. Another gap and go day will be great. I will expect tomorrow or Friday and the outside on Monday. Short term account only. Mid and Long term, undecided.
Often, yes, they do. In this case though the whole of minor 4 (if it’s over today) is within the upper half of the channel. Minor 5 for this instance looks like it may end about the upper edge.
I’ll add a mid line.
Updated daily chart:
with what looks very much like a triangle unfolding on the hourly chart today, what if this is minor 4? and the last triangle was minute iv? the Elliott channel now has a slightly better fit.
the end of primary 3 may be a bit closer than the target expects. and I need to adjust my label for that back to only 2,382
A quick question for those of you with automatic triggers for prices in your trading account.
Have you been getting triggers that don’t seem to be reflected in the acutal chart when you check your live feed?
There are some very strange triggers flooding into my inbox, and I mean STRANGE,(10-15% price swings!) that are not at all even remotely showing up when I look at the relevant charts.
That’s weird Verne. I don’t use triggers. I hover 🙁
I think Mr Market is a bit broken.
As Vern noted below, overnight futures are no longer as reliable indicator of what will happen during the next day’s trading as it used to be.
I am guessing today’s action is part of a correction that started yesterday morning around 10:45 AM. I’ll let Lara label it. It looks like a flat and it may be completed. A move above 2366.71 would give confidence the correction is over. However, a move below 2352 indicates a correction of much higher degree is beginning.
Actually, it looks like a triangle. That’s how I’m gonna label it.
I’m curious how you more seasoned guys would mark up the hourly chart given this morning’s low. Could minor-i label be moved to the afternoon high and this morning’s low be minor-ii?
I’d like to hitch a ride on minor-iii but can’t see it as having started yet. In this game I suppose my impatience is not a virtue.
Ronald, the move off of 2340 to 2366 looks impulsive and could be considered a first wave of a larger 5 wave impulse. Yes, it could be 1-2 so far. But the label ‘minor’ as you have it, does not coincide with Lara’s use of ‘minor’. Lara would label it minuette or even subminuette.
Thanks, Rodney.
great waves tho, haven’t been home and had a splash for ages. margaret river guys the best waves
Boy of boy. This is certainly interesting. Thanks Lara for your thoughtful and forthright commentary. Interesting indeed. After hours trading has the SPX up another 12 points. Are we seeing a blow off top?
Lara
I now you mentioned you don’t follow the news, however I do think on the 28th Feb , ( the leader of the free world. God help us) will deliver his take on things. State of the union address. I imagine if he doesn’t place any clarity on his tax plans during his speech the market may not like it. However it could also be the opposite. Just my take on things. I do think tho the risk is very much too the downside now. Maybe back down too 2200
As always your commentary is brilliant
best regards, have a wonderful day
LOL
Well, I follow local NZ news and vaguely some international stuff. I hate watching politicians speeches, with very rare exceptions. Trump is not an exception.
So thanks for the heads up. I’ll be watching out for it and doing my best to avoid 🙂
Frump not an exception, you couldn’t have said it any better LOL
Could we keep it apolitical please. At least one of us admires a President who actually get things done, albeit with a certain blunt coarseness.
yes, lets keep politics out of it. I”ll keep my eyes open for news that Trump has actually done something. And I’ll bite my tongue about what he has done so far.
Futures prices for a long time now has not been a reliable barometer of intra day price action, further evidence that buying in this market is most likely due to bankster infusion. They have not admitted it as Japan has, but the persistently low volume is a big clue. They have to keep moving, like sharks, if they stop, they die…
Verne
you thinking the same as I am, correction on the way. Think the daily volume has been around 20 per cent lighter since mid december