
Friday completed an inside day which fits the Elliott wave count well.
Summary: Minor wave 4 may continue. Price may consolidate here for another three days.
A new low below 2,322.17 now would confirm minor wave 4 has arrived. At its end, minor wave 4 should offer an opportunity to join the upwards trend.
New updates to this analysis are in bold.
Last monthly and weekly charts are here. Last historic analysis video is here.
MAIN ELLIOTT WAVE COUNT
WEEKLY CHART

Click chart to enlarge.
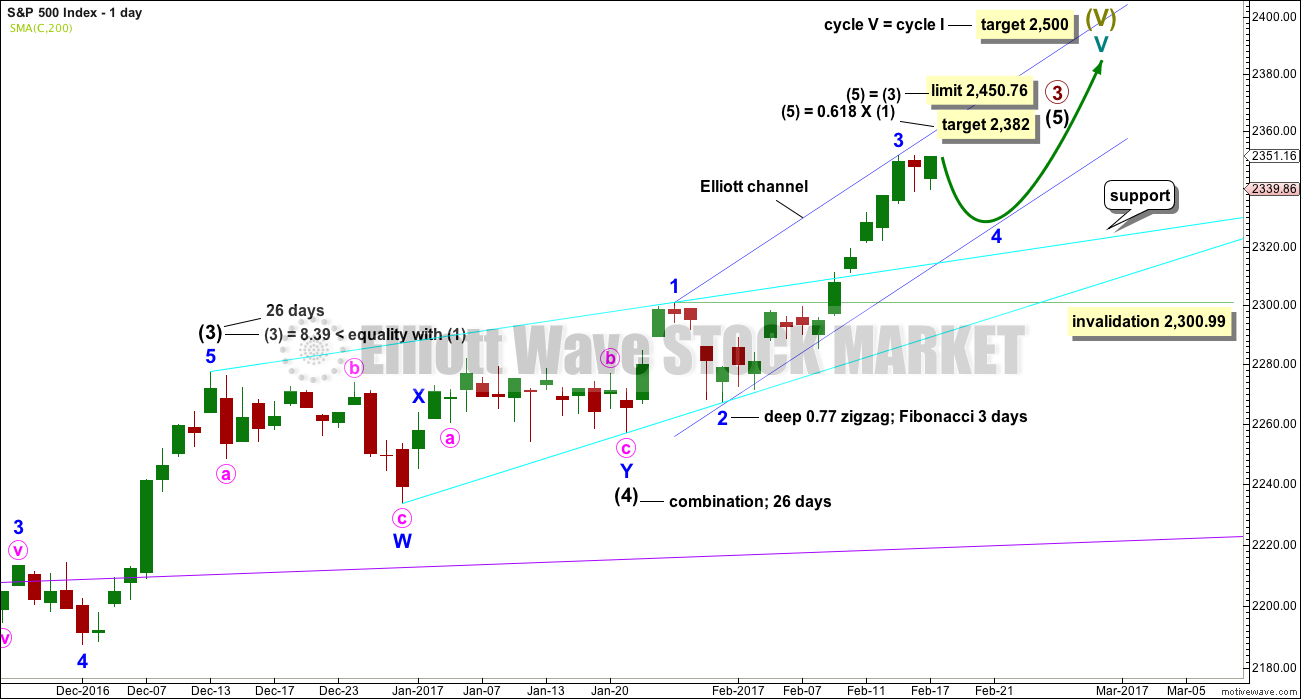
Cycle wave V is an incomplete structure. Within cycle wave V, primary wave 3 may be relatively close to completion.
When primary wave 3 is complete, then the following correction for primary wave 4 may not move into primary wave 1 price territory below 2,111.05.
Primary wave 2 was a flat correction lasting 47 days (not a Fibonacci number). Primary wave 4 may be expected to most likely be a zigzag, but it may also be a triangle if its structure exhibits alternation. If it is a zigzag, it may be more brief than primary wave 2, so a Fibonacci 21 sessions may be the initial expectation. If it is a triangle, then it may be a Fibonacci 34 or 55 sessions.
Primary wave 3 at this stage though is incomplete and shouldcontinue to move price higher if this wave count is correct.
DAILY CHART
Click chart to enlarge.
Intermediate wave (4) is a complete combination: zigzag – X – flat. It would have been even in duration with intermediate wave (3), both lasting 26 days.
Intermediate wave (3) is shorter than intermediate wave (1). One of the core Elliott wave rules states a third wave may never be the shortest wave, so this limits intermediate wave (5) to no longer than equality in length with intermediate wave (3) at 2,450.76.
Minor wave 3 has moved beyond the end of minor wave 1, meeting the rule.
Minor wave 2 was a deep 0.77 zigzag lasting three days. Minor wave 4 may exhibit alternation as a flat, triangle or combination and may last about a Fibonacci three or five days. It may not move into minor wave 1 price territory below 2,300.99.
Minor wave 4 may find support now at the upper cyan trend line. This may assist to force it to be very shallow. Minor wave 4 may not move into minor wave 1 price territory below 2,300.99.
Intermediate wave (5) has so far lasted 19 days. It may be expected to be shorter both in length and duration compared to intermediate wave (3). At this stage, an expectation of a Fibonacci 34 days total for intermediate wave (5) looks reasonable, so it may now continue for another 15 days or sessions.
The proportion here between intermediate waves (2) and (4) is acceptable. There is alternation. Both are labelled W-X-Y, but double zigzags are quite different structures to double combinations.
HOURLY CHART
Click chart to enlarge.
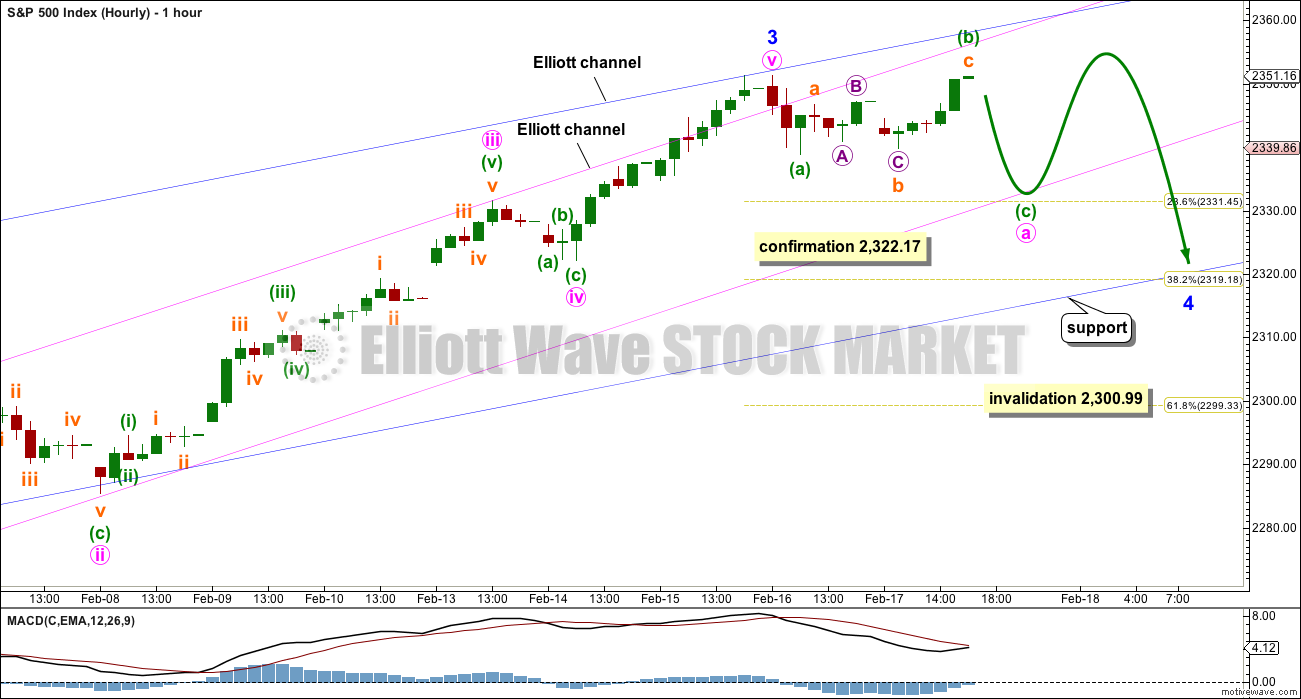
A new low below the start of minute wave v at 2,322.17 could not be a second wave correction within minute wave v, so at that stage confidence may be had that minor wave 3 is over.
Minor wave 4 may be a choppy, overlapping time consuming correction. It is most likely to be a flat, triangle or combination. Expanded flats are very common structures and they include B waves that move beyond the start of their A waves. A new high within minor wave 4 is entirely possible.
Flats, combinations and triangles are all more time consuming structures than zigzags. Minor wave 2 lasted a Fibonacci three days, so minor wave 4 at this stage may be reasonably expected to be longer in duration. A Fibonacci five days will be the expectation at this stage. If it does not look complete after a Fibonacci five days, then the next expectation would be for it to complete in a Fibonacci eight days.
Minor wave 4 would most likely end about either the 0.236 or 0.382 Fibonacci ratios.
Minor wave 4 may end within the price territory of the fourth wave of one lesser degree; minute wave iv has its territory from 2,331.58 to 2,322.17.
If it gets down that low, or takes long enough, minor wave 4 may find support at the lower edge of the wider blue Elliott channel that is copied over from the daily chart.
A zigzag downwards may be unfolding for minute wave a.
There are multiple structural options open for minor wave 4 at this very early stage. The labelling within it will change as it unfolds, as the structure becomes clearer. My focus next week will be to identify when minor wave 4 may be considered complete in order to find an entry to join the upwards trend.
At this stage, I can still not see minor wave 4 as a complete corrective structurem, so expect it to continue.
Although the arrow indicates an expanded flat (because this is the most common structure), this does not mean that this must be how minor wave 4 unfolds. It may be a triangle which would see sideways movement in an ever decreasing range for a few days.
TECHNICAL ANALYSIS
WEEKLY CHART
Click chart to enlarge. Chart courtesy of StockCharts.com.
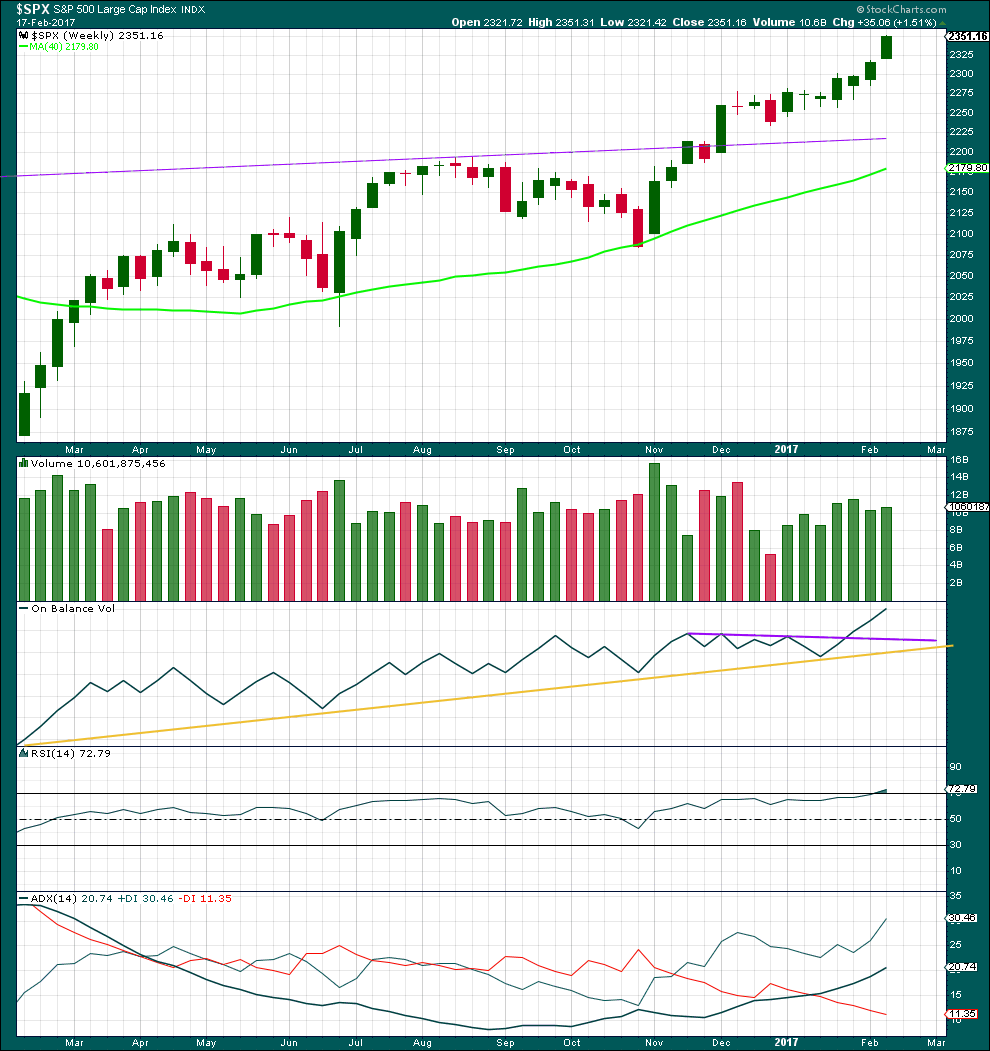
This week completes the third candlestick in a Three White Soldiers pattern on the weekly chart. This is a bullish continuation pattern. The lower edge of the first candlestick may now offer support about 2,267.21.
A slight increase in volume this week beyond the prior week is also bullish.
On Balance Volume at the weekly chart remains very bullish.
RSI is only just now entering overbought at the weekly chart level. This may remain extreme for a few weeks during a strong trend. At this stage, it does not exhibit any divergence with price to indicate weakness.
ADX still indicates an upwards trend that has some distance to travel before it becomes extreme.
This weekly chart is very bullish indeed.
DAILY CHART
Click chart to enlarge. Chart courtesy of StockCharts.com.
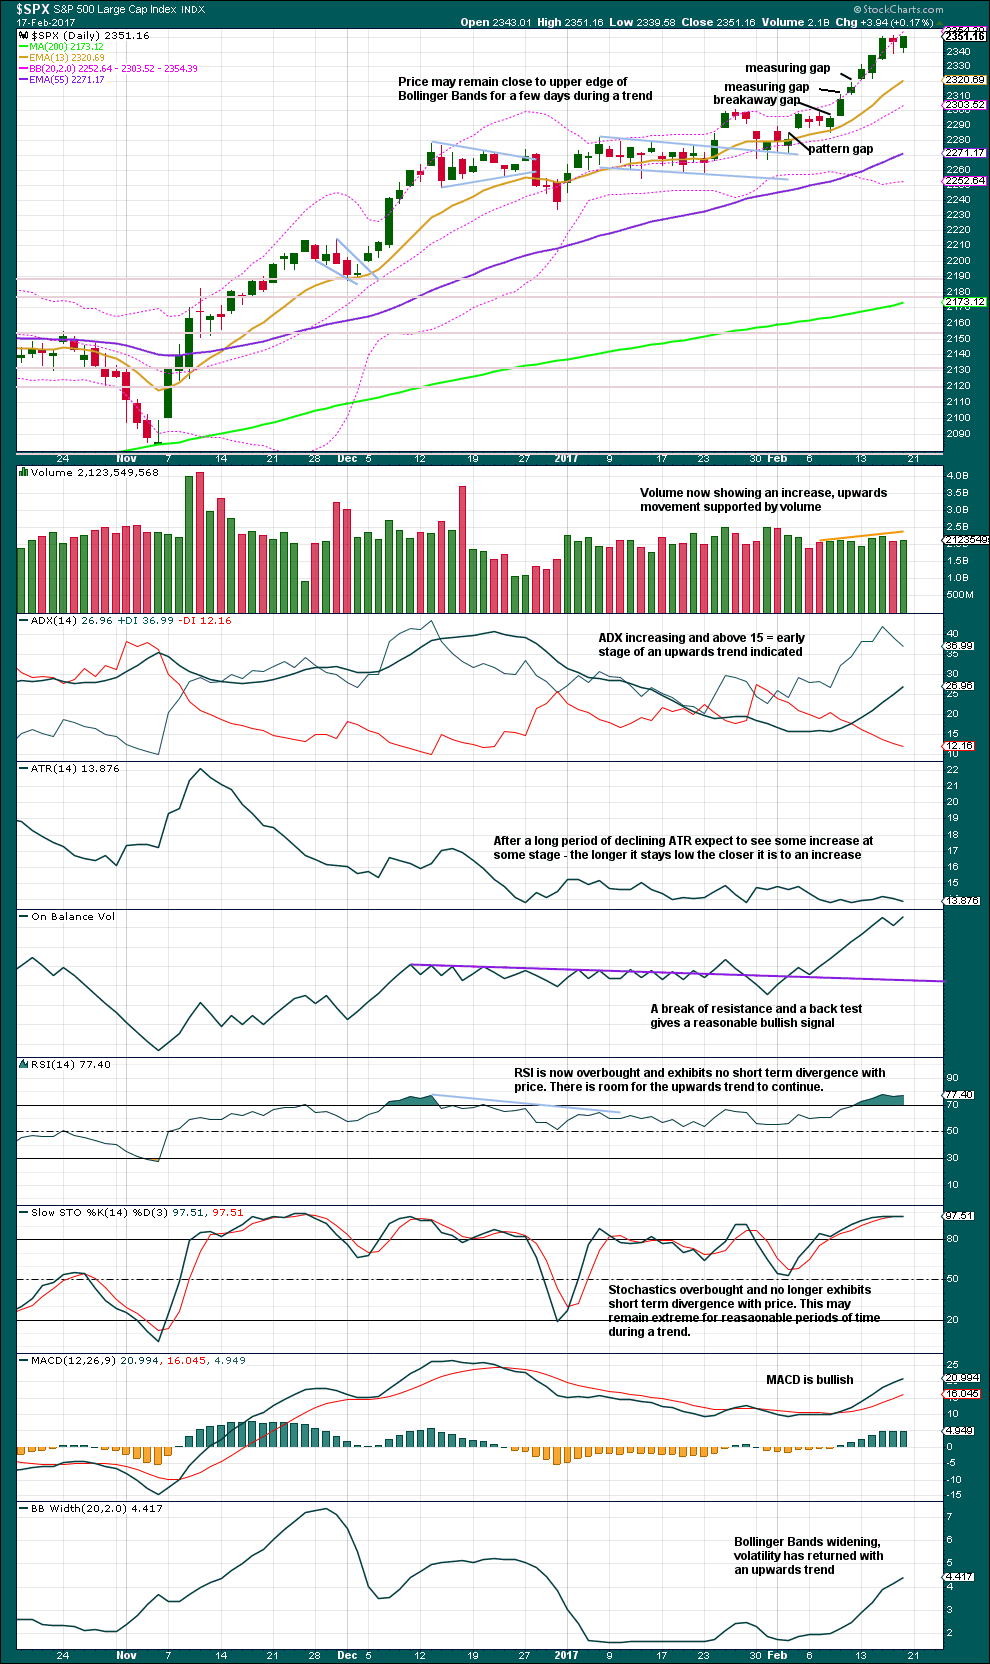
Friday is an inside day with the balance of volume upwards. There was some support for the rise in price during the session with an increase in volume. This is bullish.
With RSI overbought at the weekly and daily chart levels, it would be reasonable to look out for a small consolidation to relieve this extreme. This supports the Elliott wave count.
This daily chart is also very bullish.
VOLATILITY – INVERTED VIX CHART
Click chart to enlarge. Chart courtesy of StockCharts.com.
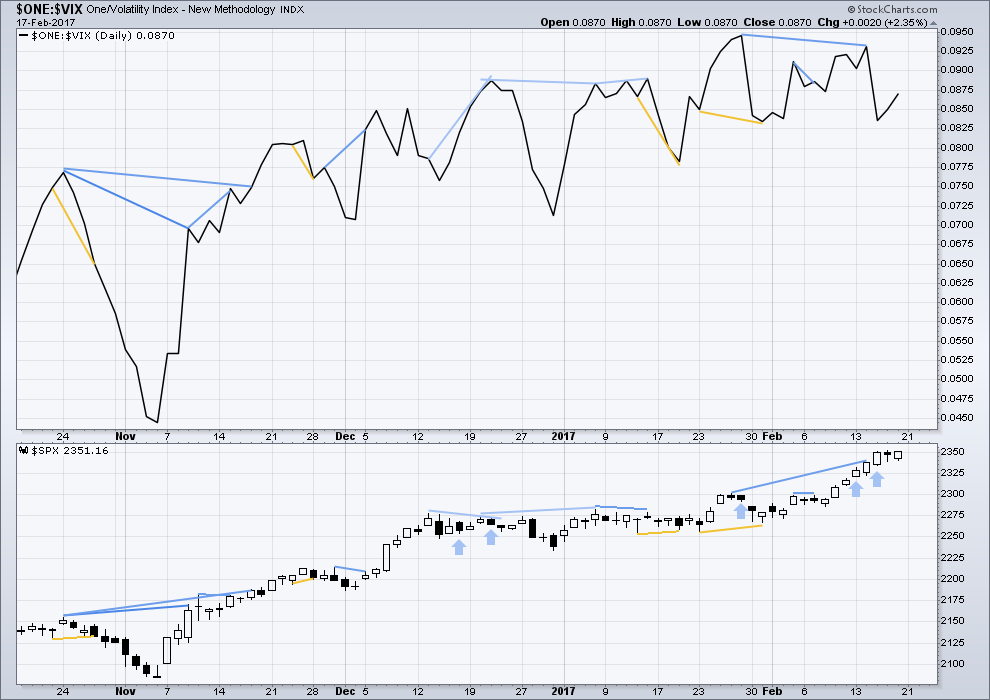
There are a few instances of multi day divergence between price and inverted VIX noted here. Bearish divergence is blue. Bullish divergence is yellow. It appears so far that divergence between inverted VIX and price is mostly working to indicate short term movements spanning one or two days. While this seems to be working more often than not, it is not always working. As with everything in technical analysis, there is nothing that is certain. This is an exercise in probability.
Thursday saw the strongest divergence yet between price and VIX. Price moved strongly higher with support from volume. Normally, volatility should decline on rising price as it almost always does. However, inverted VIX moved strongly lower. Volatility sharply increased as price moved higher. The increase in volatility is quite reasonable, so this is not a small divergence.
This divergence indicates something wrong during Thursday with the upwards movement from price, and it is interpreted as very bearish. It has been followed by an upwards day (just, technically) with a balance of volume downwards and then an inside day also with the balance of volume upwards. This strong divergence may still be followed by more downwards movement before it may be considered resolved.
Bearish mid term divergence is still in place.
BREADTH – AD LINE
Click chart to enlarge. Chart courtesy of StockCharts.com.
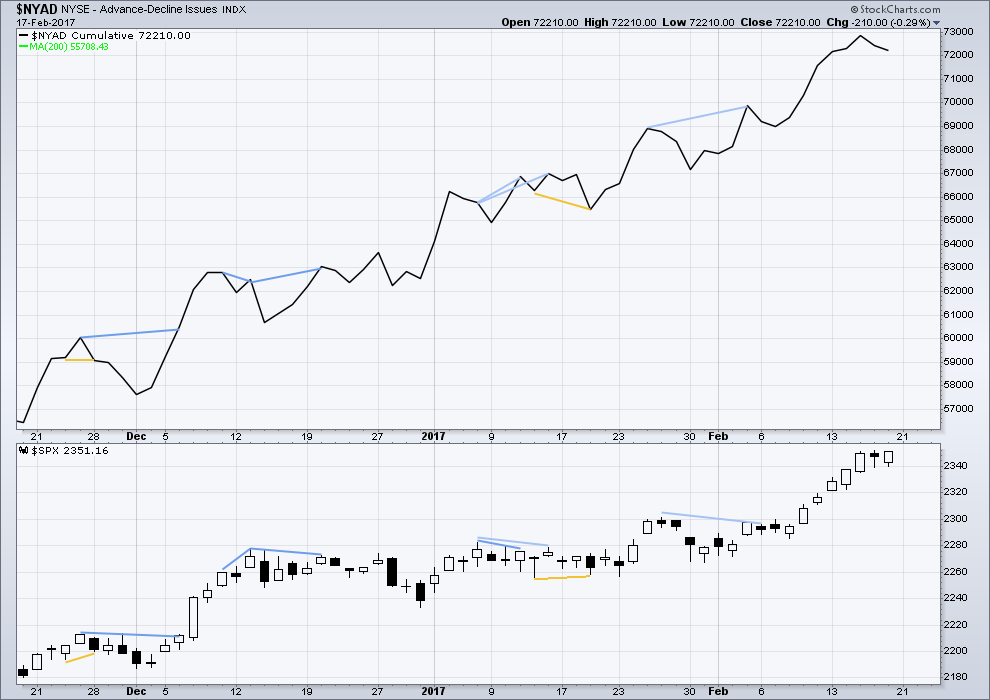
There is no short nor mid term divergence today between price and the AD line. The rise in price to a new high today was accompanied by a corresponding new high in the AD line. The rise in price has support from a rise in market breadth. Lowry’s OCO AD line also shows new highs along with price. Normally, before the end of a bull market the OCO AD line and the regular AD line should show divergence with price for about 4-6 months. With no divergence, this market has support from breadth.
Price moved sideways for Friday to complete an inside day. The candlestick closed green and the balance of volume for the session was upwards. Normally, the AD line should also rise, but for Friday it declined. Upwards movement during the session did not have support from market breadth and this makes sense if it was a B wave. This supports the Elliott wave count.
DOW THEORY
The DJIA, DJT, S&P500 and Nasdaq have made new all time highs in December of 2016. This confirms a bull market continues.
This analysis is published @ 7:07 p.m. EST on 18th February, 2017.
I think minor 4 was over as a relatively brief and very shallow triangle.
Minor 5 has a limit now because intermediate (5) has a limit.
I’ve labelled only minute i within minor 5 complete. The degree of labelling could be moved down one degree, it could be minor 5 is over today. But we should assume the trend remains the same, until proven otherwise. Assume the S&P will keep going up while price remains above 2,342.27.
If price breaks below 2,342.27 at this stage then that means primary 3 is over and primary 4 has begun, most likely. Primary 4 should last months so that’s a major correction within a bull market.
But for now, primary 3 is probably continuing.
Gaps can be useful for trading. Breakaway gaps are rarely filled (short to mid term anyway) so they can offer support. Stops could be moved up to the lower edge of the gap to protect more profit now on long positions.
If entering this market stops may be set using the gap as support. Always always use a stop. If primary 3 ends and primary 4 turns up earlier than expected you do not want to be holding a long position for a multi week to months long correction. (Unless of course you’re an investor with a much longer horizon.)
I think this count is correct. Iam secretly hoping that VIX stops its divergence as the potential third wave up unfolds. It would give me personally much more confidence that the next move down would be just another correction with one final wave up to come. If price continues to diverge, what that means is that it will have to eventually catch up with the downside action in inverted VIX, like a rubber band stretched to its elastic limit and suddenly released. Remember markets generally fall much faster than they rise, and the speed and angle of the current move up imo warrants caution.
Trade safe, and have a great evening everyone!
An excellent point. Thank you so much Verne for sharing that.
I’m nervous to enter long here with the top possibly very close… it feels so wrong which means it may be so right….
There were actually two gaps this morning. The last one to complete minute one was filled, the earlier one was not. If upward movement is done that gap should be filled early tomorrow. The thrust from the fourth wave triangle is quite typical and usually a terminal wave.
Very possibly. I would note that the divergence with inverted VIX is intensifying as volatility again fails to confirm the new all time highs and posting a lower high. Of course this could change by the close but I think it is also something to watch…
Agreed. Another green candlestick for VIX when the SPX is up is a significant red flag. It brings concerns for the bullish case.
Well yeah, normally it would.
Except we saw that happen on the 15th of February and it has now been followed by a bit of sideways movement, now upwards movement.
So my reading of that strong and strange divergence as very bearish didn’t follow with any downwards movement.
we live in very strange times.
My guess, 15 minutes into the day with a 9.5 SPX move up, is that Minor 4 is completed. We will see what Lara has to say, however. But RSI on the daily has moved upwards as well. Lara noted that Minor 4 could make a new high within the correction. She noted the indicator to watch is RSI. In any event, I think Minor 4 is over and Minor 5 to the 2382 minimum target is underway.
This makes the third consecutive correction which has been shallower and shorter than expected. I think this demonstrates a strong bull market. I am beginning to think the 2500 SPX target for Cycle wave 5 may be too low. There could be a lot of 5th wave extensions to come.
My trading strategy is to hold onto longs until completion of Primary wave 3. Then I may take some short positions for Primary wave 4 in my short term trading account. Mid-term and long-term accounts will not hold short positions.
Have a great day is this wild and wily market.
I think you’re right Rodney. Buy and hold in this market is working well for you.
I can see minor 4 as a small complete triangle.
This upwards movement is more than 2X what would be wave A. So a flat correction continuing for minor 4 has a very low probability, the idea should be discarded. I’m discarding it.
Happy President’s day to all in the US.
The main wave count calls for a minor wave four correction which many analysts are expecting to be shallow. Indicators are indeed bullish (breadth and historic volume cautionary imo) and just when you think things could not get any more stretched, they do exactly that. Strange things are happening with volatility- historic things in fact.
Lara mentioned the recently observed powerful and unprecedented divergence we saw with price and VIX. The attached chart shows inverted VIX in rarefied air indeed. The last time at these levels showed a double penetration of that top line so we may get another one with a minor five up. Whatever takes place, it does appear that an increase in volatility is in our not-too-distant-future.
James Flanagan of Gann Global Financial recently gave an interesting seminar in which he talked about W.D. Gann’s observation of the interesting price action occurring in years ending in seven, a number he considered fatal for markets. Some analysts like (Avi Gilburt) are contending that this third wave up is just getting started and we will not see a major top for at least another year, and even then, he is absolutely confident that the correction will not be a crash, but only a ten to fifteen per cent correction sometime next year. I must say I admire his optimism. I cannot say I agree with it. Here is what I find interesting about the current market situation – we had persistently bearish signals in the market for a period of almost two years, that were all subsequently decisively negated as we moved on to new all time highs in all the indices. How much credence to place in the reverse situation, considering the outcome of the former?
Here is the performance of a few years ending in seven, per Gann’s observations.
1807 – 53% 13 months
1857 – 50% 9 months
1907 -45% 10 months
1917 -40% 13 months
1937 -46% 9 months
1957 -20% 3 months
1977 -20% 17 months
1987 -36% 2 months
2017 ??? ???
Voice of reason Verne. If you want to geek out, apply gans square of 9 and EW. It’s pretty fun and has something in store in the next few weeks. 😉
For the very Geeky indeed. Getting the time cycles right is the big challenge. I tend to keep it simpler with a rough fib guideline. I am quite curious about the fact that while quite a few EW analyst agree with the third wave call, both the designation of wave degree and origin widely varies, and of course that is critical for trying to decide the probable depth of any corrective wave. The last analysis I saw from EWI had their minor wave starting at the June 27 low from last year, a vastly different time duration from Lara’s. They are also seeing a minor three of a final fifth wave up at multiple degrees toward a final top. Lara’s labels best reflect the waves’ momentum imo.
So…what does your square of nine analysis tell you about the depth of the upcoming correction, and are you expecting it be at EW minor degree?
Square of nine analysis has the SPX in wave 5 of 5 beginning Feb. 11, with an expected completion date of March 28th, followed by an estimated 1467 point wave 1 down of the coming Supercycle Bear Market. Basically this parabolic rally has been approaching the 360 degree termination level at 2383; plus or minus 11 points.
Thanks Chris. I am frankly quite surprised at how few other folk have commented on the clearly visible parabola in so many charts. It is quite pronounced in inverted VIX.
Quick query on the Gann analysis. How do you determine your time cycles? If it is too complicated no worries….
It is complicated, but it breaks down as follows: the lunar year (362 NW), lunar month (28), solar month (31), 7cd of the week, 60 min (61 SC), 24 hours (23 NC), one hour and one minute.
Thanks again Chris. It is absolutely stunning to think that Gann had neither computer nor calculator when he made these calculations…
I lived and lost money during the 1987 one… so I remember it very well.
Look, I have been trying to play this Big Cycle Bear market for 5 years now… I have thrown in the towel! No Mass!
It ain’t going to happen… Forrgettabout it! Excuse my Brooklyn!
The only way it happens is if it starts RIGHT NOW!
If it doesn’t start NOW… It ain’t going to happen… Forrgettabout it!!!!!
This is just PURE FICTION!!!! DJIA to 40,000.
Welcome Verne, Gann is pretty much my favorite along with Leonardo Bonacci. Also, I feel pretty lucky to only be down 10% on my UVXY long, so that’s a win…..
I could be completely wrong, but I also am long volatility…as Lara correctly observes, we are living in strange times…
Something’s gotta give Verne, and with liquidity down, breadth manipulated by etfs, investors lulled to sleep with passive funds, earnings awful, hard data not matching soft data, shipping indexes crashing, China printing as if they’re gonna run out of ink, sentiment extremes, Commitment of Traders extremes, rise of populism, Japan gobbling up all financial assets etc. I’m going to take the long volatility trade all day. Plus if you know options you can hedge out the decay and contango pretty easily.
And Deutche Bank crashed – 76% drop, and the bond markets are still down. Something’s gotta give…..
It will come. It will come eventually. Not right now I think, but soon.
Exactly Lara, you have AIG in the same position, if not worse than 2008. None of the banks in Europe are solvent, case in point HSBC today. Then to top it off, US GSE’s FNMA, and FEMMA are both down 30% today!!!
Oh wow! Thanks for the tip Chris. Just looked at FNMAH and FNMA… down over 20% in one day is the technical definition of a crash for sure.
That’s what too much ballooning debt will do. Eventually things crash.
I’m hoping this will filter through sooner rather than later to the NZ property market bubble. NZ now has the most expensive property in the world compared to our pitiful incomes. This bubble is causing all kinds of havoc; homelessness and more poverty as rents rise, a younger generation now “generation rent”. It’s gotta pop and prices have to come back to something reasonable. It’s not gonna be pretty, but it’s necessary IMO
It seems to me that the banksters are determined to try and arrest even the slightest decline. I was curious about why Northman Trader opined we would not get a correction but a crash but now I think I understand what he meant; namely, any serious decline from here on out will take place despite an all-out effort to prevent it. It could signal a loss of ability to keep the bubble inflated…
FNMAH and FNMA are worthless pieces of paper… why these are allowed to continued to trade is amazing.
They became worthless when they were taken over by the Govt…. that is similar to a Chapter 11… those shares are last in line and worthless!
Joseph is correct. Don’t forget the laws every where regarding financial institutions now allows them to seize your deposits during the next crisis and issue you (worthless) shares in their place.