
The short term target has been met and the mid term target remains the same.
Price continued higher and almost met the target, which was at 2,353, fitting the second hourly Elliott wave chart.
Summary: Minor wave 3 may be over today. Very strong divergence between price and VIX is bearish. Minor wave 4 may begin tomorrow and may last three or five days. It must remain above 2,300.99.
A new low below 2,322.17 now would indicate minor wave 4 has arrived.
New updates to this analysis are in bold.
Last monthly and weekly charts are here. Last historic analysis video is here.
MAIN ELLIOTT WAVE COUNT
WEEKLY CHART
Click chart to enlarge.
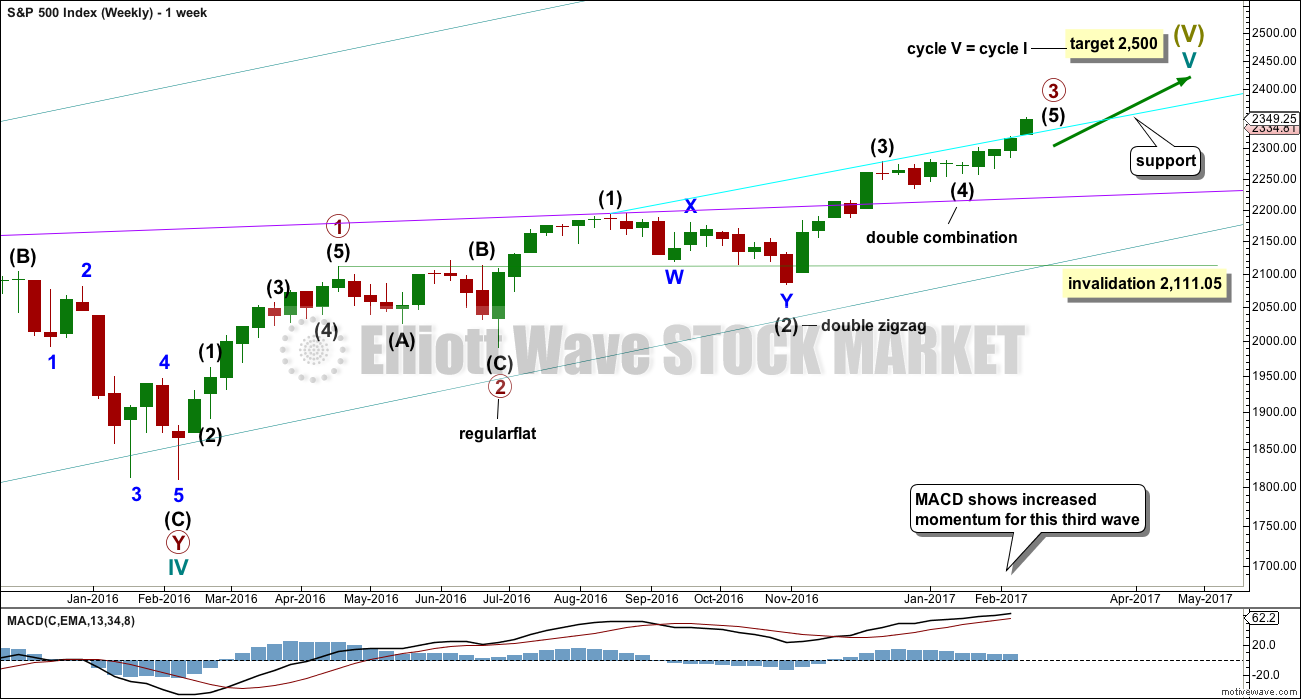
Cycle wave V is an incomplete structure. Within cycle wave V, primary wave 3 may be relatively close to completion.
When primary wave 3 is complete, then the following correction for primary wave 4 may not move into primary wave 1 price territory below 2,111.05.
Primary wave 2 was a flat correction lasting 47 days (not a Fibonacci number). Primary wave 4 may be expected to most likely be a zigzag, but it may also be a triangle if its structure exhibits alternation. If it is a zigzag, it may be more brief than primary wave 2, so a Fibonacci 21 sessions may be the initial expectation. If it is a triangle, then it may be a Fibonacci 34 or 55 sessions.
Primary wave 3 at this stage though is incomplete and may continue to move price higher.
DAILY CHART

Click chart to enlarge.
Intermediate wave (4) is a complete combination: zigzag – X – flat. It would have been even in duration with intermediate wave (3), both lasting 26 days.
Intermediate wave (3) is shorter than intermediate wave (1). One of the core Elliott wave rules states a third wave may never be the shortest wave, so this limits intermediate wave (5) to no longer than equality in length with intermediate wave (3) at 2,450.76.
Minor wave 3 has moved beyond the end of minor wave 1, meeting the rule.
Minor wave 2 was a deep 0.77 zigzag lasting three days. Minor wave 4 may exhibit alternation as a flat, triangle or combination and may last about a Fibonacci three or five days. It may not move into minor wave 1 price territory below 2,300.99.
Minor wave 4 may find support now at the upper cyan trend line. This may assist to force it to be very shallow.
Intermediate wave (5) has so far lasted seventeen days. It may be expected to be shorter both in length and duration compared to intermediate wave (3). At this stage, an expectation of a Fibonacci 34 days total for intermediate wave (5) looks reasonable, so it may now continue for another seventeen days or sessions.
Price has now broken above the cyan line. This line may now offer support.
The proportion here between intermediate waves (2) and (4) is acceptable. There is alternation. Both are labelled W-X-Y, but double zigzags are quite different structures to double combinations.
HOURLY CHART
Click chart to enlarge.
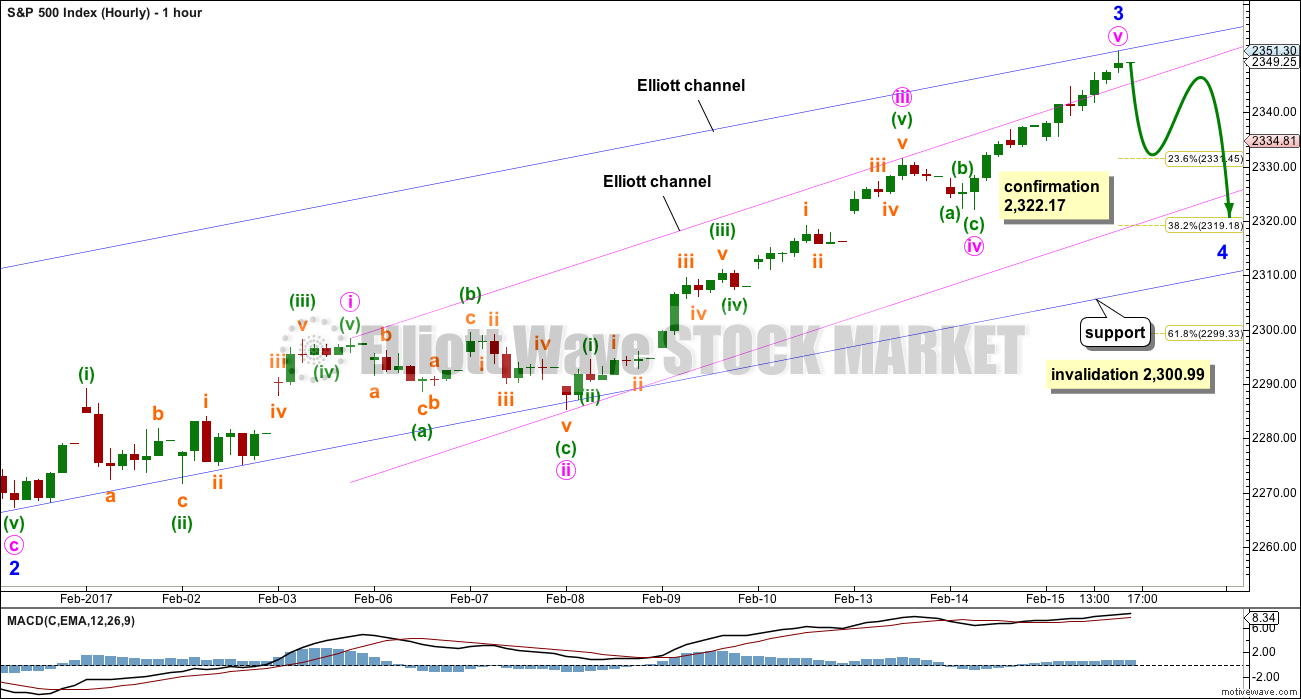
Price has broken above the upper edge of the pink Elliott channel drawn about minor wave 3. Minute wave v is behaving like a fifth wave within a commodity (the S&P sometimes does this).
Strong divergence between price and VIX today, a strong increase in volatility, points to lower prices tomorrow. This is the basis for a judgment call in this analysis that expects minor wave 4 to begin tomorrow.
A new low below the start of minute wave v at 2,322.17 could not be a second wave correction within minute wave v, so at that stage confidence may be had that minor wave 3 is over.
Minor wave 4 may be a choppy, overlapping time consuming correction. It is most likely to be a flat, triangle or combination. Expanded flats are very common structures and they include B waves that move beyond the start of their A waves. A new high within minor wave 4 is entirely possible.
Minor wave 4 would most likely end about either the 0.236 or 0.382 Fibonacci ratios.
Minor wave 4 may end within the price territory of the fourth wave of one lesser degree; minute wave iv has its territory from 2,331.58 to 2,322.17.
If it gets down that low, or takes long enough, minor wave 4 may find support at the lower edge of the wider blue Elliott channel that is copied over from the daily chart.
TECHNICAL ANALYSIS
WEEKLY CHART
Click chart to enlarge. Chart courtesy of StockCharts.com.
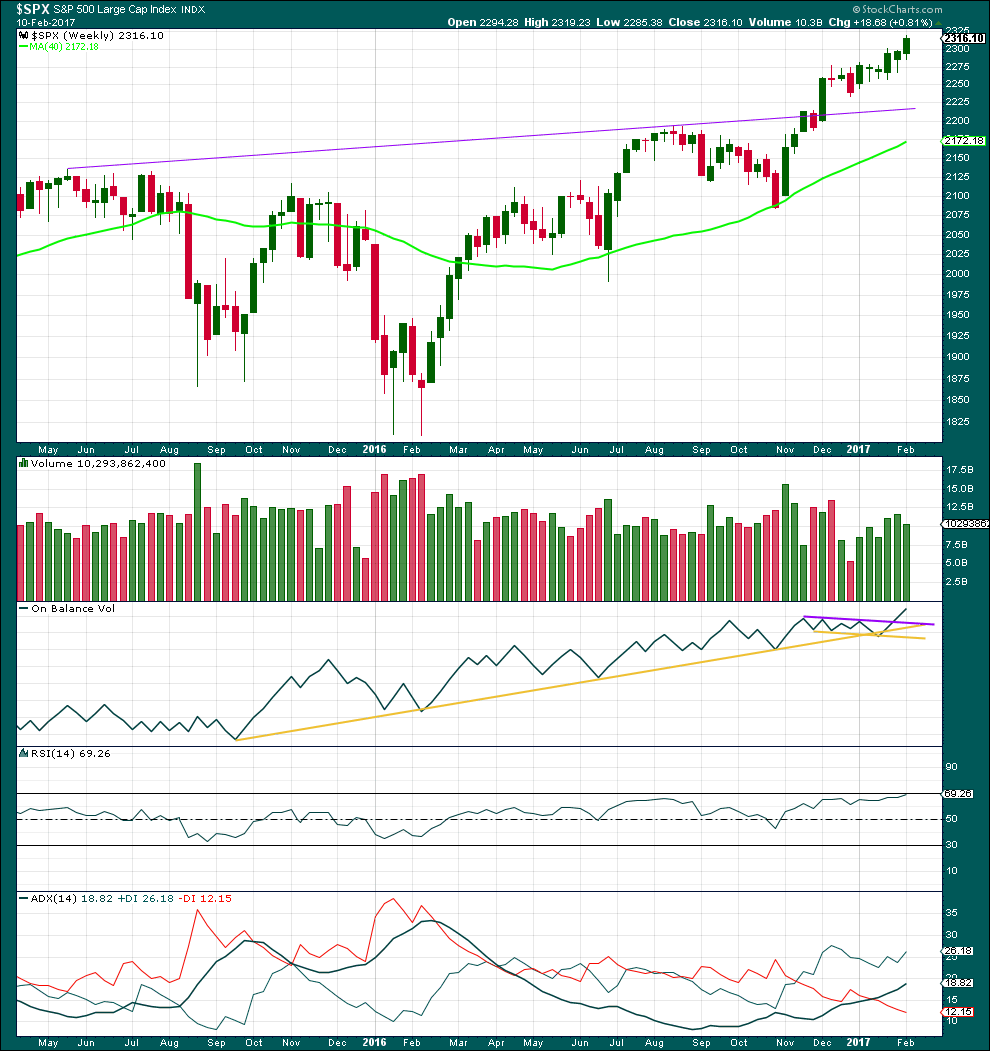
Overall, price is moving higher on increasing volume. Last week sees a decline in volume from prior week, but volume is still stronger than the first three weeks of upwards movement.
On Balance Volume gave a bullish signal with a break above the purple resistance line. This line may now offer support and assist to halt any fall in price from being too deep.
RSI is not yet overbought at the weekly chart level. There is room for price to rise further.
ADX indicates an upwards trend, and ADX has a long way to go before it becomes extreme.
DAILY CHART
Click chart to enlarge. Chart courtesy of StockCharts.com.
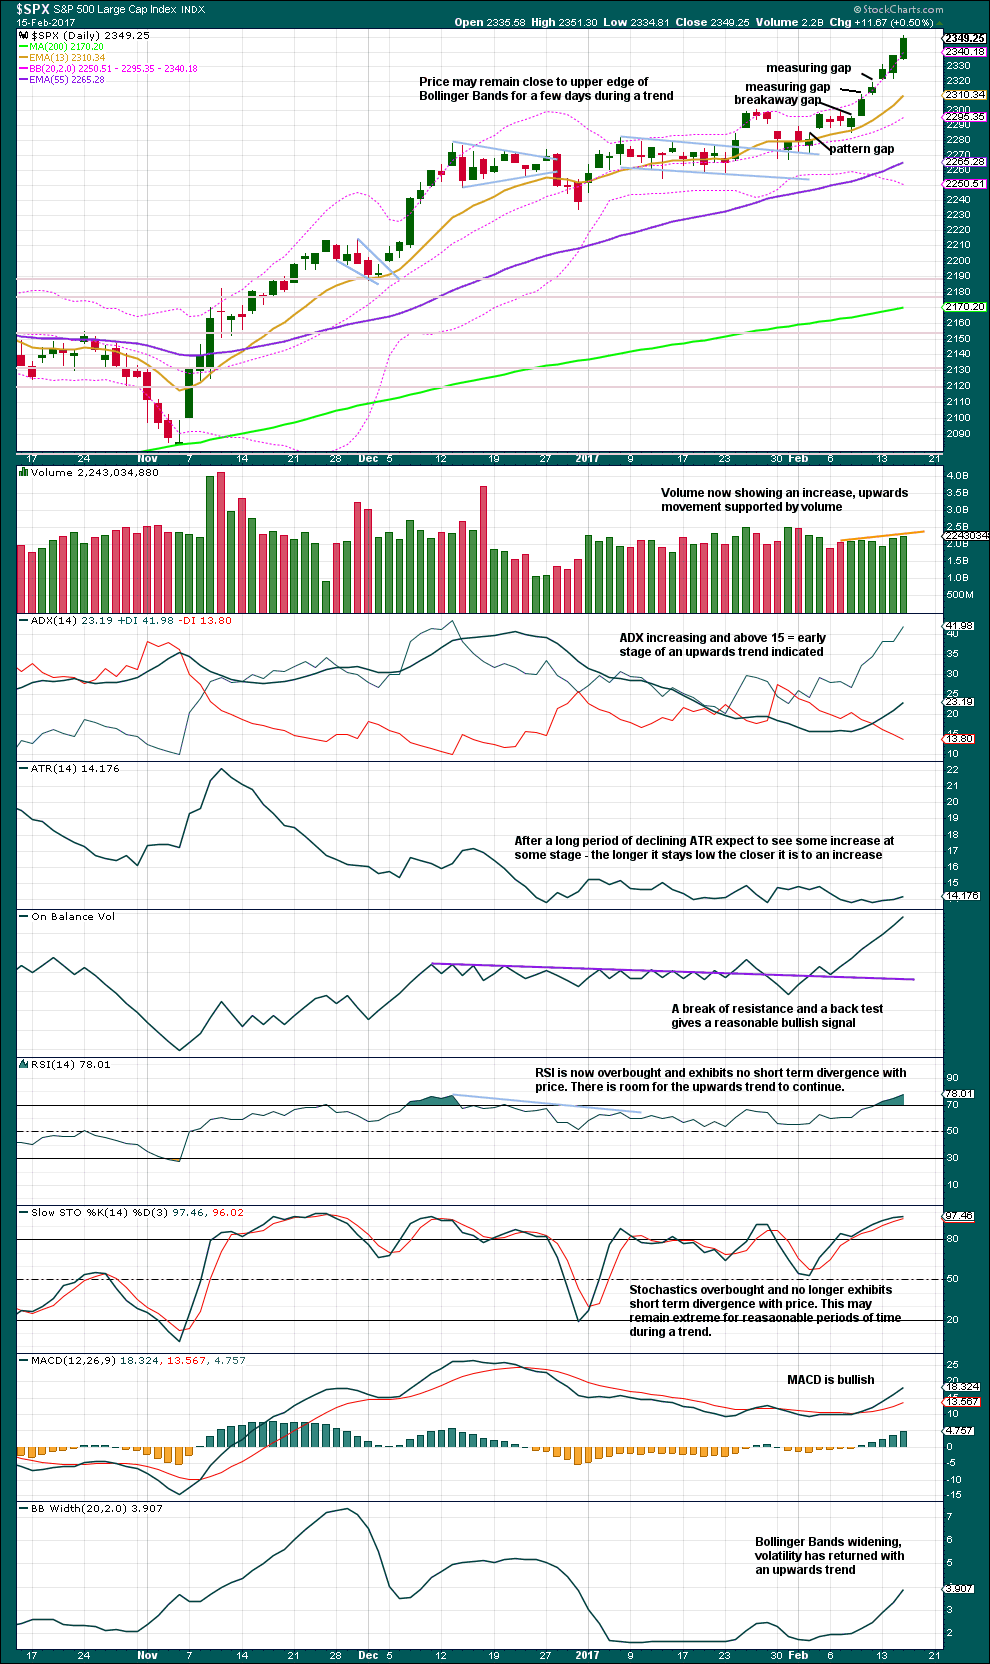
Another strong upwards day has support from volume. ADX still indicates an upwards trend is in the early stages and On Balance Volume is very bullish.
RSI is overbought but does not yet exhibit divergence with price. Nor does Stochastics.
The only cause for some concern for the very short term is price sitting for five days now on the upper edge of Bollinger Bands. A pullback, even a short term one, may be expected here or now very soon to relieve overbought, extreme conditions.
Use pullbacks as an opportunity to join the upwards trend.
The target using the second measuring gap would be about 2,348. That has now been met and slightly passed. This trend for the short term now looks extreme.
VOLATILITY – INVERTED VIX CHART
Click chart to enlarge. Chart courtesy of StockCharts.com.
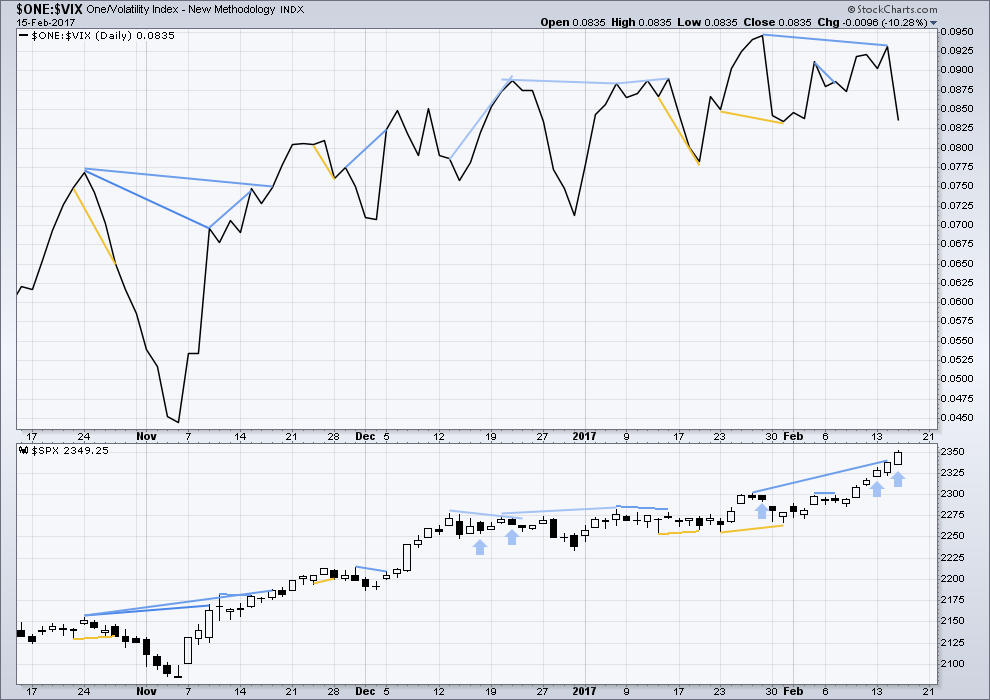
There are a few instances of multi day divergence between price and inverted VIX noted here. Bearish divergence is blue. Bullish divergence is yellow. It appears so far that divergence between inverted VIX and price is mostly working to indicate short term movements spanning one or two days. While this seems to be working more often than not, it is not always working. As with everything in technical analysis, there is nothing that is certain. This is an exercise in probability.
Today saw the strongest divergence yet between price and VIX. Price moved strongly higher with support from volume. Normally, volatility should decline on rising price as it almost always does. However, inverted VIX moved strongly lower. Volatility sharply increased as price moved higher. The increase in volatility is quite reasonable, so this is not a small divergence.
This divergence indicates something wrong today with the upwards movement from price, and it is interpreted as very bearish. It may fail, but the strength of the divergence today points to a high probability of price moving lower tomorrow.
Bearish mid term divergence is still in place.
BREADTH – AD LINE
Click chart to enlarge. Chart courtesy of StockCharts.com.
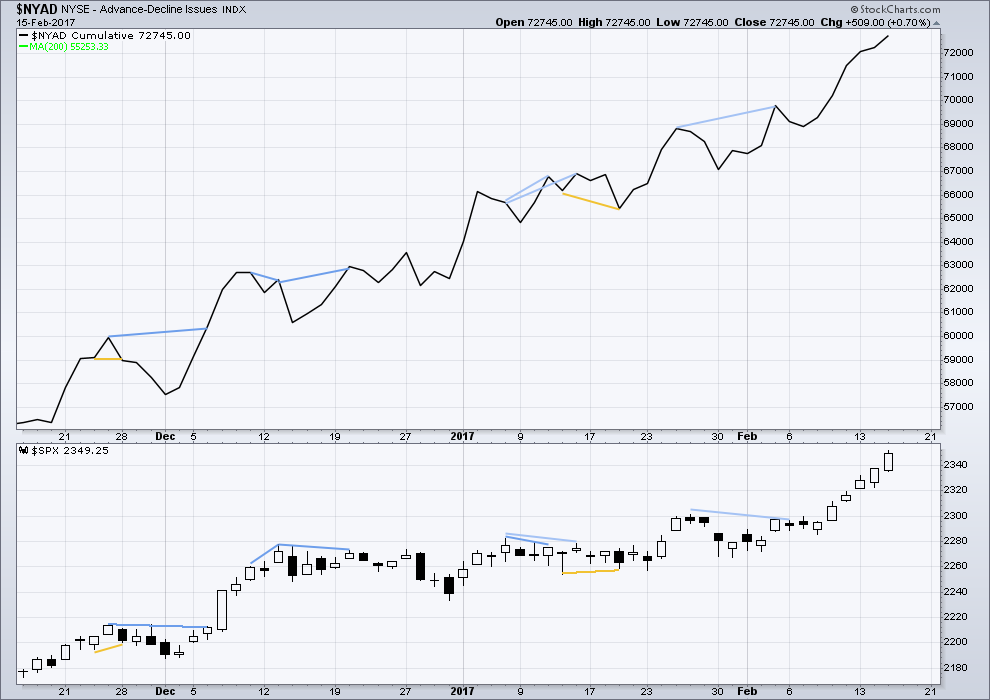
There is no short nor mid term divergence today between price and the AD line. The rise in price to a new high today was accompanied by a corresponding new high in the AD line. The rise in price has support from a rise in market breadth. Lowry’s OCO AD line also shows new highs along with price. Normally, before the end of a bull market the OCO AD line and the regular AD line should show divergence with price for about 4-6 months. With no divergence, this market has support from breadth.
DOW THEORY
The DJIA, DJT, S&P500 and Nasdaq have made new all time highs in December of 2016. This confirms a bull market continues.
This analysis is published @ 9:25 p.m. EST.
I fully expected to have my head handed to me on a platter yet again after shorting SVXY via 135.00 puts yeterday. Reversion to the mean has simply not been happening lately. I was particularly nervous since although it made a slightly higher high, which I expected, it failed to sport the long upper wick, which I also expected. You can imagine how startled I was when it went on to produce a big fat red candle while the indices were all making new all time highs, something I have never seen ever! You saw what it did this morning- A 10X trade in 24 hours. Very strange indeed. Unprecedented…
Nice Verne
Updated hourly chart:
No change from yesterdays expectations really. Too early to start to label the subdivisions within minor wave 4.
Long term members will now understand the next scenario, and I bet that some of you could write my next words for me.
This is a fourth wave. The second wave was a zigzag so the fourth wave may be any one of a flat, combination or triangle. Within an expanded flat and running triangle wave B may move beyond the start of wave A, so within minor 4 we could see a new high above 2,351.30 as part of the correction. For this reason there can be no upper invalidation point.
As minor wave 4 unfolds over the next few days the labelling within it will change. At the beginning, now, it is impossible for me to tell you which of many possible structures it will be. My focus will be on trying to see when it could be complete.
This is a correction within a trend. A small consolidation. This is not a trading opportunity, at its end it offers an opportunity to join an existing upwards trend. Trying to trade the small waves within a consolidation has a very high risk of loss, avoid trading consolidating markets.
Lara, good advice on staying out. I briefly felt a tug to try and play the 4 but you smacked that idea out of my head before I pulled the trigger. I’ll wait for the 5 with the smart money!
Thanks, Ron
p.s. It is possibly shaping up to be a delicious-looking Dark Cloud Cover candle, but in the context of your EW chart, the idea of a sizable reversal is a bit premature – I may be starting to catch on! I’ll wait for the 5 with the smart money!
Where did my Dark Cloud Cover go? I was a little premature.
LOL I don’t think I would be so violent as to smack anything, but that’s great you’re avoiding trading a small consolidation.
When price consolidates it will whipsaw from support and resistance, and back again, and it won’t move in straight lines from one to the other. It is usually choppy and overlapping. It won’t provide a good trading opportunity.
Smart traders will trade trends only, not consolidations. It’s one of the hardest things to learn, patience and staying out of a market when it’s not clearly trending.
If volatility continues to ramp on this fourth wave correction, it will probably spike (above BB) to signal the end of minor four, and especially if it takes the form of an abc flat or zig zag. If it keeps diverging with higher highs and higher lows during the fifth wave up, that would be Yuge! 🙂
VIX today has an an upwards day with a candlestick spiking above BBs with a long upper wick. Very bearish for VIX should be bullish for the S&P.
However, looking at recent behaviour VIX can still sit at upper edge of BBs for a few days.
I was quite surprised to see that penetration so early in the onset of the correction. There was also a long lower wick on SVXY today. While it could indeed signal bullishness for SPX, it could also signal bullishness on the part of the traders, and not necessarily the index! As a matter of fact, this kind price action at the onset of a trend change sometimes signal a fast and far move in volatility to dispel the extreme bullishness of the crowd. That is not what I would normally expect from just a minor four correction but these are certainly not normal times, are they? 🙂
Thankyou Lara
You’re welcome.
I’m happy this morning to see a red daily candlestick. Now my job over the next few days will be to figure out when / where minor 4 ends so that we can all jump in long to ride the next wave up
FWIW Northy: the bear market we are expecting https://northmantrader.com/2017/02/15/the-coming-bear-market/
An interesting read, thanks David.
Which makes me think about the new buzz words about; “alternative facts” and “post truth”. Yeah, right. That looks pretty accurate for a massive multi generational market top. Over exuberance, unsubstantiated by fundamentals.