
Upwards movement continues as expected.
A very bearish alternate (which was judged to have a very low probability) has been invalidated today. This adds confidence to the main Elliott wave count and the targets.
Summary: The short term target at 2,338 has almost been met. Very short term trades may now take profit. Traders with a longer horizon may like to hold on until the mid term target at 2,382 is met. Price should find strong support about 2,300 now. The invalidation point is today moved up to 2,300.99.
The next pullback for minor wave 4 may be relatively shallow and must remain above 2,300.99. It is possible it may begin tomorrow. If it does, then it may last about three or five days.
New updates to this analysis are in bold.
Last monthly and weekly charts are here. Last historic analysis video is here.
MAIN ELLIOTT WAVE COUNT
WEEKLY CHART
Click chart to enlarge.
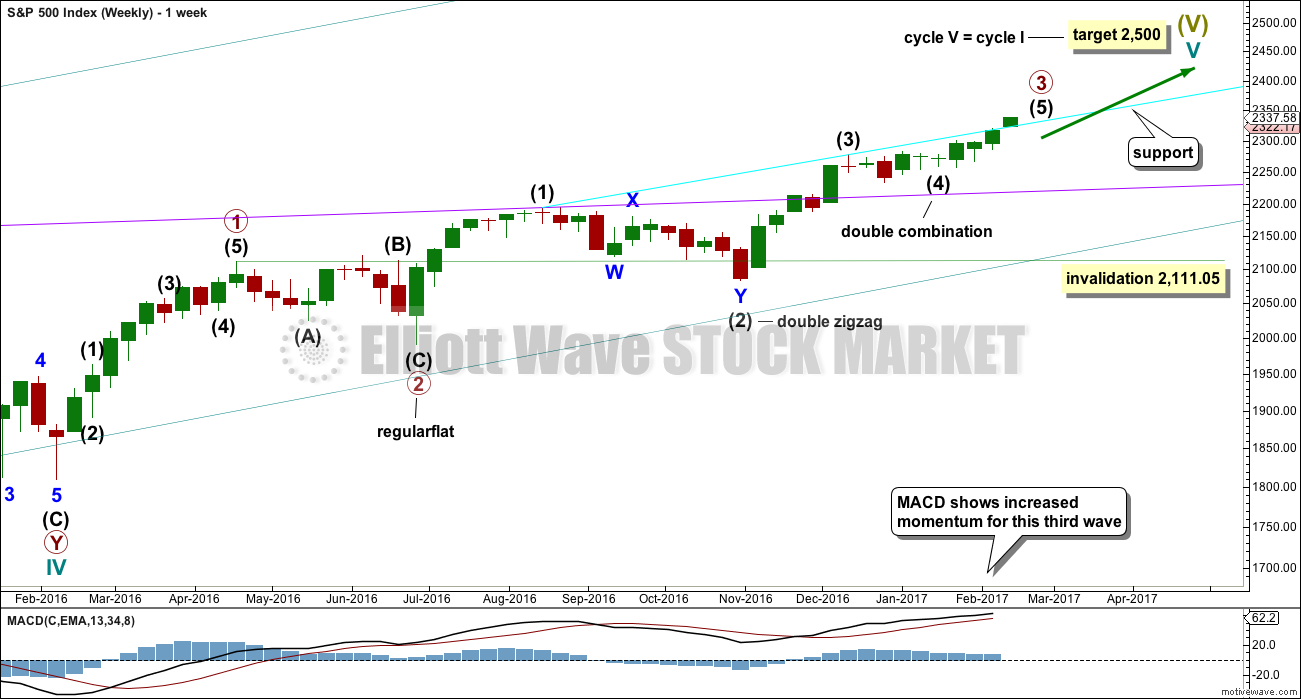
Cycle wave V is an incomplete structure. Within cycle wave V, primary wave 3 may be relatively close to completion.
When primary wave 3 is complete, then the following correction for primary wave 4 may not move into primary wave 1 price territory below 2,111.05.
Primary wave 2 was a flat correction lasting 47 days (not a Fibonacci number). Primary wave 4 may be expected to most likely be a zigzag, but it may also be a triangle if its structure exhibits alternation. If it is a zigzag, it may be more brief than primary wave 2, so a Fibonacci 21 sessions may be the initial expectation. If it is a triangle, then it may be a Fibonacci 34 or 55 sessions.
Primary wave 3 at this stage though is incomplete and may continue to move price higher.
DAILY CHART
Click chart to enlarge.
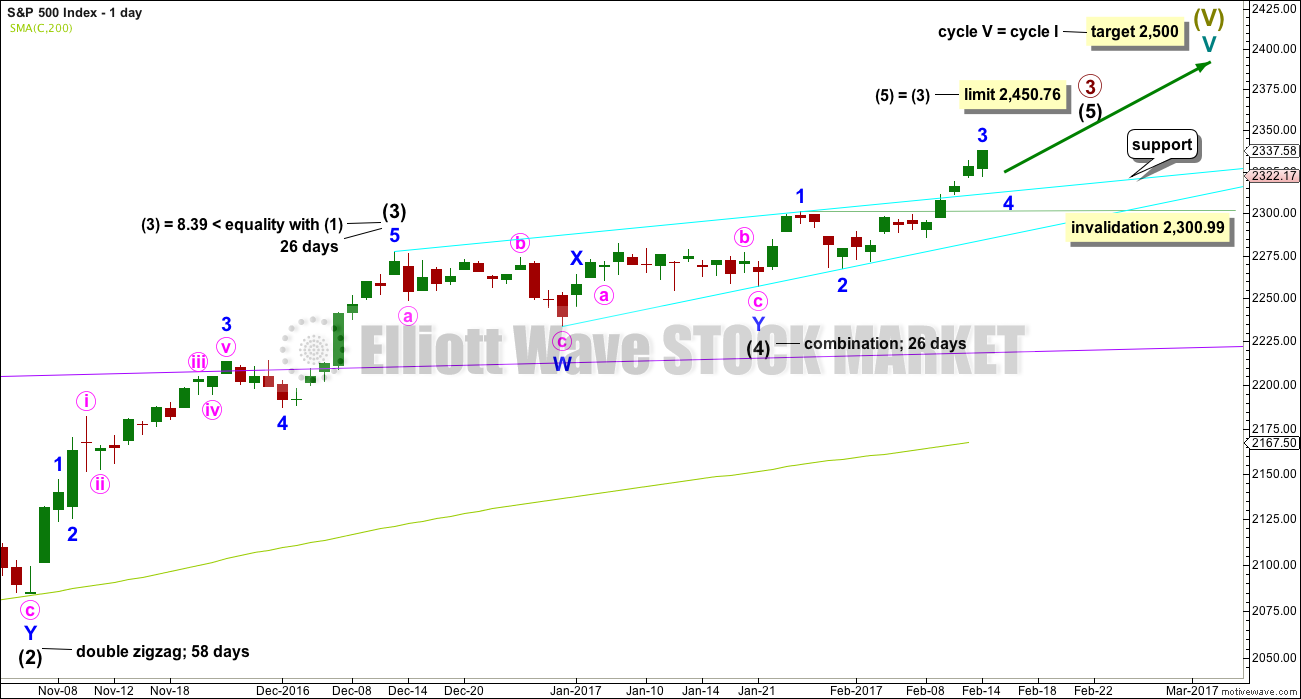
Intermediate wave (4) is a complete combination: zigzag – X – flat. It would have been even in duration with intermediate wave (3), both lasting 26 days.
Intermediate wave (3) is shorter than intermediate wave (1). One of the core Elliott wave rules states a third wave may never be the shortest wave, so this limits intermediate wave (5) to no longer than equality in length with intermediate wave (3) at 2,450.76.
Minor wave 3 has moved beyond the end of minor wave 1, meeting the rule. Minor wave 3 moved higher today to almost meet the target for it, which was at 2,338. Minor wave 3 now is just 0.77 points short of 1.618 the length of minor wave 1.
Minor wave 2 was a deep 0.77 zigzag lasting three days. Minor wave 4 may exhibit alternation as a flat, triangle or combination and may last about a Fibonacci three or five days. It may not move into minor wave 1 price territory below 2,300.99.
Minor wave 4 may find support now at the upper cyan trend line. This may assist to force it to be very shallow.
Intermediate wave (5) has so far lasted sixteen days. It may be expected to be shorter both in length and duration compared to intermediate wave (3). At this stage, an expectation of a Fibonacci 21 days total for intermediate wave (5) looks reasonable, so it may now continue for another five days or sessions. This is starting to look a bit too brief now though. It may continue to total a Fibonacci 34 sessions.
Price has now broken above the cyan line. This line may now offer support.
The proportion here between intermediate waves (2) and (4) is acceptable. There is alternation. Both are labelled W-X-Y, but double zigzags are quite different structures to double combinations.
FIRST HOURLY CHART
Click chart to enlarge.
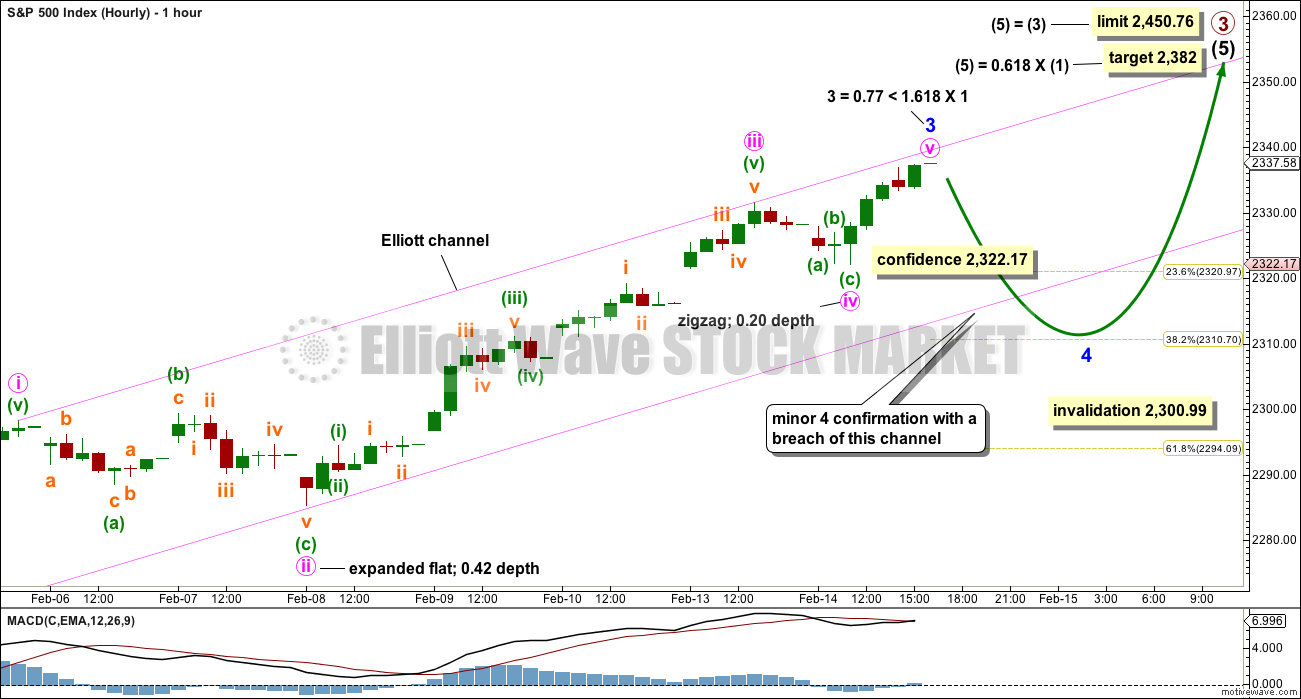
Intermediate wave (5) must subdivide as a five wave structure, either an impulse or an ending diagonal. It is not possible to eliminate either option at this stage, but it does look very much like an impulse.
Within intermediate wave (5), minor waves 1 and 2 may be complete.
I will have two hourly wave counts for you today.
This first hourly wave count looks at the possibility that minor wave 3 is over, close to 1.618 the length of minor wave 1. Minor wave 3 looks like a complete five wave impulse.
This wave count has a better look at the hourly chart level than the second chart below. I would judge this first hourly wave count to have about a 60% probability.
Minor wave 2 was a relatively quick and deep zigzag. Given the guideline of alternation, minor wave 4 should be expected to most likely be a more time consuming and shallow flat, triangle or combination and may total a Fibonacci three or five days if it exhibits a Fibonacci duration.
A new low below 2,322.17 would invalidate the second hourly chart below and provide some confidence in this first chart. A clear breach of the lower edge of the pink channel would confirm an end to minor wave 3. At that stage, minor wave 4 may be underway.
If minor wave 4 is shallow and ends close to the 0.382 Fibonacci ratio about 2,311, then it would remain well above minor wave 1 price territory at 2,300.99.
SECOND HOURLY CHART
Click chart to enlarge.
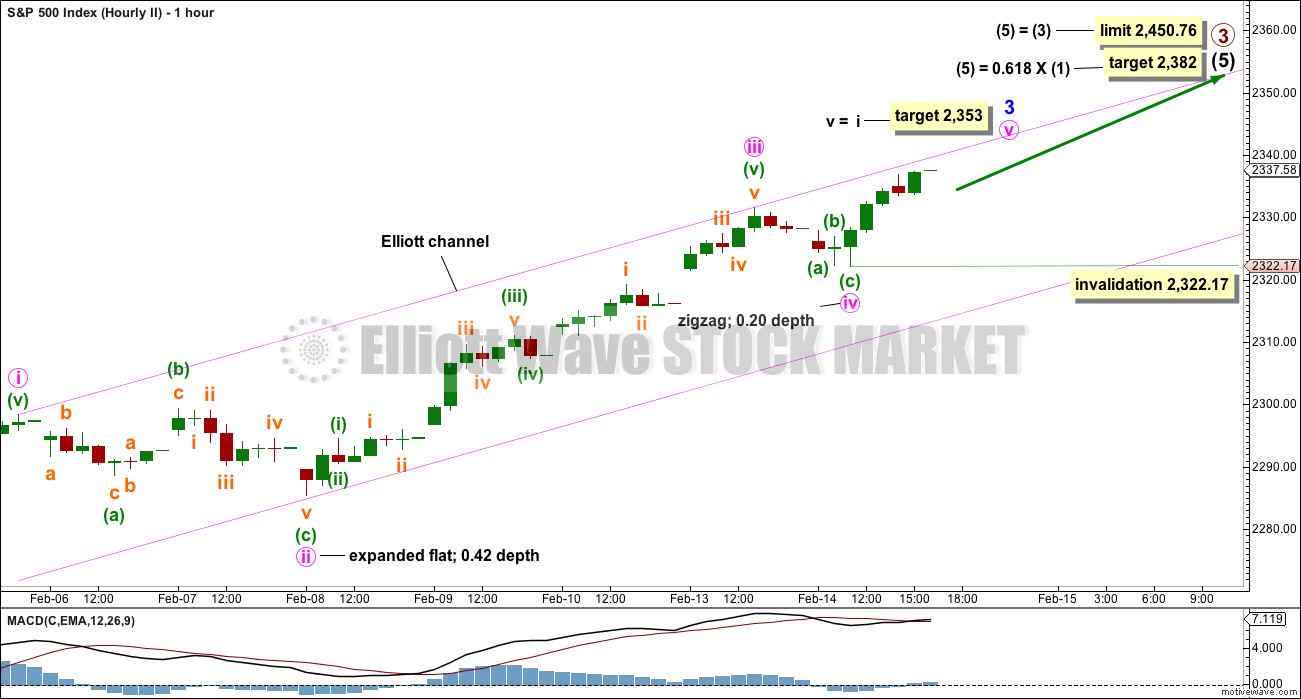
This second hourly chart looks at the possibility that minor wave 3 is not over and may extend. The target assumes a Fibonacci ratio for minute waves v and i, but this target would see minor wave 3 exhibit no Fibonacci ratio to minor wave 1.
Within minor wave 3, there is already a Fibonacci ratio of equality between minute waves i and iii. The S&P often exhibits a Fibonacci ratio between two of its three actionary waves within an impulse and rarely does it exhibit Fibonacci ratios between all three. The target does not have a good probability; it is a rough guide only.
If minute wave v continues, then within it no second wave correction may move beyond its start at 2,322.17.
TECHNICAL ANALYSIS
WEEKLY CHART
Click chart to enlarge. Chart courtesy of StockCharts.com.
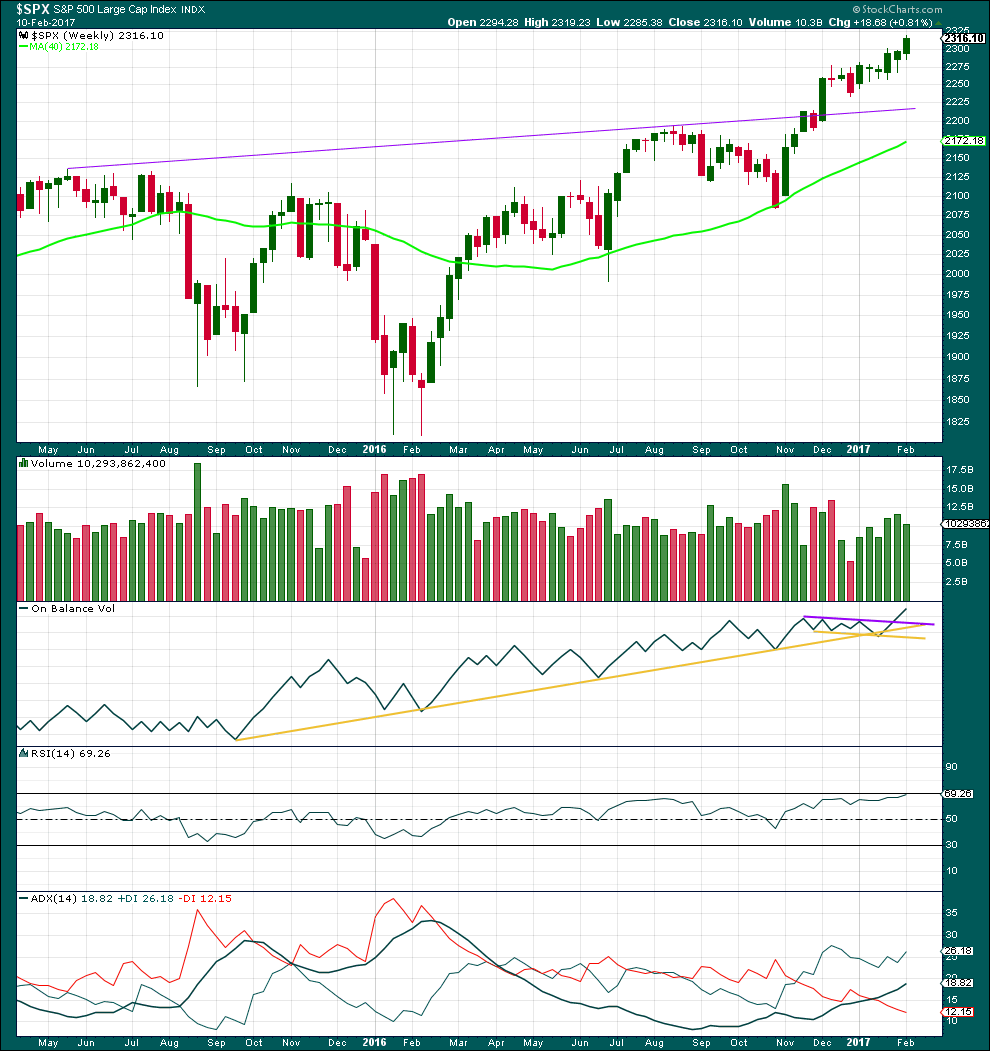
Overall, price is moving higher on increasing volume. Last week sees a decline in volume from prior week, but volume is still stronger than the first three weeks of upwards movement.
On Balance Volume gave a bullish signal with a break above the purple resistance line. This line may now offer support and assist to halt any fall in price from being too deep.
RSI is not yet overbought at the weekly chart level. There is room for price to rise further.
ADX indicates an upwards trend, and ADX has a long way to go before it becomes extreme.
DAILY CHART
Click chart to enlarge. Chart courtesy of StockCharts.com.
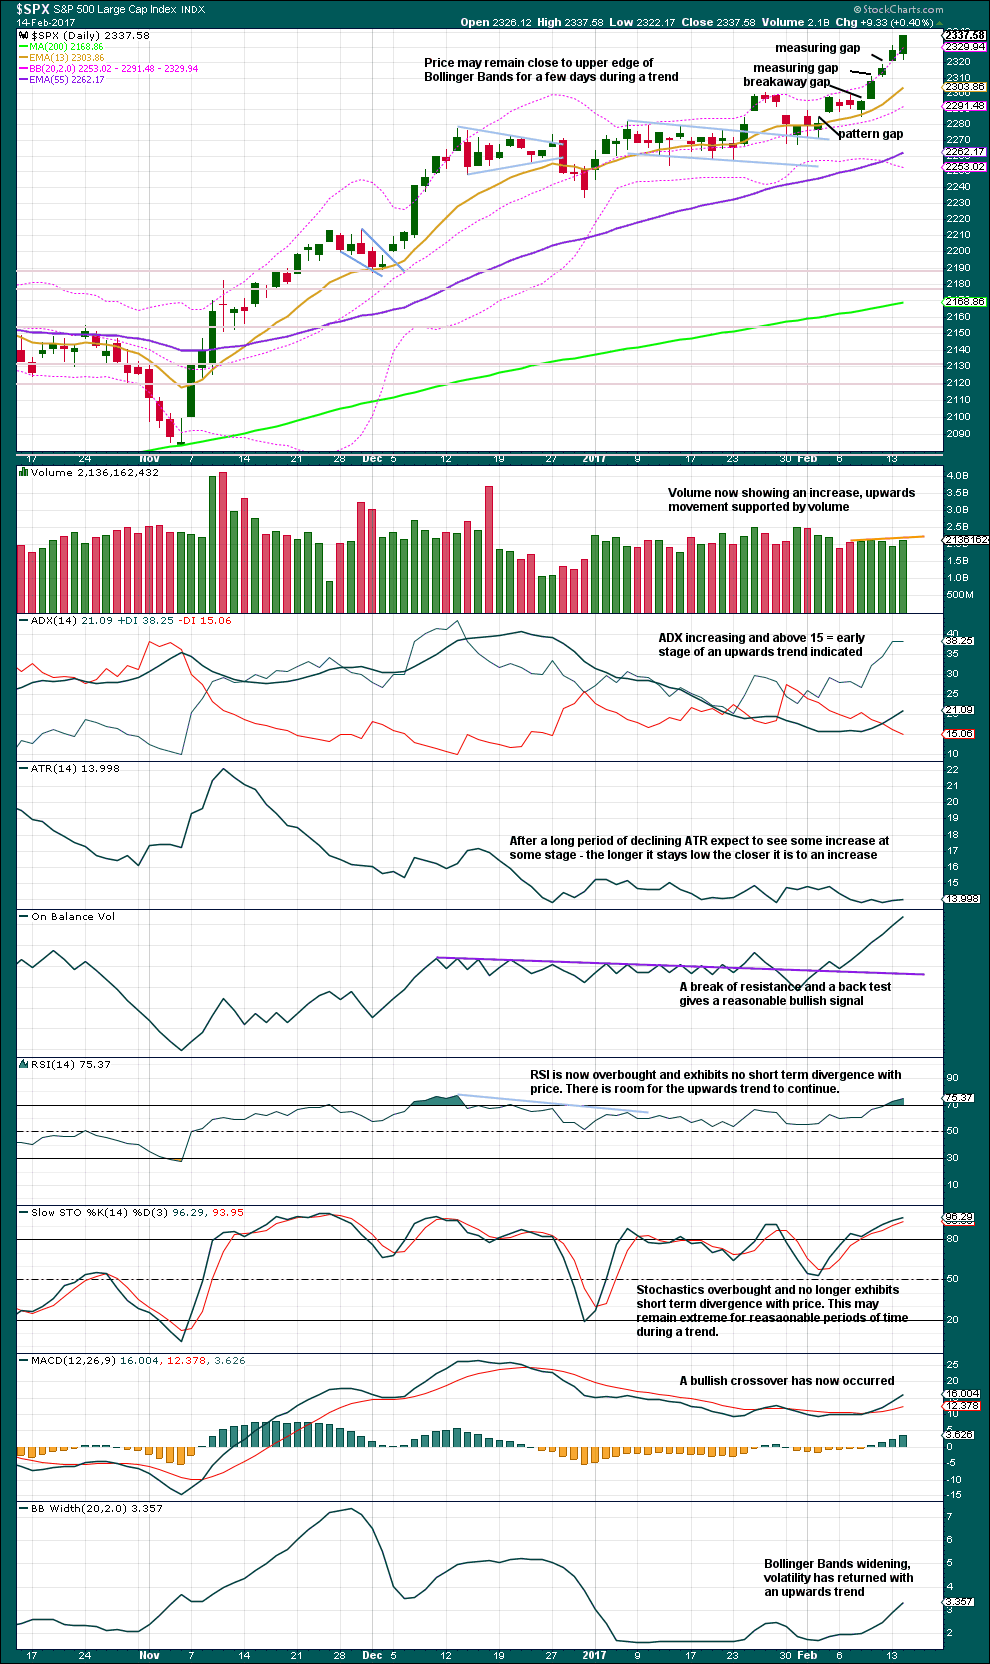
An increase in volume today supports upwards movement. Price has now sat at the upper edge of Bollinger Bands for four days. A pullback will happen, and is getting closer. But price could continue to sit at the upper edge of Bollinger Bands for another one to very few days yet.
The last two gaps are now labelled as measuring gaps. These often turn up about the mid way point in a trend. A target using the first gap would be about 2,331, but this has been met and passed. A target using the second gap would be about 2,348. This may now be used.
ADX still indicates a young upwards trend. There is as yet no divergence between price and Stochastics or RSI while these are extreme. Expect the trend to continue until indicated otherwise.
Corrections within the trend offer an opportunity to join the trend. Do not trade against the trend. The trend is your friend.
VOLATILITY – INVERTED VIX CHART
Click chart to enlarge. Chart courtesy of StockCharts.com.
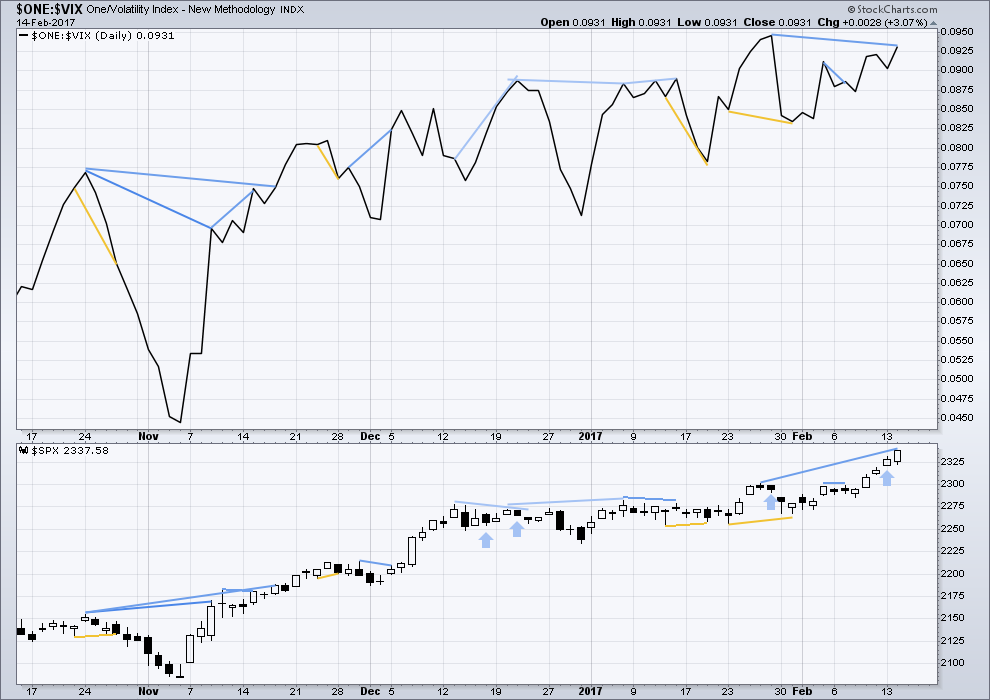
There are a few instances of multi day divergence between price and inverted VIX noted here. Bearish divergence is blue. Bullish divergence is yellow. It appears so far that divergence between inverted VIX and price is mostly working to indicate short term movements spanning one or two days. While this seems to be working more often than not, it is not always working. As with everything in technical analysis, there is nothing that is certain. This is an exercise in probability.
Single bearish divergence between price and inverted VIX has failed. There is still mid term divergence between price and inverted VIX, but this has proven to be reasonably unreliable recently. Shorter term divergence appears to be more reliable. This mid term divergence supports the first hourly chart over the second.
BREADTH – AD LINE
Click chart to enlarge. Chart courtesy of StockCharts.com.
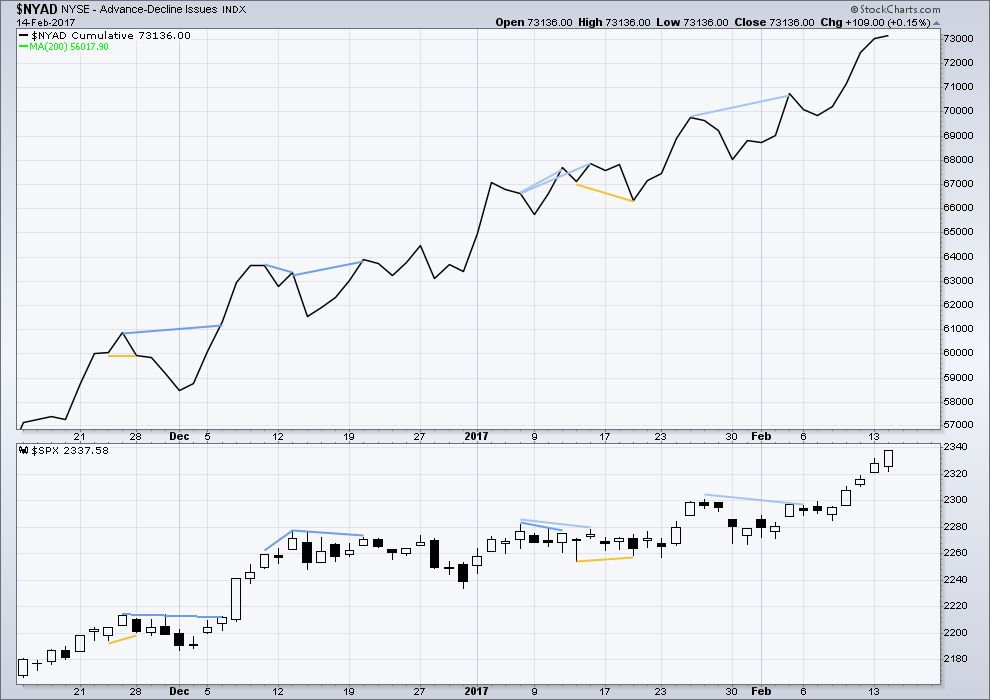
There is no short nor mid term divergence today between price and the AD line. The rise in price to a new high today was accompanied by a corresponding new high in the AD line. The rise in price has support from a rise in market breadth. Lowry’s OCO AD line also shows new highs along with price. Normally, before the end of a bull market the OCO AD line and the regular AD line should show divergence with price for about 4-6 months. With no divergence, this market has support from breadth.
DOW THEORY
The DJIA, DJT, S&P500 and Nasdaq have made new all time highs in December of 2016. This confirms a bull market continues.
This analysis is published @ 7:14 p.m. EST.
We’re living in bizarro world now folks. Alternative facts / post truth / this makes zero sense.
VIX moved up strongly. Volatility increased today. While price moved up strongly.
Now, we’ve seen this happen just a few times (blue arrows on inverted VIX chart) but today was a very strong upwards day from VIX, not just a little. A lot. And price moved up strongly too, with support from volume.
I’m not going to enter long here again, I will be looking for a pullback here or soon. Now, I could be wrong, but this very strange divergence on a reasonable scale looks pretty bearish.
Agree Lara,
I scaled my longs today. Thanks for your great analysis. Plan to add vix if we have a positive day tomorrow on it as a hedge.
So strange isn’t it!
I’m looking for a pullback to begin tomorrow, lasting a few days for minor 4. I want to enter long again when it looks like it should be complete.
That cyan trend line should be good support, and 2,300 also. So if minor 4 gets close to that it would offer a golden opportunity… again!
It’s the second hourly chart. Price just keeps going up.
Targets remain the same.
Lara
So you think that even if fiscal plans comming out of the trump administration which may be beneficial too business will only just delay the change in trend. so too be clear you think that 2500 is or close too the top.
Thankyou again
and lastly just going back too this social mood you alluded too previously, if commentators keep talking about a 5 % correction the we will have a pullback ?
If social mood is ready to move into a massive bear market then there is nothing any administration can do to stop it.
Actually, changes in the guard normally happen in a bear market. This one happened in a bull market… an old bull market. Maybe this change is an indication of a top closer than we think? Just a random thought there.
I can’t make any comment on what Trump expects to do or not do, because TBH I cannot stomach reading or watching any politicians speeches so I’ve not watched any of his.
Lastly if commentators keep talking about a 5% pullback, then all that says is commentators are talking. Which means zero.
Look at the technicals. Maybe add the CNN Fear and Greed Index.
I appreciate Lara’s analysis immensely.
IMHO… the market is affected by the Fed, not by presidents. For example, the SPX up over 23% the last 12 months, a period during which people expected Clinton to win and then continued when Trump won. The S&P went up 13% from February 2016 thru October 2016 (a period of Clinton ascendancy) and then went up an additional 10% after Trump won. But during that time, the consistent factor was Janet Yellen and monetary policy.
Obama didn’t create the bull market since 2009. He was blessed (or cursed) with a low point and the Fed gave away free money. And companies thrived.
Now, market sentiment is that Trump policies will lead to greater profits and greater stock prices. Trump policies include lowering corporate tax rates, changing tax policy in order to bring corporate money home from offshore, deregulation of everything, and spending on infrastructure. But presidents never get all of their policies enacted. Never.
So how will sentiment change when only half of those things get passed?
And China is a disaster that’s about to be revealed. Along with instability posed by Le Pen in France, Netherlands doing a N-Exit, and Merkel’s problems with regional elections in Germany.
Oh, I almost forgot the impeachable offense of lying about undercutting the Obama sanctions on Russia … and the revelations about Trump campaign colluding with Russia.
There are so many thunderheads on the horizon. I’m looking forward to reaching the target of 2500 so I can go back indoors.
At this point, I”m doing short term iron butterflys and iron condors on the SPX. And will probably buy an in the money, long term put as well.
Lara
Not being such a savvy trader as most commenters here, I am looking for a general feel as to what other members plans are for once we hit 2,500 and go over the top into the Grand Super Cycle slide. Being a very conservative trader, my impulse is to look for some opportunities as they are presented, but I am concerned about what the value of currency will be during this next, deep downward market. Is gold the way to go, or?
Perhaps this isn’t the forum for this. Looking for some input if anyone would like to share.
Thanks
Allan, I intend to swing trade SPXU for the long ride down when the big trend changes to bear. I’ll also trade SPY put options for intraday or 2-3 day swings at the smaller degrees during the downward trend. I’ve been totally focused on just the S&P 500 until I gain some consistency.
The secret is out: I’m in a race to figure out what I’m doing before my wife figures out that I don’t know what I’m doing. 😉
LOL
Never a good idea to try and fool the wife… just sayin’ 🙂
This is definitely the forum for it.
Cash will be king in a deflationary environment.
But we are not there yet, and still likely at least 4-6 months off. First, this bull market has time to run and needs to complete its structure. Look out for over enthusiastic optimism which is not supported by fundamentals. Crazy divergences and the market at it’s eventual highs not making any sense.
The technicals once we get up there should look similar to 1987, 2000 or 2007. Or maybe even 1929. Oh how I wish I could get data for that year with all the technical indicators, including volume, to see exactly what that looked like.
Ronald, Lara
Thanks for the responses. I appreciate the feedback. Yes, caution reigns my bank account, and as I said I am conservative. I guess gold is no longer the hedging commodity of the past as there isn’t enough of it to even manage the Fort Knox commitments to foreign countries, let alone think the stash could hedge a run on the US Dollar. Not everyone realizes this, so I kind of expecting a run on gold anyway.
Otherwise, have you any advice on inverse ETFs?
Many thanks
Thanks
Thanks Lara. Great analysis especially adding the hourly alternate.
Even though many indicators are reaching some extremes, this market seems to have significant strength. Volume not only increased from yesterday, but overall the volume has been consistent, not drying up on upward days. The OBV is very strong.
I never mentioned this but I was a very early follower of Joseph Granville, the Father of OBV. I met him at a brokerage house in Milwaukee, Wisconsin, for an intimate presentation. That was back when you could walk into a local brokerage house. In any event, I learned his theory over many years. He would be very bullish with a breakout to ATHs accompanied by a very strongly rising OBV. It was so long ago I remember when he predicted some day the DJIA would move 50 points in one day! At the time, everyone thought he was crazy. God rest his soul.
Have a great evening and thanks again.
PS – You should be proud of your skateboard facility and event. Way to go!
Thanks Rodney. Yes, the current situation looks very bullish, doesn’t it! OBV is very strong, volume supports the move up and ADX at both daily and weekly time frames indicates the trend is young.
The only caution here is divergence with inverted VIX (but that’s not particularly reliable) and price at the extreme edge of Bollinger Bands (and it could remain there for a few days yet).
My long is closed automatically, profit target hit 🙂
A very nice trade for you! I need to learn from your patience to see a trade through to its end. I take cash much too quickly.
Ronald,
That is a good problem to have. No one ever went broke by taking profits. Lara rode this last move up beautifully with her trade. Great example.
I am willing to hang on through the Minor 4 correction until we reach the next target higher which is at 2382 right now. If this Minor 3 extends, that Minor 5 target might get pushed higher.
Note though, it has a limit.
Thanks Rodney. Since I got out too fast, I hope to jump back in when Minor 4 starts showing itself, and maybe catch the meat of Minor 5.
Ronald, I agree with Rodney. No one ever went broke from taking a profit.
I would rather have held on for the intermediate (5) target actually, and I may yet jump back in long. This market has good strength.
Thanks Lara.
What I failed to mention was that by losing my nerve and getting out early, my wins often aren’t much bigger than my losers. Need to get disciplined and strive for that 3:1 risk/reward.
Love your work and especially grateful for your intraday hourly chart updates! Must be early in NZ when you update that chart.
I often get up at 6am so that I can check the markets, see my teenager off to school and get out for a quick surf before StockCharts data is finalised 🙂 Then I sit down to work with my zen on 🙂 🙂 🙂