
Price moved lower today with a lower low and lower high, but the session closed strongly printing a green daily candlestick.
The balance of volume was upwards. On Balance Volume gives a reasonable signal, but there has not yet been a breakout from a consolidation.
Summary: It is increasingly likely that the next wave up has begun. This would be confirmed with a new all time high. The target is 2,338 for the short term and 2,382 for a longer term trade. If price breaks below 2,257.02, then a deeper pullback would be expected to be underway to end at the purple trend line.
New updates to this analysis are in bold.
Last monthly and weekly charts are here. Last historic analysis video is here.
MAIN ELLIOTT WAVE COUNT
WEEKLY CHART
Click chart to enlarge.
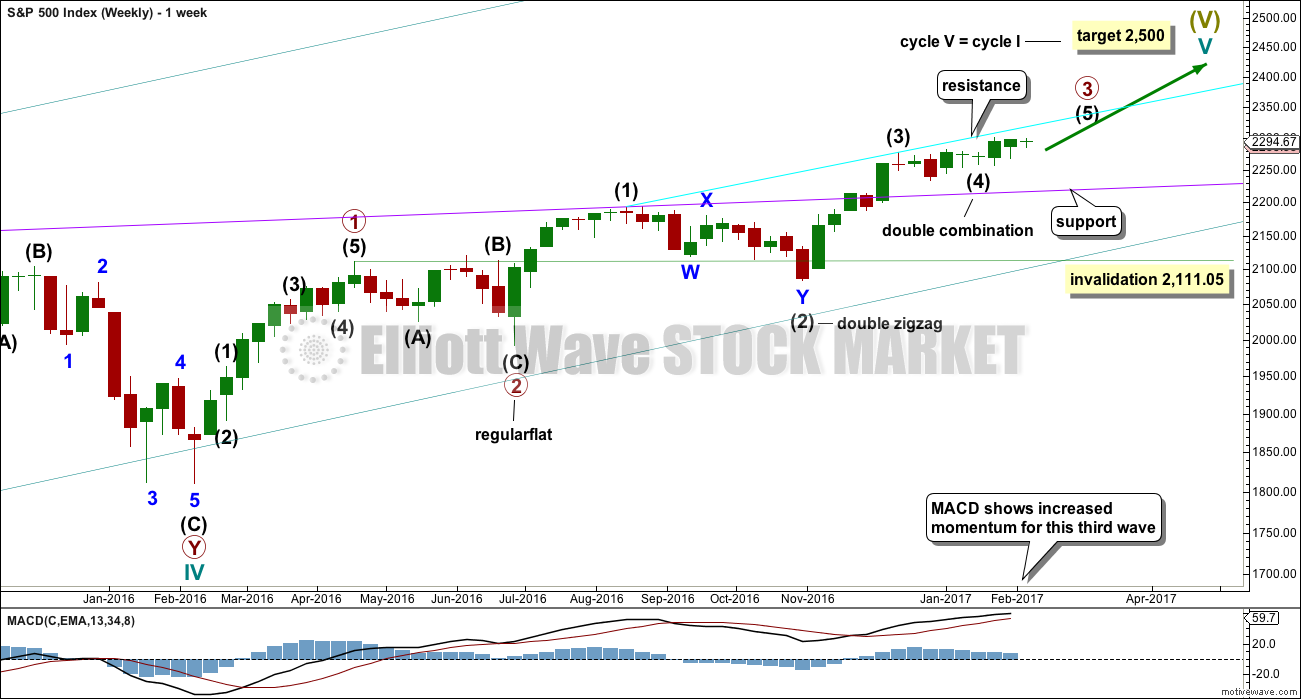
Cycle wave V is an incomplete structure. Within cycle wave V, primary wave 3 may be relatively close to completion.
When primary wave 3 is complete, then the following correction for primary wave 4 may not move into primary wave 1 price territory below 2,111.05.
Primary wave 2 was a flat correction lasting 47 days (not a Fibonacci number). Primary wave 4 may be expected to most likely be a zigzag, but it may also be a triangle if its structure exhibits alternation. If it is a zigzag, it may be more brief than primary wave 2, so a Fibonacci 21 sessions may be the initial expectation. If it is a triangle, then it may be a Fibonacci 34 or 55 sessions.
Primary wave 3 at this stage though is incomplete and may continue to move price higher.
DAILY CHART
Click chart to enlarge.
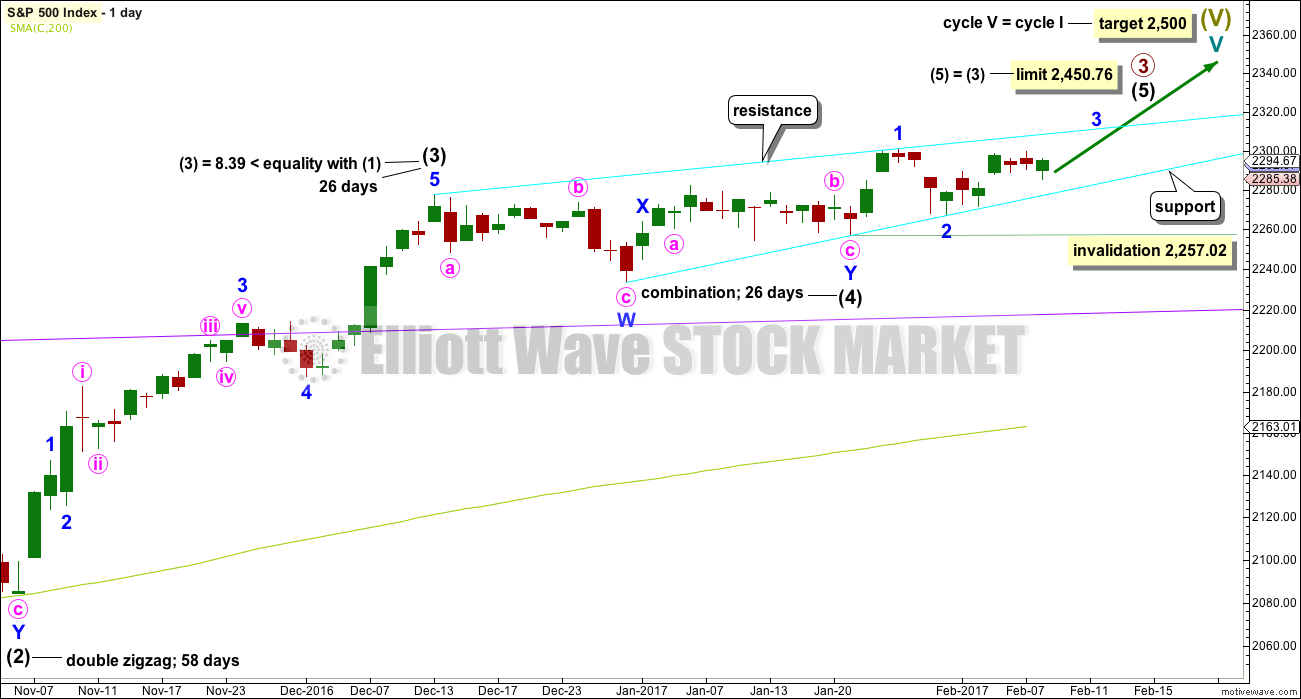
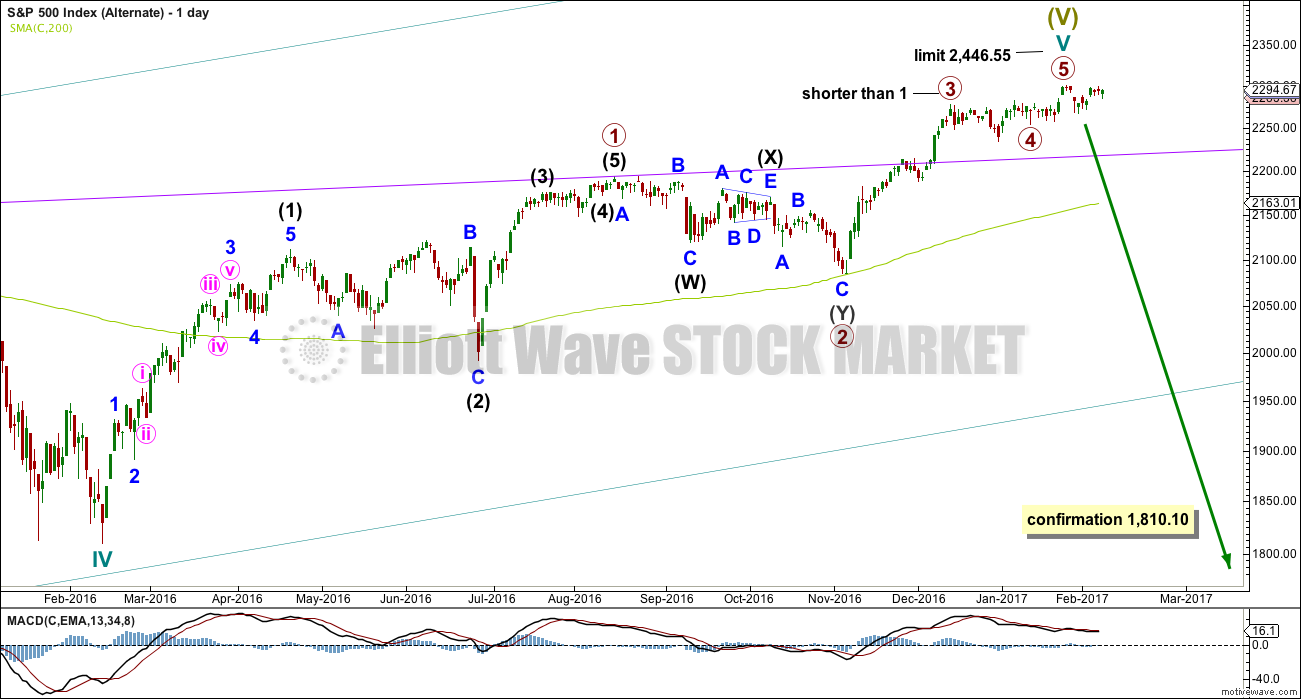
It is possible that intermediate wave (4) is a complete combination: zigzag – X – flat. It would have been even in duration with intermediate wave (3), both lasting 26 days.
Intermediate wave (3) is shorter than intermediate wave (1). One of the core Elliott wave rules states a third wave may never be the shortest wave, so this limits intermediate wave (5) to no longer than equality in length with intermediate wave (3) at 2,450.76.
Within intermediate wave (5), no second wave correction may move beyond its start below 2,257.02. Leaving the invalidation point here allows for the possibility that minor wave 2 may be continuing further as a regular flat correction.
Intermediate wave (5) has so far lasted just twelve days. It may be expected to be shorter both in length and duration compared to intermediate wave (3). At this stage, an expectation of a Fibonacci 21 days total for intermediate wave (5) looks reasonable, so it may now continue for another nine days or sessions.
The proportion here between intermediate waves (2) and (4) is acceptable. There is alternation. Both are labelled W-X-Y, but double zigzags are quite different structures to double combinations.
HOURLY CHART
Click chart to enlarge.
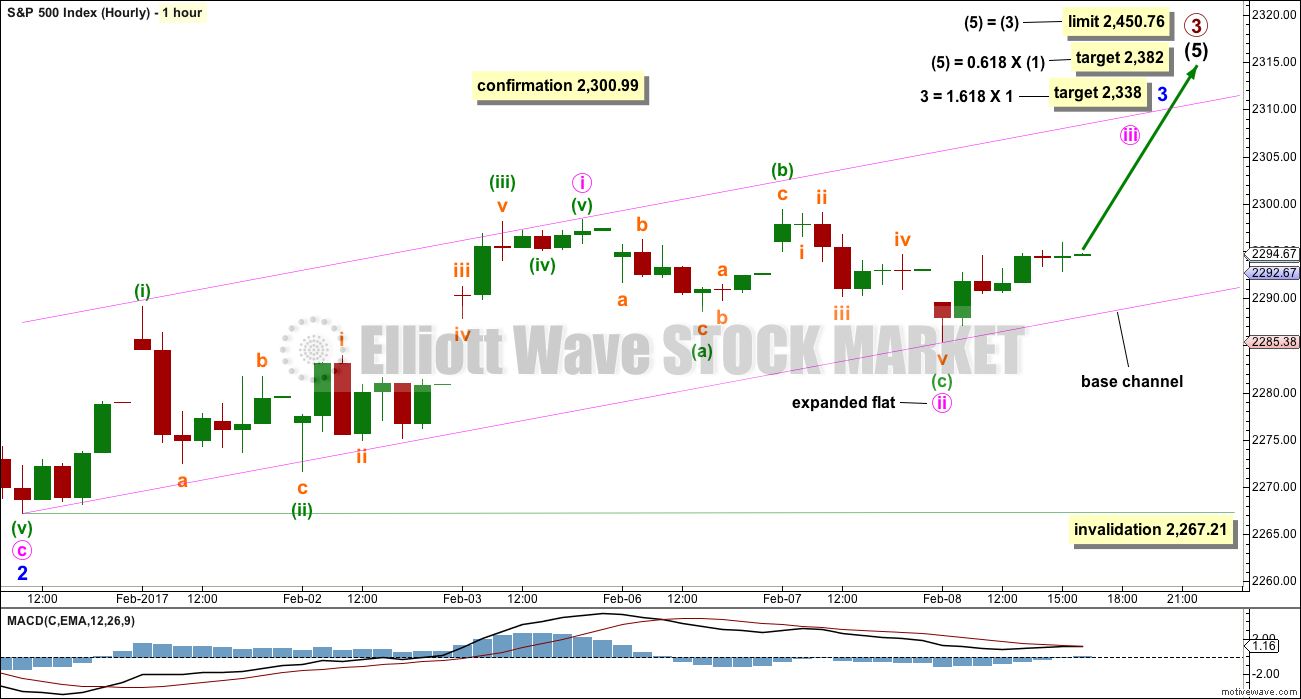
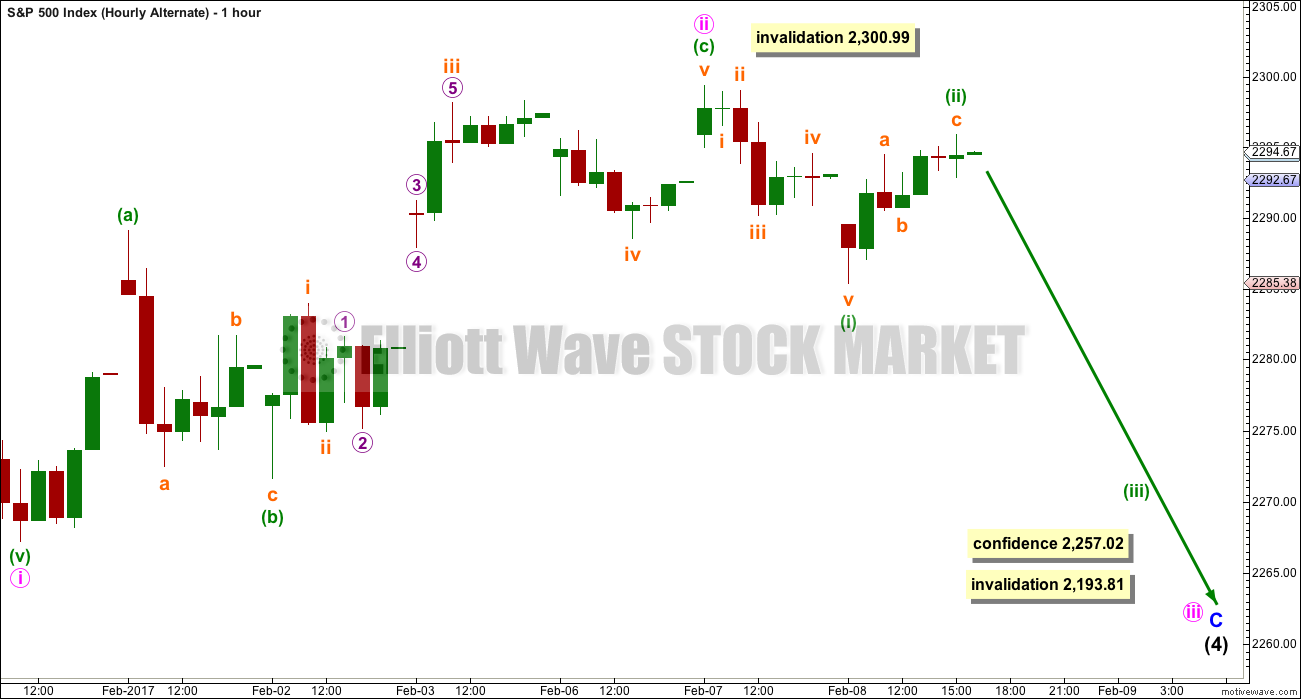
Intermediate wave (5) must subdivide as a five wave structure, either an impulse or an ending diagonal. At this stage, it is not possible to eliminate either option.
Within intermediate wave (5), minor waves 1 and 2 may be complete.
Within minor wave 3, minute wave i and now minute wave ii may be complete as an expanded flat correction. If it continues further sideways as a double flat, then minute wave ii may not move beyond the start of minute wave i below 2,267.21.
A new high above 2,300.99 would confirm this wave count and invalidate any alternate. At that stage, reasonable confidence in targets may be had.
The target for minor wave 3 assumes the most likely Fibonacci ratio for it to minor wave 1.
If price moves below 2,257.02, this main wave count would be invalidated and the alternate below would be confirmed.
ALTERNATE ELLIOTT WAVE COUNT
DAILY CHART
Click chart to enlarge.
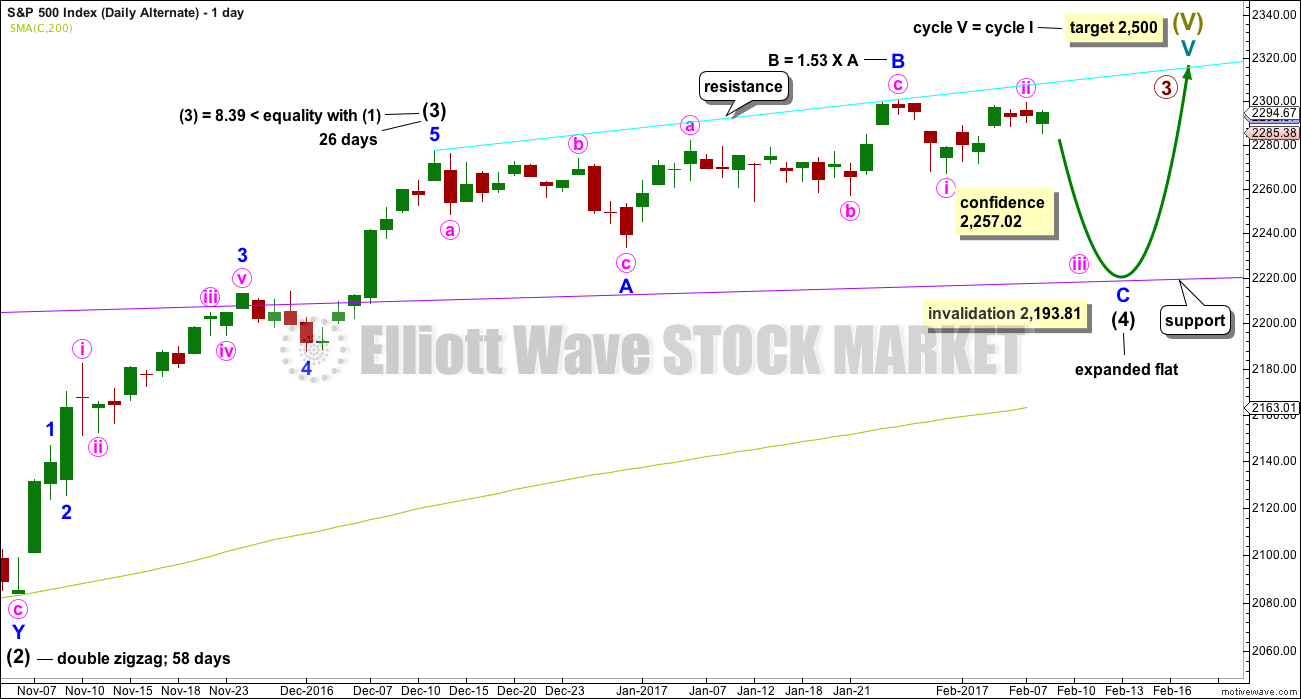
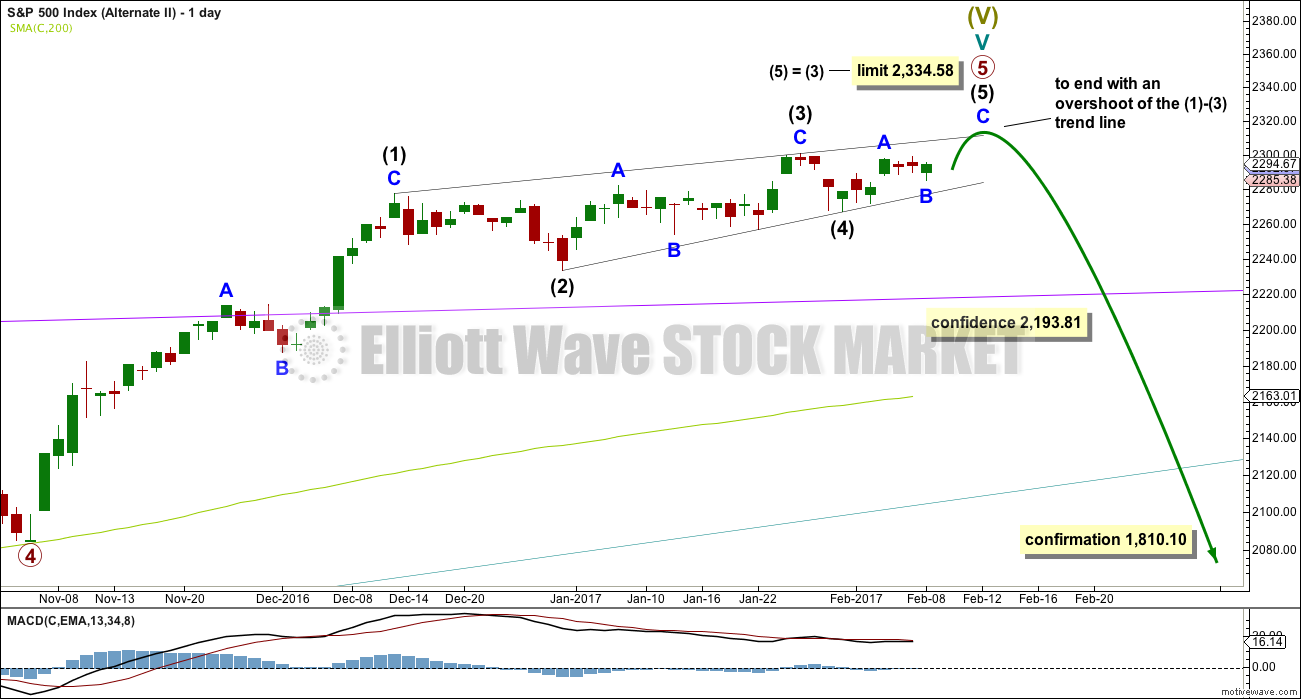
It remains possible that intermediate wave (4) is an incomplete expanded flat correction.
So far intermediate wave (4) may have lasted 38 sessions.
No target is given for minor wave C downwards because a target calculated using the Fibonacci ratio of 1.618 to minor wave A results in price falling short of the purple trend line. Minor wave C may end only when price comes down to touch the trend line again.
Minor wave B is now a 1.53 length to minor wave A. This is longer than the normal length of up to 1.38 but within the allowable convention of 2. The length of minor wave B has reduced the probability of this wave count.
Intermediate wave (4) may not move into intermediate wave (1) price territory below 2,193.81. It should find very strong support at the purple trend line and stop there.
HOURLY CHART
Click chart to enlarge.
Minor wave C must subdivide as a five wave structure. At this stage, it may be an impulse.
An impulse downwards may have been complete for minute wave i. Upwards movement to follow it may be a complete zigzag for minute wave ii.
If minute wave ii continues higher, it may not move beyond the start of minute wave i above 2,300.99.
The depth of this second wave correction is valid, but it is slightly unusual. This has reduced the probability of this alternate wave count a little at the end of last week.
SECOND ALTERNATE ELLIOTT WAVE COUNT
DAILY CHART – DETAIL
Click chart to enlarge.
I will publish alternate ideas from time to time in response to members queries or concerns. This alternate idea is new.
It does look suspiciously like an ending contracting diagonal may be underway and very close to completion.
Current upwards movement (which began on the 4th of November, 2016) must be a fifth wave for it to be an ending diagonal. That means that primary waves 1 through to 4 may be complete.
The only way for this to work and meet all Elliott wave rules is to see primary waves 1 and 2 over very quickly. This makes primary wave 3 longer than primary wave 1, so that the core rule stating a third wave may not be the shortest is met.
The ending diagonal is seen in more detail below.
DAILY CHART – DETAIL
Click chart to enlarge.
Ending contracting diagonals must have subwaves that all subdivide as zigzags. They normally end with a small overshoot of the 1-3 trend line.
If price makes a new all time high and slightly overshoots this line and then quickly reverses, then this wave count would be possible.
This wave count has some support from long term classic analysis at the monthly chart level, but it is not supported by Lowry’s analysis. At this time, Lowry’s do not see normal conditions for a major market top in place.
This wave count has a very low probability. It requires confidence below 2,193.81.
TECHNICAL ANALYSIS
WEEKLY CHART
Click chart to enlarge. Chart courtesy of StockCharts.com.
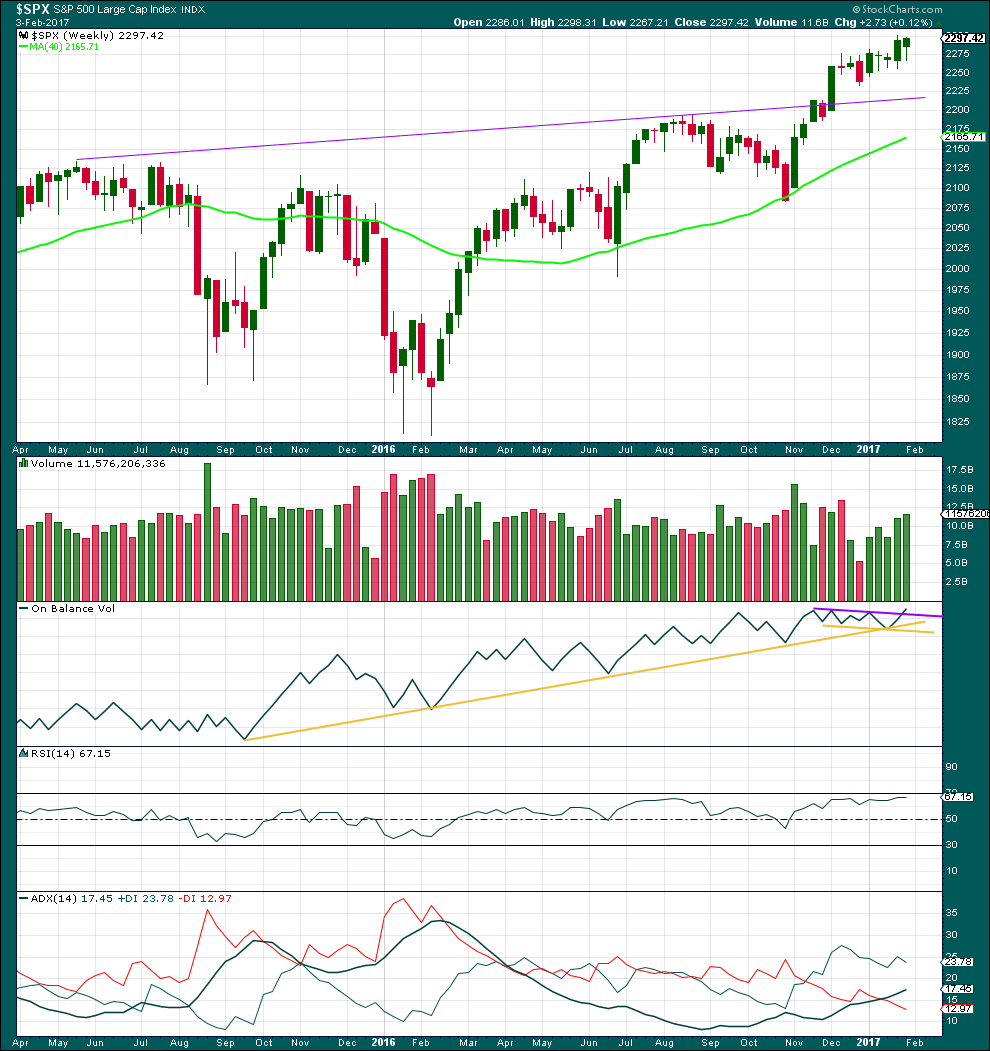
Overall, for five weeks in a row now, price has moved overall higher and volume is still increasing. The longer term picture at this weekly chart level looks like this market is in a reasonably healthy bull trend.
The long lower wick on this weekly candlestick is bullish. This week saw a further increase in volume, also bullish.
On Balance Volume has given an important bullish signal here with a break above the purple line. This line has a shallow slope and has been tested three times prior. This is a reasonable bullish signal.
RSI is not overbought. There is room for price to rise. There is no short or mid term divergence with price and RSI to indicate weakness.
ADX is above 15 and rising indicating a trend. The +DX line is above the -DX line; the trend is up. It is not yet anywhere near extreme. There is plenty of room for this trend to continue.
Overall, the picture on this weekly chart is very bullish. That does not mean the alternate Elliott wave count cannot be correct; it only means the probability of the alternate is lower than the main wave count.
DAILY CHART
Click chart to enlarge. Chart courtesy of StockCharts.com.
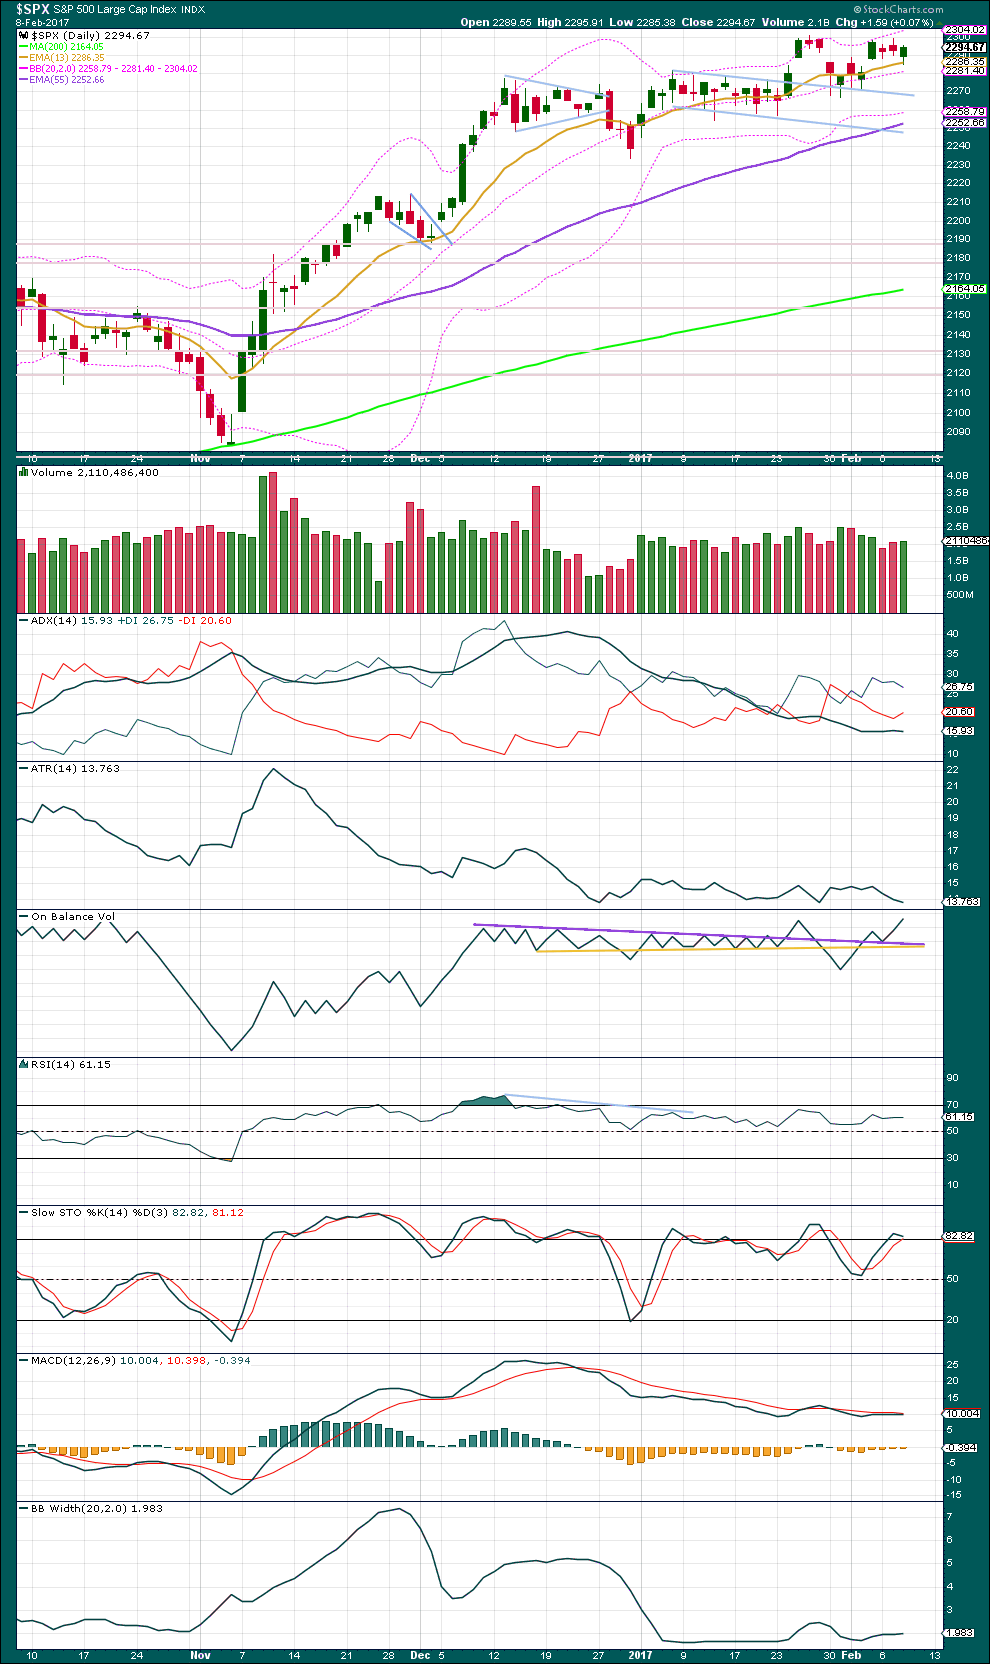
Price moved lower with a lower low and a lower high although the session closed green. The balance of volume during the session was upwards and it shows some increase. Upwards movement during the session has support from volume, which supports the main Elliott wave count.
All three of short, mid and long term moving averages have positive slopes, with short above mid above long. Price is above all three. This is typical for a bull trend that is strong and healthy.
ADX shows a very slight decline today, an indication that price may now be consolidating and not yet trending. Resistance at 2,300 is strong. Support is about 2,255. During this consolidation, it is the upwards day of the 25th of January that has strongest volume, but only by a little. The next strongest day is the 31st of January, when price moved lower. Overall, an upwards breakout is indicated as very slightly more likely than downwards here.
On Balance Volume has given a reasonable bullish signal with another break above resistance followed by a back test of support at the purple line. Because support has held now for two days this signal is reasonable, and it supports the main Elliott wave count over the alternate.
RSI is not extreme. There is room for price to continue higher.
Stochastics is almost overbought, but this may remain extreme for reasonable periods of time during a trending market.
MACD is still very slightly bearish to neutral.
Bollinger Bands remain very tightly contracted. This market is dead and needs resuscitation. A trend will again occur. Look for a breakout above 2,300 on a day with stronger volume to indicate an upwards trend. Or for a downwards trend a breakout below about 2,255, preferably but not necessarily on a day with stronger volume.
VOLATILITY – INVERTED VIX CHART
Click chart to enlarge. Chart courtesy of StockCharts.com.
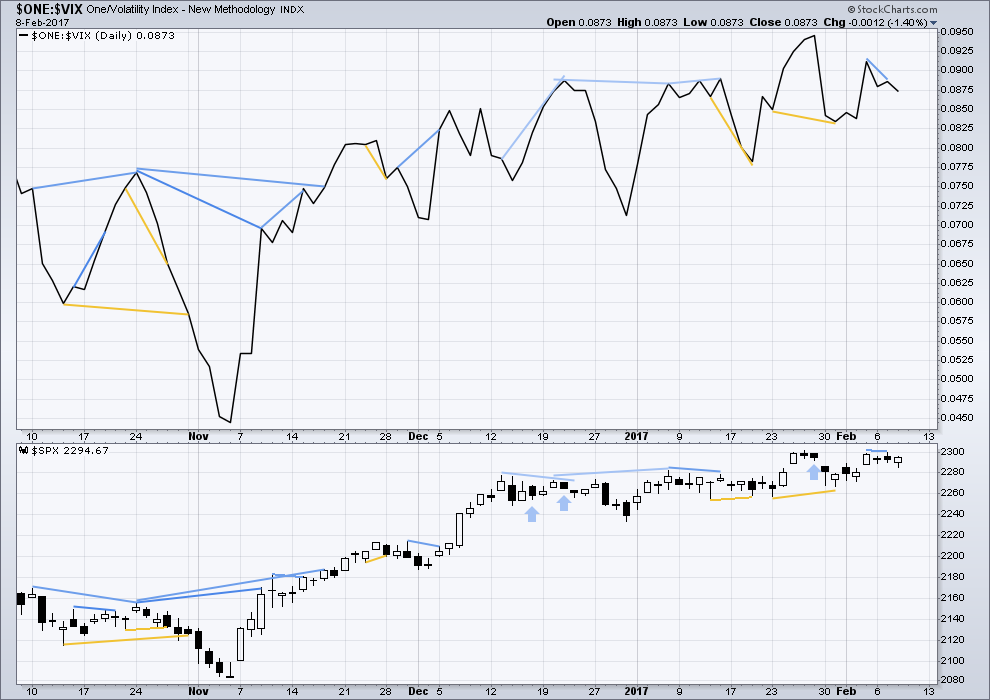
There are a few instances of multi day divergence between price and inverted VIX noted here. Bearish divergence is blue. Bullish divergence is yellow. It appears so far that divergence between inverted VIX and price is mostly working to indicate short term movements spanning one or two days. While this seems to be working more often than not, it is not always working. As with everything in technical analysis, there is nothing that is certain. This is an exercise in probability.
Slight bearish divergence noted between price and inverted VIX in yesterday’s analysis has now been followed by one downwards day. This divergence may now be resolved or it may require one more downwards day.
Price moved overall lower with a lower high and lower low. Inverted VIX also moved lower, so there is no new divergence here.
BREADTH – AD LINE
Click chart to enlarge. Chart courtesy of StockCharts.com.
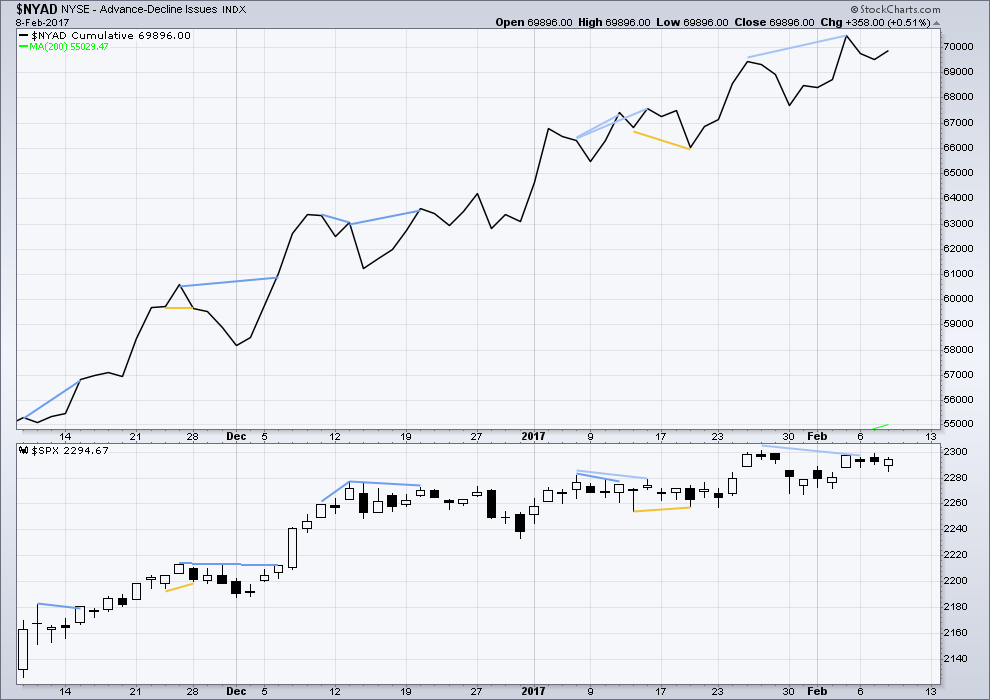
Price moved overall lower although the session closed green and the balance of volume was upwards.
The AD line has moved higher. Overall market breadth improved while price declined. This divergence is interpreted as bullish; the fall in price today was not supported by a corresponding decline in market breadth. This divergence favours the main Elliott wave count for the short term.
DOW THEORY
The DJIA, DJT, S&P500 and Nasdaq have made new all time highs in December of 2016. This confirms a bull market continues.
This analysis is published @ 9:26 p.m. EST.
Nice call on that bullish breakout Lara! It looks like anchors away! 🙂
Cheers Verne 🙂
Sailing away…
Surf’s up tomorrow here Chris. 3ft… nice to have a reasonable sized wave here.
I posted this on yesterday’s blog. But thought I’d bring it forward so you might be able to see it and respond.
You wrote:
If anyone here at EWSM missed it, I’ve done the first in a series of Traders Room posts over at Elliott Wave Gold. It’s free and open to the public, and will be for some months.
I’m planning on doing this twice weekly minimum. So go have a look and let me know if you can see any tweaks I can make to make it better.
Let’s all make some money!
Reply
—————————————————————————————————-
Then I replied:
Thank you Lara. Where do I go to see that? I tried opening the EWGA but was not permitted. Perhaps I am missing something.
Just go over to ElliottWaveGold.com and you’ll see it on the home page. You don’t have to click on anything, you don’t have to be a member there to see it. It’s public.
Here it is.
I’m labelling today’s upwards move as an incomplete first wave for minuette (i). I’m doing that because otherwise I’d be labelling the middle of minor 3 over, and it’s barely moved beyond the end of minor 1 today. It’s also not yet broken above the base channel, that’s still providing resistance.
There is quite some resistance to overcome here from the upper trend line. This really is a bit painful to watch, Mr Market looks like he may be gasping back into life today.
The first alternate is invalidated. No deep pullback to the purple line ever did happen.
I’ll be expecting that Lowry’s and Chris Ciovacco (and me too) are most likely right, and price is going to keep on going up overall. So far that assumption is proving correct. Assume the trend remains the same, until proven otherwise.
Keeping an eye on that ending diagonal scenario (second alternate)… it would be invalidated above 2,334.58. That’s just below the target for minor wave 3.
So if minor 3 reaches it’s target we shall have a lot of confidence in this continuing upwards trend. Even though that second alternate has a very low probability I will continue to publish it for two reasons:
1. What if? What if I’m just plain wrong, and Lowry’s is wrong, and Chris Ciovacco is wrong too? That’s possible.
2. It gives us a price point above which we may have increased confidence in the main wave count. This is useful.
Wow, Lara. Not surprised, but amazed that you were able to salvage the main hourly chart. You’ve got the magic!
Looks excellent – time for a nice wave 3 of 3!
Thanks Ronald 🙂
I’m still holding onto my small long position, stop now moved up to breakeven. I sure would like to see a healthy profit when I get up tomorrow morning.
Come on Mr Market! You can do it!
You got your breakout on the SPX and should be well in the money on your trade. Awesome!
7am in New Zealand! Wake up, Lara, and see your prize!!
LOL Yes, I see that.
I’ve exited Gold buy for a small loss, but the profit on my S&P long is more than 3X greater so I’m pretty happy this morning.
Also have now a good entry for NZDUSD and maybe also for EURUSD.
Let’s see how this all plays out….
Yes, Lara, you should have a nice profit this AM. I managed to grab most of the upswing today. Cashed in quick when price stalled at the upper trend line (which always pleases my lovely bride).