
Upwards movement was expected for Wednesday’s session, and that is what has happened.
The main Elliott wave count remains the same and the alternate Elliott wave count remains possible.
Summary: Again, it is increasingly likely today that the next wave up has just begun. Confidence would be had above 2,289.14. The target is 2,338 for the short term and 2,382 for a longer term trade. If price breaks below 2,257.02, then a deeper pullback would be expected to be underway to end at the purple trend line.
New updates to this analysis are in bold.
Last monthly and weekly charts are here. Last historic analysis video is here.
MAIN ELLIOTT WAVE COUNT
WEEKLY CHART
Click chart to enlarge.
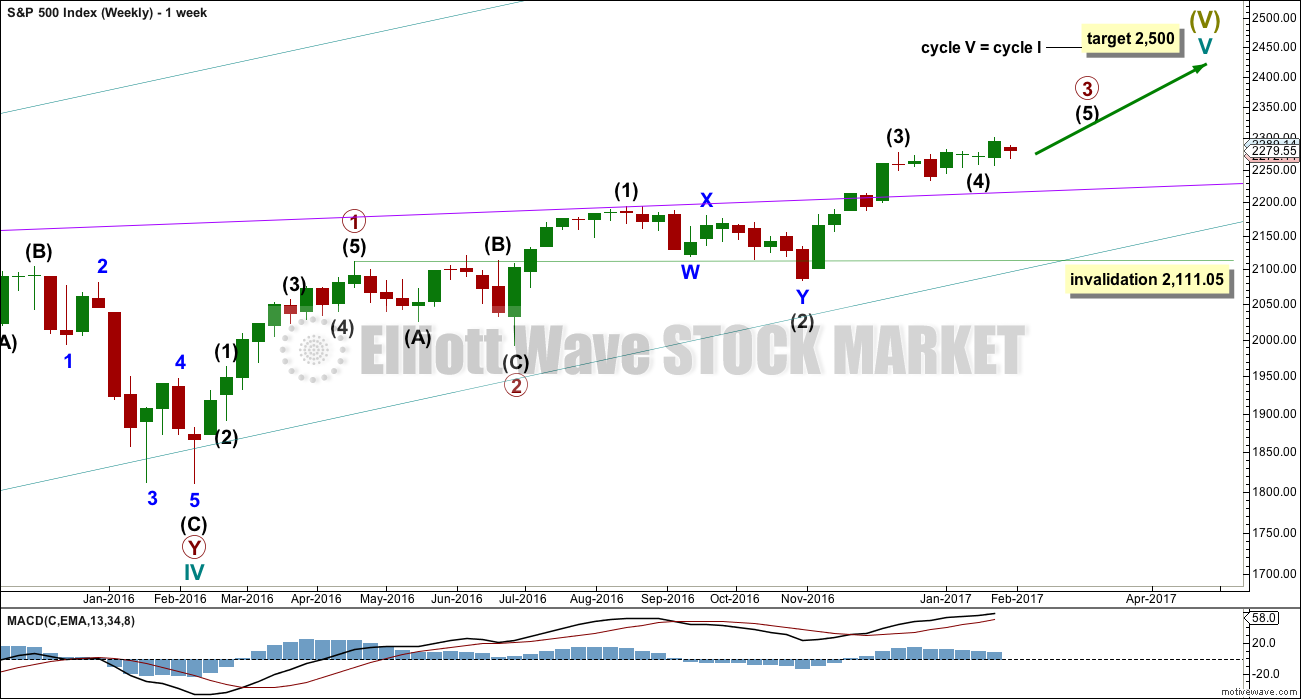
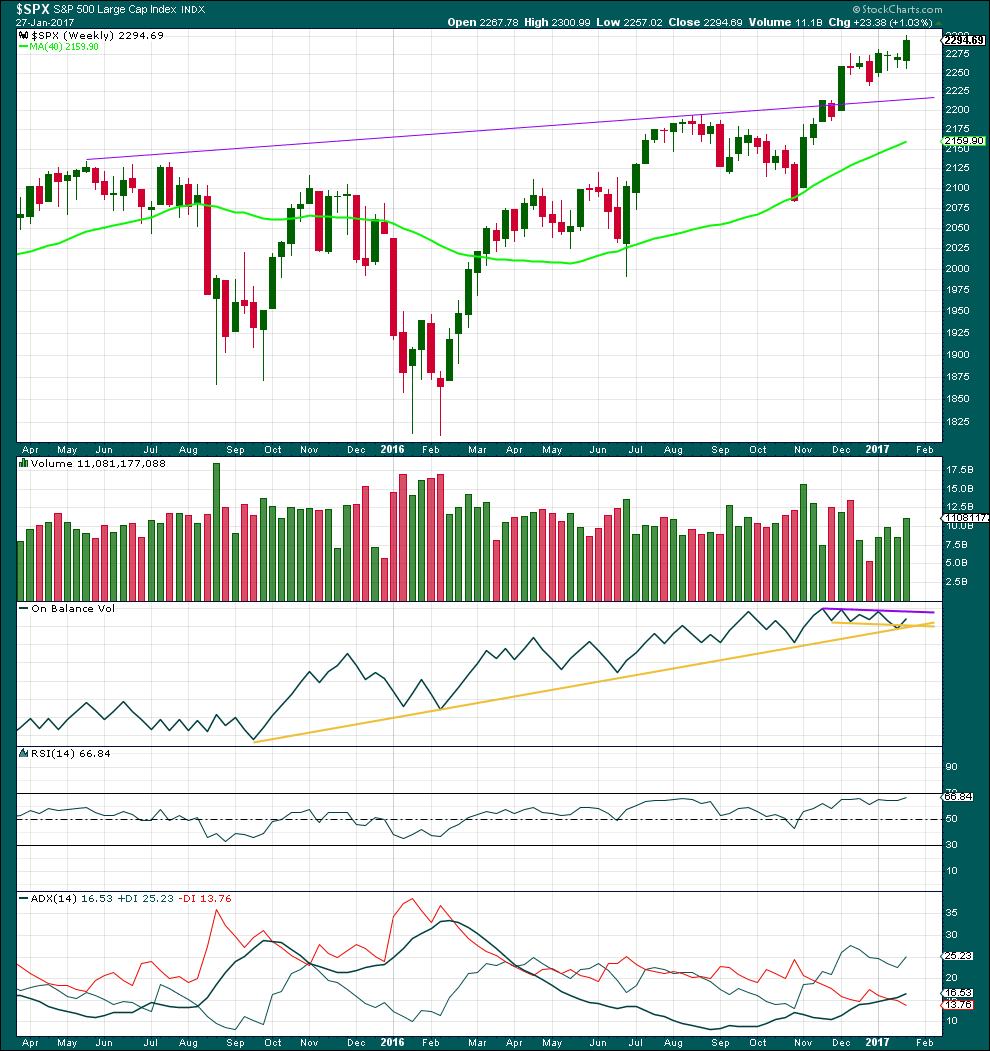
Cycle wave V is an incomplete structure. Within cycle wave V, primary wave 3 may be relatively close to completion.
When primary wave 3 is complete, then the following correction for primary wave 4 may not move into primary wave 1 price territory below 2,111.05.
Primary wave 2 was a flat correction lasting 47 days (not a Fibonacci number). Primary wave 4 may be expected to most likely be a zigzag, but it may also be a triangle if its structure exhibits alternation. If it is a zigzag, it may be more brief than primary wave 2, so a Fibonacci 21 sessions may be the initial expectation. If it is a triangle, then it may be a Fibonacci 34 or 55 sessions.
Primary wave 3 at this stage though is incomplete and may continue to move price higher.
DAILY CHART
Click chart to enlarge.
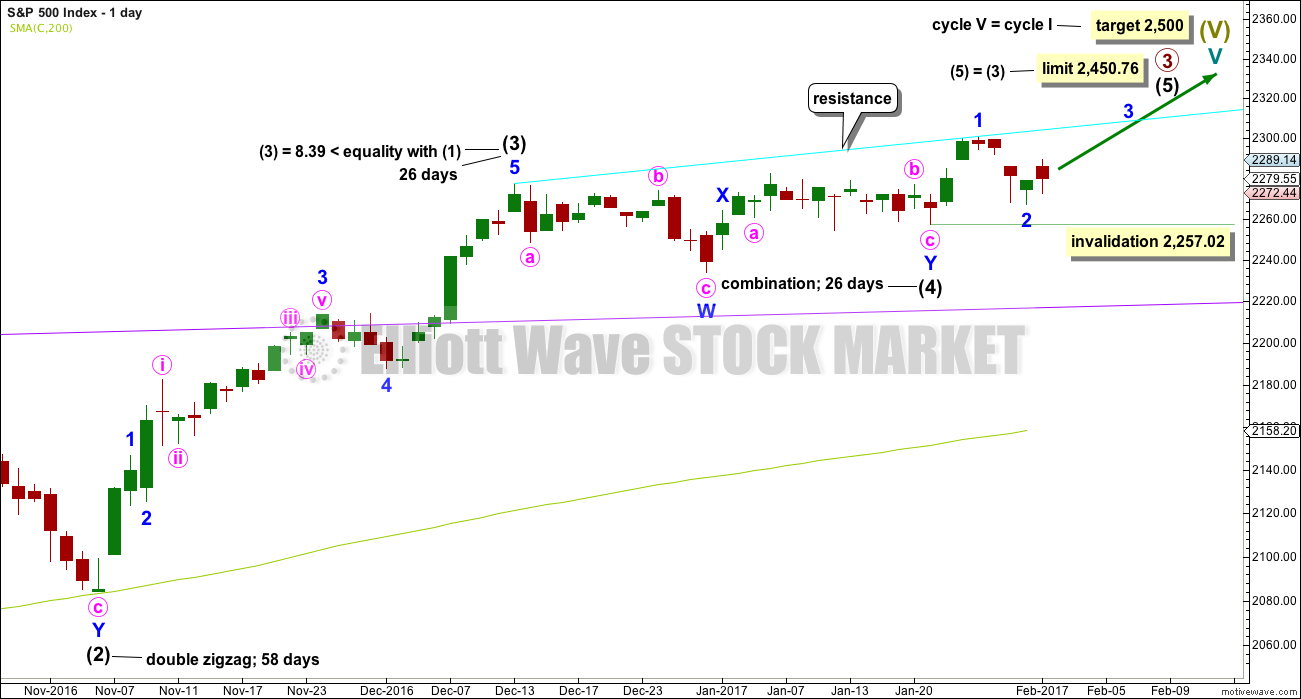
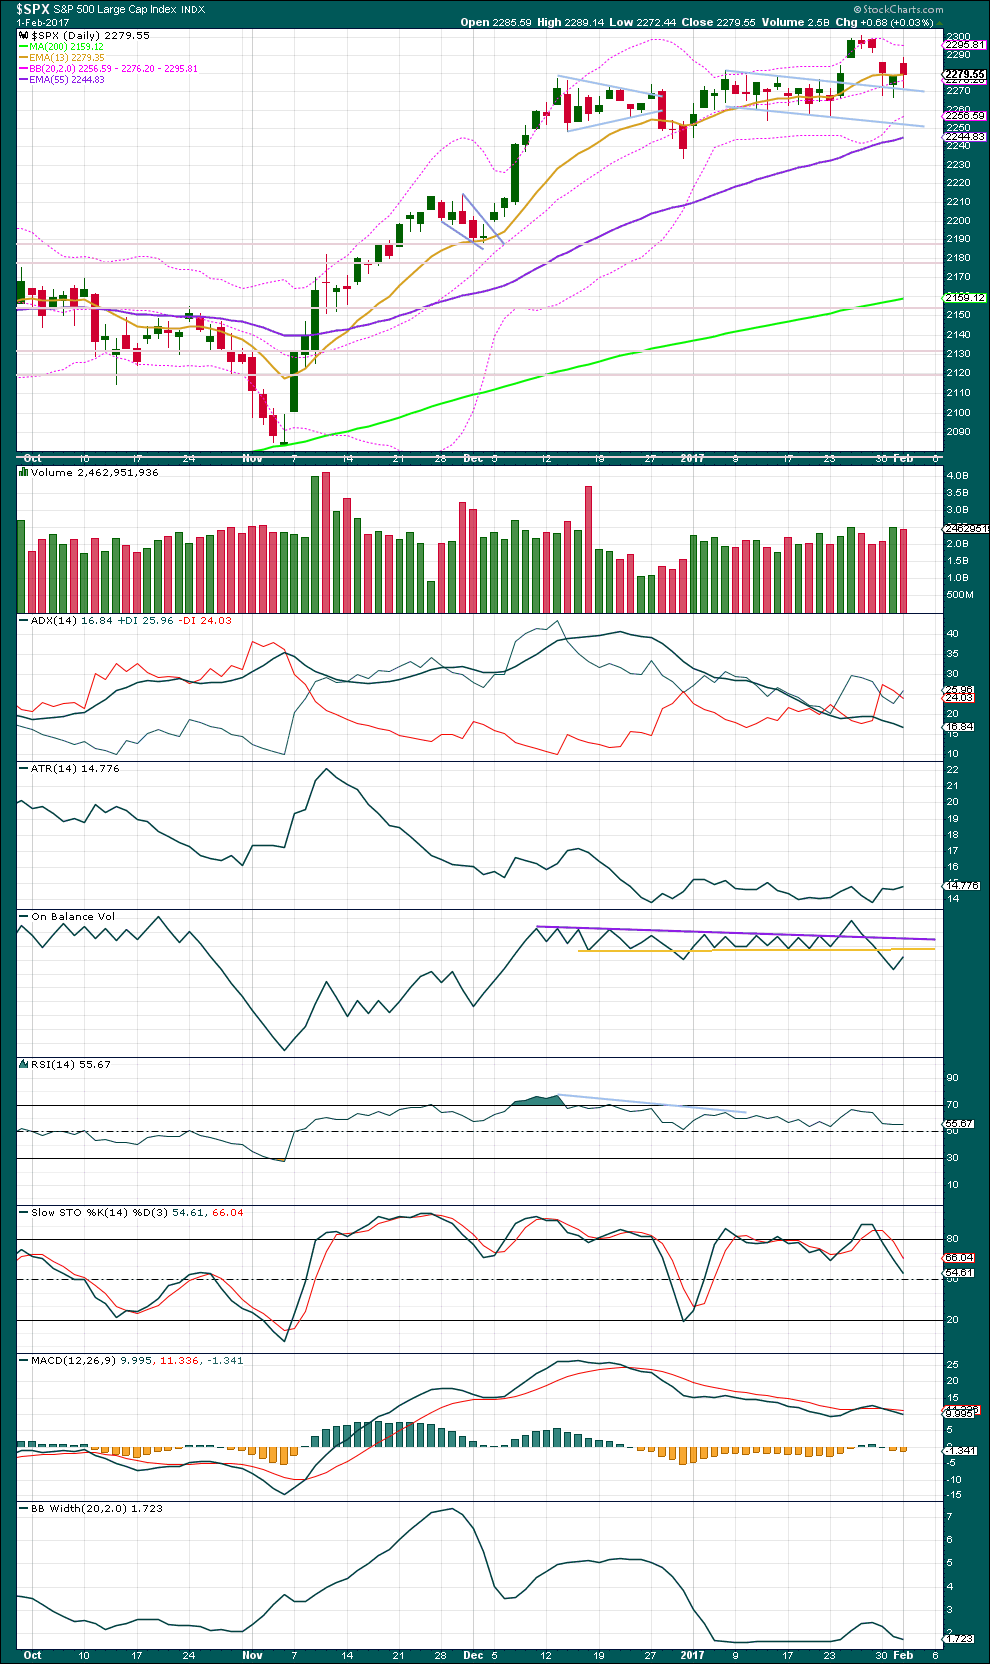
It is possible that intermediate wave (4) is a complete combination: zigzag – X – flat. It would have been even in duration with intermediate wave (3), both lasting 26 days.
Intermediate wave (3) is shorter than intermediate wave (1). One of the core Elliott wave rules states a third wave may never be the shortest wave, so this limits intermediate wave (5) to no longer than equality in length with intermediate wave (3) at 2,450.76.
Within intermediate wave (5), no second wave correction may move beyond its start below 2,257.02.
Intermediate wave (5) has so far lasted just seven days. It may be expected to be shorter both in length and duration compared to intermediate wave (3). At this stage, an expectation of a Fibonacci 13 days total for intermediate wave (5) looks reasonable, so it may now continue for another six days or sessions. With the slow start to minor wave 3 this is now beginning to look too optimistic. The next Fibonacci number in the sequence is 21, which would see intermediate wave (5) continue for a further 14 sessions.
The proportion here between intermediate waves (2) and (4) is acceptable. There is alternation. Both are labelled W-X-Y, but double zigzags are quite different structures to double combinations.
It is my judgement today that the probability of this main wave count has now increased to about 65%.
HOURLY CHART
Click chart to enlarge.
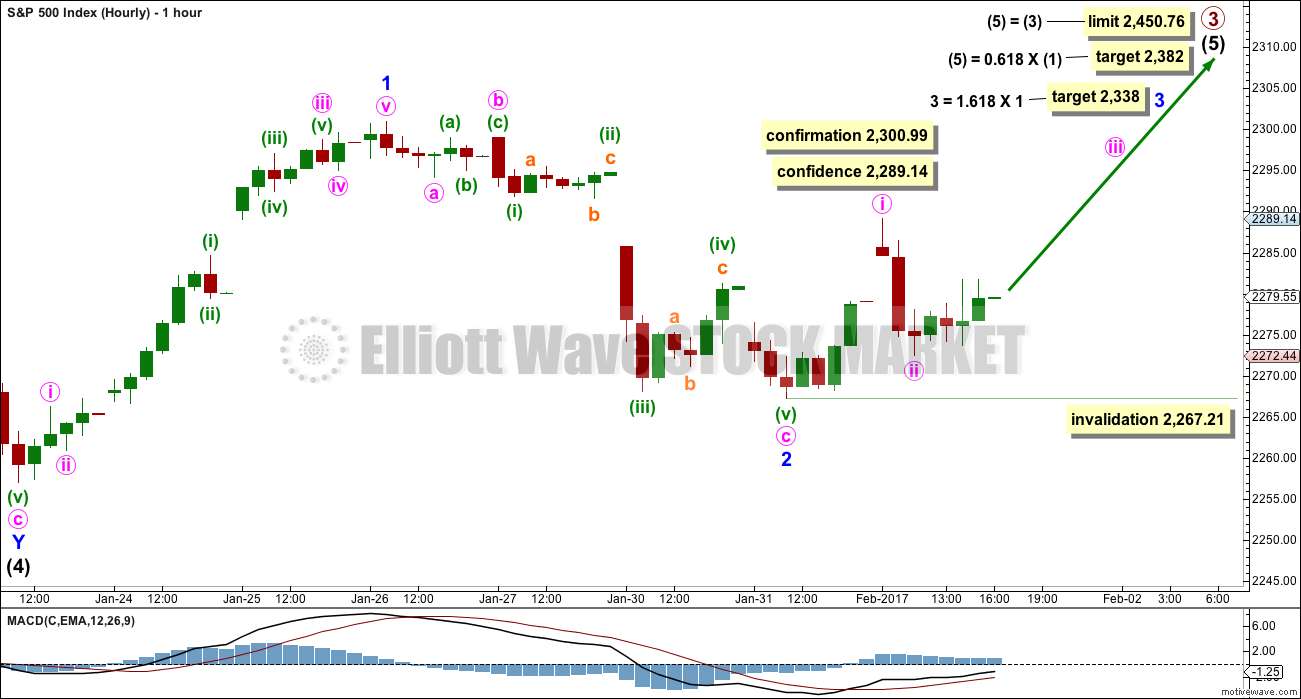
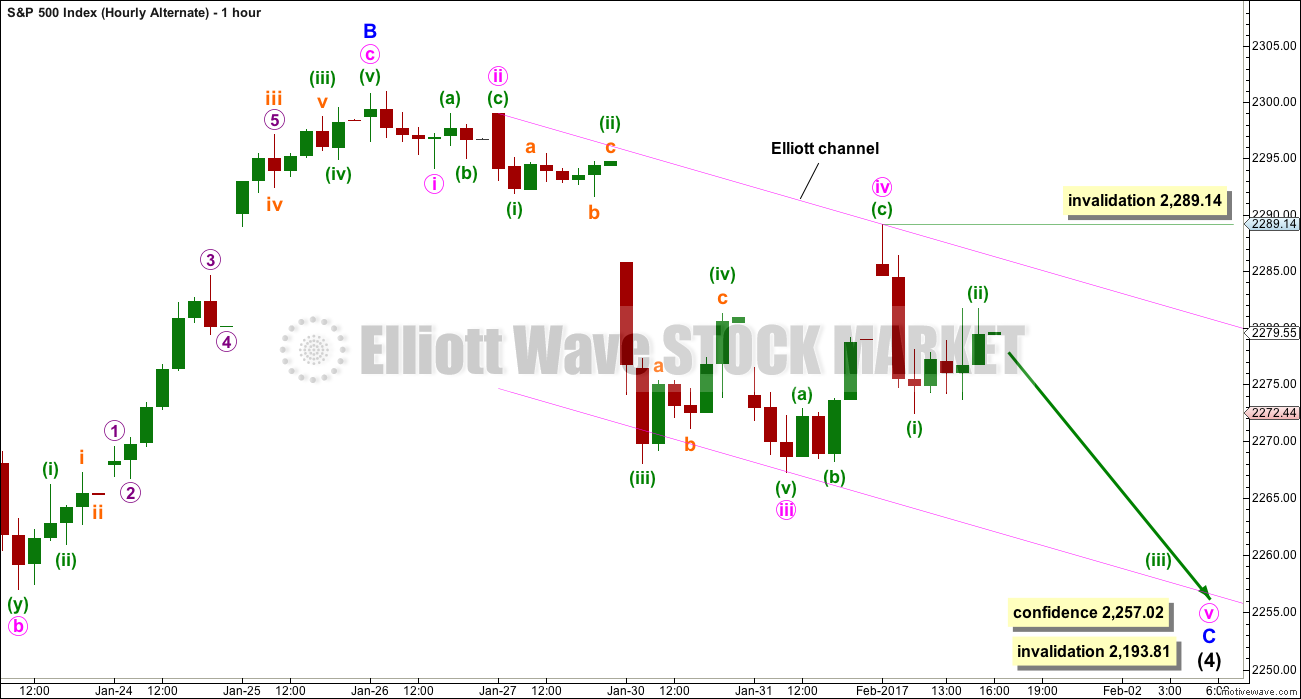
Intermediate wave (5) must subdivide as a five wave structure, either an impulse or an ending diagonal. At this stage, it is not possible to eliminate either option.
Within intermediate wave (5), minor waves 1 and 2 may be complete.
Within minor wave 3, minute waves i and ii may be complete. If minute wave ii moves lower tomorrow, it may not move beyond the start of minute wave i below 2,267.21.
A new high above 2,289.14 would add some confidence to this wave count. A new high above 2,300.99 would confirm it and invalidate any alternate. At that stage, reasonable confidence in targets may be had.
The target for minor wave 3 assumes the most likely Fibonacci ratio for it to minor wave 1. Minor wave 3 may last about a Fibonacci five days.
If price moves below 2,257.02, this main wave count would be invalidated and the alternate below would be confirmed.
ALTERNATE ELLIOTT WAVE COUNT
DAILY CHART
Click chart to enlarge.
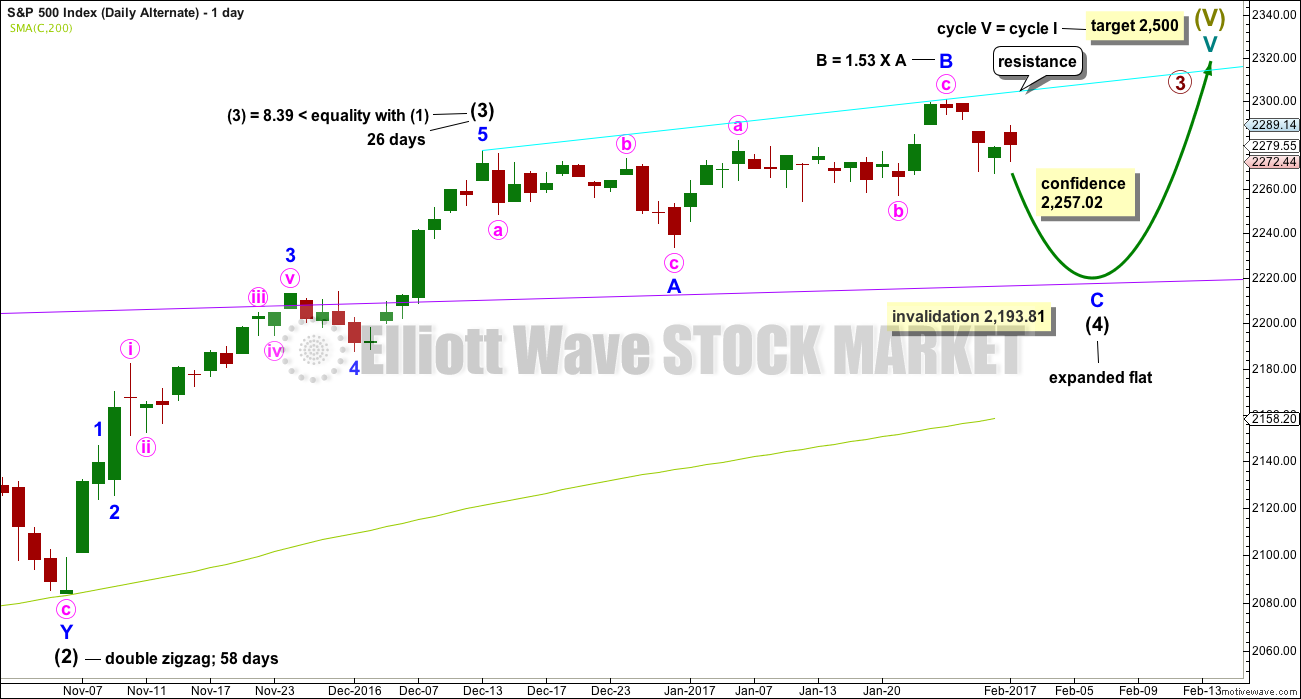
It remains possible that intermediate wave (4) is an incomplete expanded flat correction.
So far intermediate wave (4) may have lasted 33 sessions. It does not look like it can complete in just one more session, so it may not exhibit a Fibonacci duration.
No target is given for minor wave C downwards because a target calculated using the Fibonacci ratio of 1.618 to minor wave A results in price falling short of the purple trend line. Minor wave C may end only when price comes down to touch the trend line again.
Minor wave B is now a 1.53 length to minor wave A. This is longer than the normal length of up to 1.38 but within the allowable convention of 2. The length of minor wave B has reduced the probability of this wave count.
Intermediate wave (4) may not move into intermediate wave (1) price territory below 2,193.81. It should find very strong support at the purple trend line and stop there.
HOURLY CHART
Click chart to enlarge.
Minor wave C must subdivide as a five wave structure. At this stage, it may be an impulse.
There is alternation between the expanded flat of minuette wave (ii) and the zigzag of minuette wave (iv).
Minute wave iv should now be over. It is nicely in proportion to minute wave ii; minute wave ii lasted four hours and minute wave iv lasted six.
Within minute wave v, no second wave correction may move beyond the start of its first wave above 2,289.14.
A new low below 2,257.02 would add substantial confidence to this wave count. At that stage, look for downwards movement to continue and end only when price comes to touch the purple trend line on the daily and weekly charts.
TECHNICAL ANALYSIS
WEEKLY CHART
Click chart to enlarge. Chart courtesy of StockCharts.com.
A strong upwards week comes with an increase in volume. The rise in price is supported by volume.
On Balance Volume has found support and moved up and away from the long yellow support line. This is a bullish signal. OBV has not yet reached resistance. It may find some resistance at the purple line.
RSI is not yet overbought and exhibits no divergence with price. There is room still for price to rise further.
ADX indicates the beginning of an upwards trend. This is not extreme. There is plenty of room for the trend to continue.
DAILY CHART
Click chart to enlarge. Chart courtesy of StockCharts.com.
Following an island reversal pattern the minor movement that preceded it may be expected to be retraced. In this instance, that would be the small upwards wave from 2,257 on the 23rd of January. This has been mostly retraced. The three long lower wicks on the last three daily candlesticks are bullish indicating a deeper retracement looks unlikely now.
Price broke out above a flag pattern and has now curved around to test support at the upper edge of the flat. It would be typical behaviour of price to now move up and away.
Price moved higher today with a higher high and a higher low. The balance of volume was upwards. Volume is reasonable compared to recent days, but slightly lighter than the prior day which was actually downwards. Today the rise in price was not well supported by volume.
ADX reached extreme on the 15th of December, above 35, and the ADX line was above both directional lines. Since then a large consolidation has been unfolding with an upwards bias. This has brought ADX right down to below 20, and now the ADX line is below both directional lines. There is again plenty of room for a trend to develop. During the consolidation, it is an upwards day of the 25th of January that has strongest volume indicating the next trend is most likely to be upwards.
ATR is flat while price is consolidating.
On Balance Volume gave a bearish signal with a break below the yellow line. This may offer resistance. A break above this line would be a bullish signal. A break above the purple line would also be a bullish signal. These lines are not working perfectly though because each has been broken only for OBV to shortly after return.
RSI is not extreme. There is plenty of room for price to rise or fall.
MACD is bearish.
Bollinger Bands are again tightly contracted. Price remains mostly within the upper half of the Bollinger Bands range.
VOLATILITY – INVERTED VIX CHART
Click chart to enlarge. Chart courtesy of StockCharts.com.
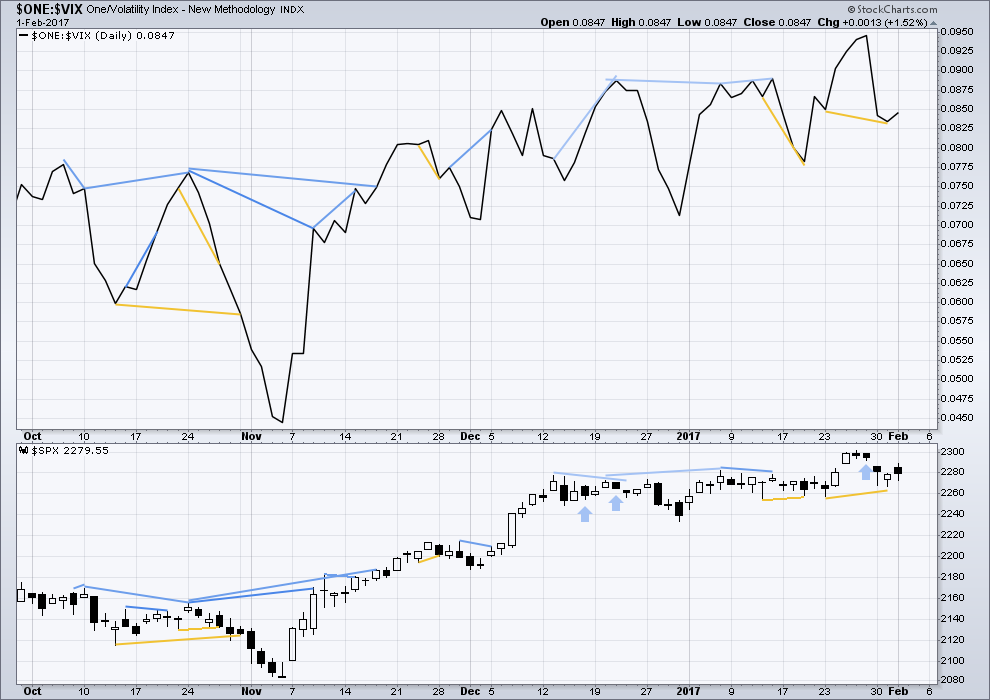
There are a few instances of multi day divergence between price and inverted VIX noted here. Bearish divergence is blue. Bullish divergence is yellow. It appears so far that divergence between inverted VIX and price is mostly working to indicate short term movements spanning one or two days. While this seems to be working more often than not, it is not always working. As with everything in technical analysis, there is nothing that is certain. This is an exercise in probability.
Short term hidden bullish divergence has now been followed by one upwards day. It may be followed by one more before it is resolved.
BREADTH – AD LINE
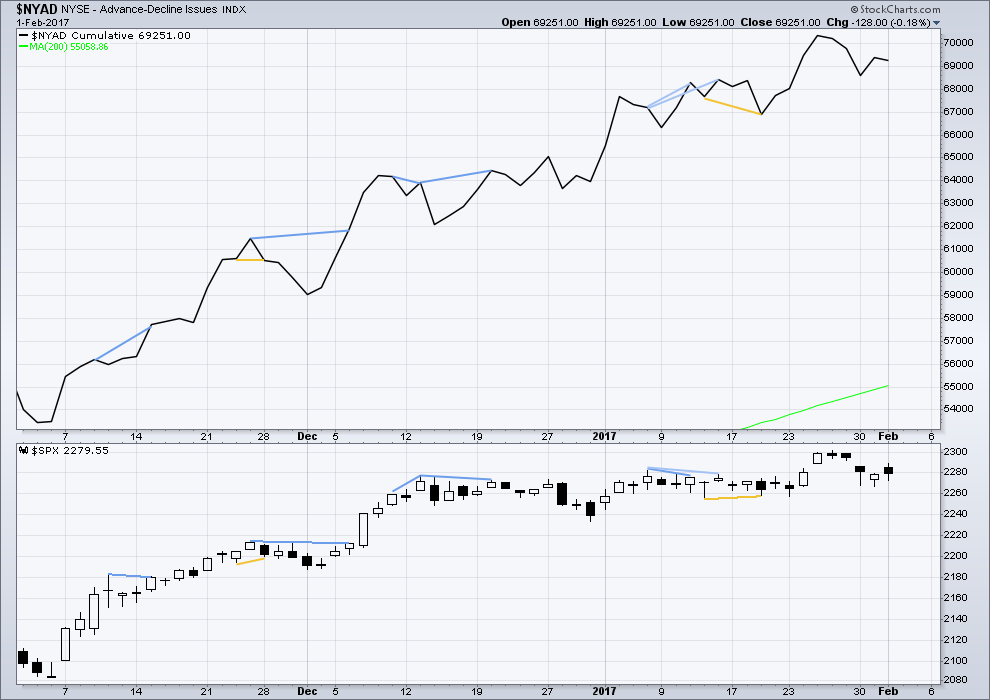
Click chart to enlarge. Chart courtesy of StockCharts.com.
Price moved overall higher today with the balance of volume during the session upwards. But the AD line has moved lower; market breadth declined while price moved higher. This single day divergence indicates something is wrong with this session; it is not normal. This is interpreted as bearish and favours the alternate Elliott wave count.
DOW THEORY
The DJIA, DJT, S&P500 and Nasdaq have made new all time highs in December of 2016. This confirms a bull market continues.
This analysis is published @ 09:45 p.m. EST.
A dead market and a dead comments section 🙁
I’m still holding onto my long position, slightly underwater but not by too much. Losing no sleep on this one.
Still no confidence for this chart in that price hasn’t moved above 2,289.14.
I’m adding a base channel to minute i and ii. Lower degree corrections should now find support at the lower edge. Initially upwards movement should find resistance at the upper edge until the power of a third wave breaks above it, then should find support.
These waves are choppier than 20kt onshore slop 🙂
All too quiet on the Western front.
Calm before the storm?
Verne did you see what the WIZARD did to the VIX at 2pm on the dot yesterday? If they are scared of a few down days, we are much closer to the end than we think. In addition, there’s a classic M(double top) pattern on 5 day RSI on the weekly SPX chart. Those are pretty bearish if not resolved soon.
Yep! My thesis remains that before the blow-off top, which I suspect is next on deck, Mr Market is going to buck off a few complacent and comfy riders. This mucking around is always a prelude to set -your -hair-on-fire
manic move and the last few times it was to the upside. My only concern is that I think Gold is also set to decline so a sharp move down would metals and markets moving in concert, as opposed to diverging as they have been doing of late. Perhaps the jobs report tomorrow? Next Pancholi turn dates are Feb 13, 14 so the next move could last a few weeks…..stand by…
Both the circle-iii up (main hourly) and the (iii) down (alternate hourly) being elusive, playing coy. Watchful waiting… … …