
A little more downwards movement was expected for Monday’s session, which is what has happened.
Summary: The situation is quite mixed today for the S&P, but on balance my judgement is that today’s downwards movement may present an opportunity to enter long to join the trend. Stops may be set just below today’s low at 2,277.29. If that is taken out, then the probability of the alternate wave count will increase. A new low below 2,257.02 would invalidate the main wave count and confirm the alternate, so at that stage expect a deeper pullback to about 2,218 and the purple trend line.
If members choose to use this pullback as an opportunity to enter long, it must be accepted that the alternate wave count may prove correct, so always use a stop and do not invest more than 1-5% of equity on any one trade. Less experienced members should adjust lower to 1-3% of equity on any one trade.
Alternatively, traders with longer time frames may choose to buy on this dip and hold on. Accept that the timing may not be perfect, but the market is in a bull trend that is strong and healthy. For a longer time frame, stops may be set just below the purple trend line.
New updates to this analysis are in bold.
Last monthly and weekly charts are here. Last historic analysis video is here.
MAIN ELLIOTT WAVE COUNT
WEEKLY CHART
Click chart to enlarge.
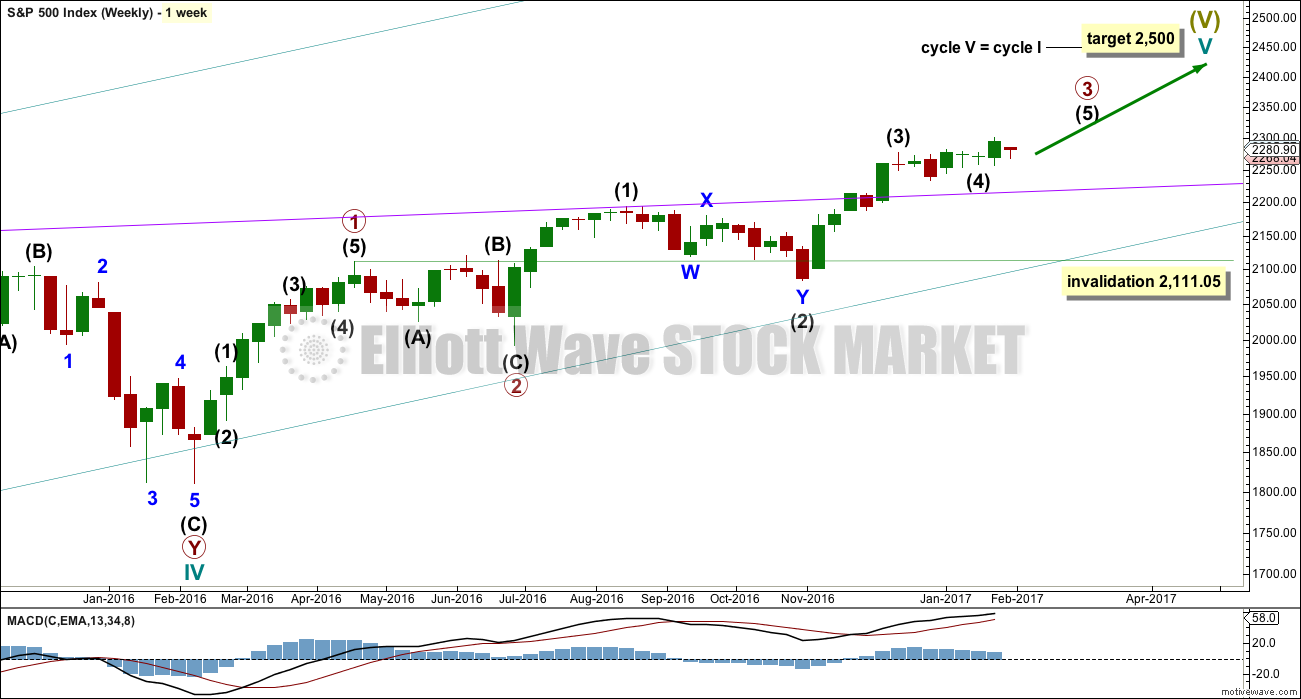
Cycle wave V is an incomplete structure. Within cycle wave V, primary wave 3 may be relatively close to completion.
When primary wave 3 is complete, then the following correction for primary wave 4 may not move into primary wave 1 price territory below 2,111.05.
Primary wave 2 was a flat correction lasting 47 days (not a Fibonacci number). Primary wave 4 may be expected to most likely be a zigzag, but it may also be a triangle if its structure exhibits alternation. If it is a zigzag, it may be more brief than primary wave 2, so a Fibonacci 21 sessions may be the initial expectation. If it is a triangle, then it may be a Fibonacci 34 or 55 sessions.
Primary wave 3 at this stage though is incomplete and may continue to move price higher.
DAILY CHART
Click chart to enlarge.
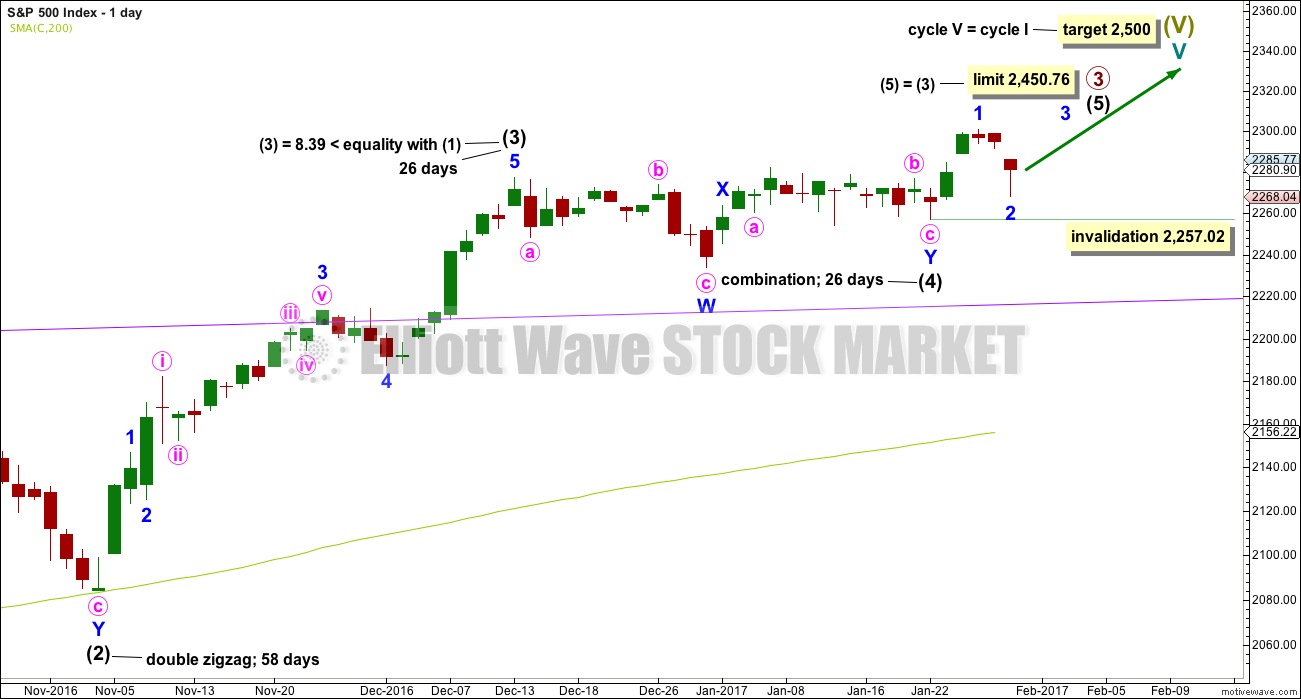
It is possible that intermediate wave (4) is a complete combination: zigzag – X – flat. It would have been even in duration with intermediate wave (3), both lasting 26 days.
Intermediate wave (3) is shorter than intermediate wave (1). One of the core Elliott wave rules states a third wave may never be the shortest wave, so this limits intermediate wave (5) to no longer than equality in length with intermediate wave (3) at 2,450.76.
Within intermediate wave (5), no second wave correction may move beyond its start below 2,257.02.
Intermediate wave (5) has so far lasted just five days. It may be expected to be shorter both in length and duration compared to intermediate wave (3). At this stage, an expectation of a Fibonacci 13 days total for intermediate wave (5) looks reasonable, so it may now continue for another eight days or sessions.
The proportion here between intermediate waves (2) and (4) is acceptable. There is alternation. Both are labelled W-X-Y, but double zigzags are quite different structures to double combinations.
Despite the deep pullback today below the target expected for minor wave 2, it is still my judgement that this main wave count is more likely. I would weight it about 55% – 60% likely today.
HOURLY CHART

Click chart to enlarge.
Intermediate wave (5) must subdivide as a five wave structure, either an impulse or an ending diagonal. At this stage, it is not possible to eliminate either option.
Within intermediate wave (5), minor wave 1 and now minor 2 may be complete.
Minor wave 2 subdivides perfectly on the five minute chart as a double zigzag. The first zigzag in the double was very shallow, just above the 0.236 Fibonacci ratio. The second zigzag has deepened the correction to below the 0.618 Fibonacci ratio.
Minor wave 2 now has lasted two sessions compared to three for minor wave 1. The proportions are very good.
A new high above 2,292.85 would add some confidence to this wave count. A new high above 2,300.99 would confirm it and invalidate any alternate. At that stage, reasonable confidence in targets may be had.
The target for minor wave 3 assumes the most likely Fibonacci ratio for it to minor wave 1. Minor wave 3 may last about a Fibonacci five days.
If price moves below 2,257.02, this main wave count would be invalidated and the alternate below would be confirmed.
ALTERNATE ELLIOTT WAVE COUNT
DAILY CHART
Click chart to enlarge.
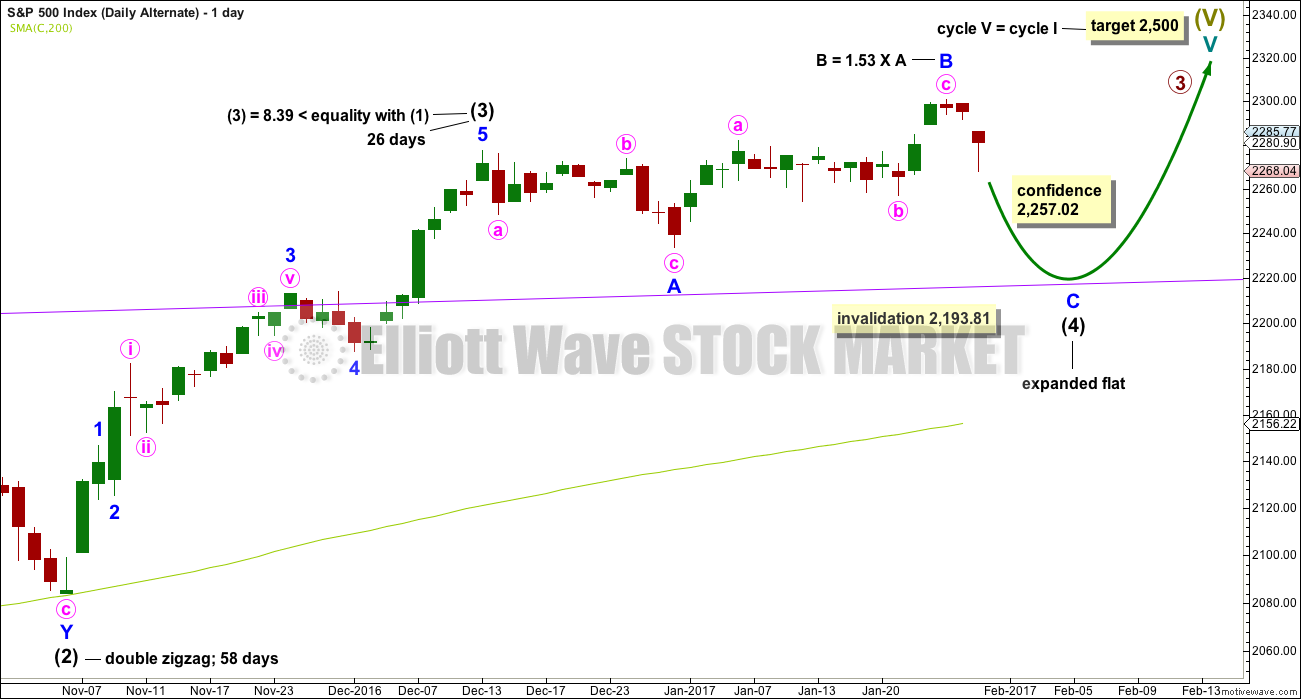
It remains possible that intermediate wave (4) is an incomplete expanded flat correction.
So far intermediate wave (4) may have lasted 31 sessions. It may continue for another three to total a Fibonacci 34 days or sessions.
No target is given for minor wave C downwards because a target calculated using the Fibonacci ratio of 1.618 to minor wave A results in price falling short of the purple trend line. Minor wave C may end only when price comes down to touch the trend line again.
Minor wave B is now a 1.53 length to minor wave A. This is longer than the normal length of up to 1.38 but within the allowable convention of 2. The length of minor wave B has reduced the probability of this wave count.
Intermediate wave (4) may not move into intermediate wave (1) price territory below 2,193.81. It should find very strong support at the purple trend line and stop there.
It is my judgement today that this alternate wave count may be about 40% – 45% likely.
HOURLY CHART
Click chart to enlarge.
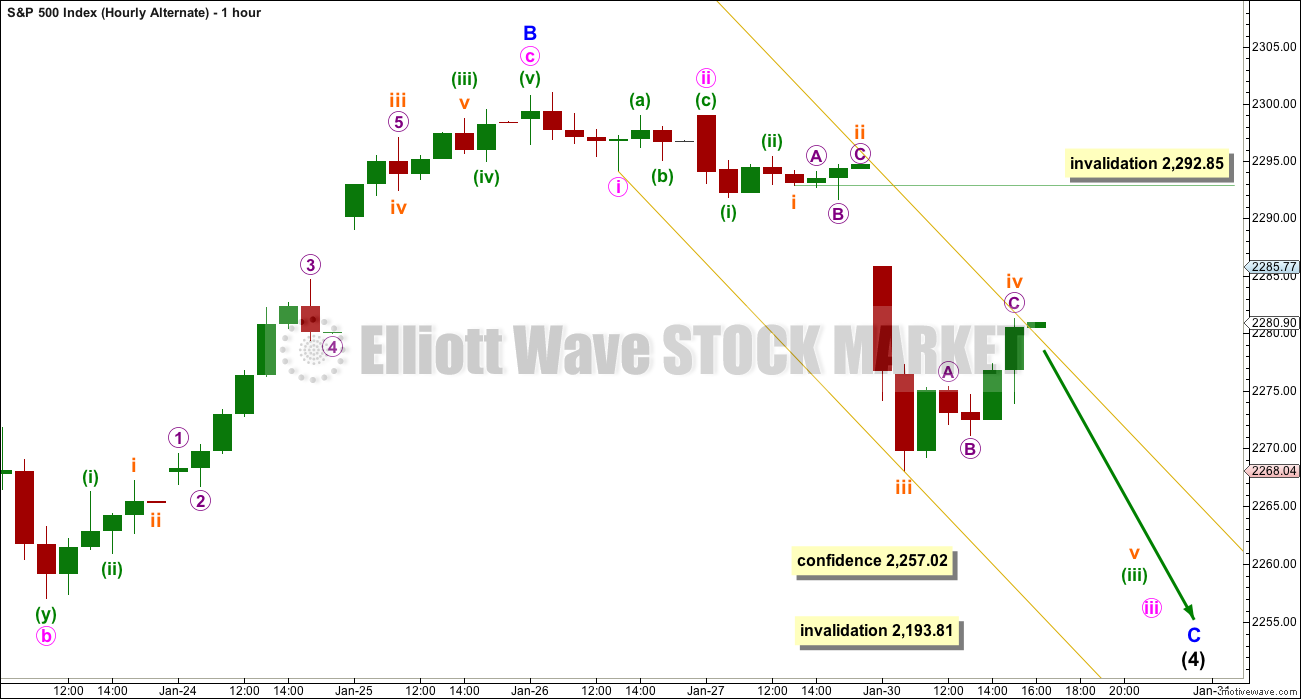
Minor wave C must subdivide as a five wave structure. At this stage, it may be an impulse.
Within the impulse, it may have begun with three overlapping first and second waves. Now subminuette wave iv may be complete. This wave count would expect tomorrow’s session to begin with downwards movement.
There is alternation between the expanded flat of subminuette wave ii and the zigzag of subminuette wave iv.
While it is technically possible that subminuette wave iv may continue higher, that would give this wave count an odd look. It is already longer lasting than minute wave ii and minuette wave (ii), both one and two degrees higher. It is the proportion between corrections within an impulse that give the wave count the right look.
Subminuette wave iv may not move into subminuette wave i price territory above 2,292.85.
A new low below 2,257.02 would add substantial confidence to this wave count. At that stage, look for downwards movement to continue and end only when price comes to touch the purple trend line on the daily and weekly charts.
TECHNICAL ANALYSIS
WEEKLY CHART
Click chart to enlarge. Chart courtesy of StockCharts.com.
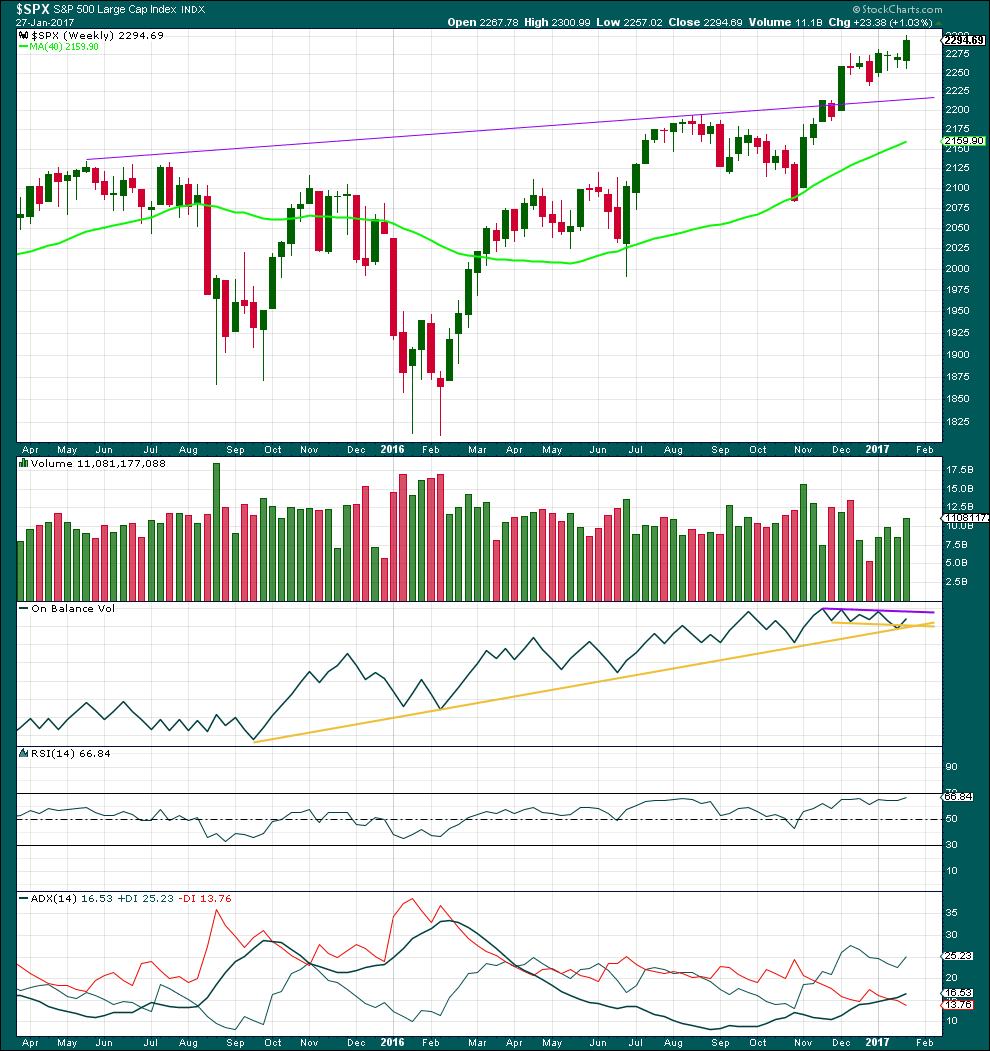
A strong upwards week comes with an increase in volume. The rise in price is supported by volume.
On Balance Volume has found support and moved up and away from the long yellow support line. This is a bullish signal. OBV has not yet reached resistance. It may find some resistance at the purple line.
RSI is not yet overbought and exhibits no divergence with price. There is room still for price to rise further.
ADX indicates the beginning of an upwards trend. This is not extreme. There is plenty of room for the trend to continue.
DAILY CHART
Click chart to enlarge. Chart courtesy of StockCharts.com.
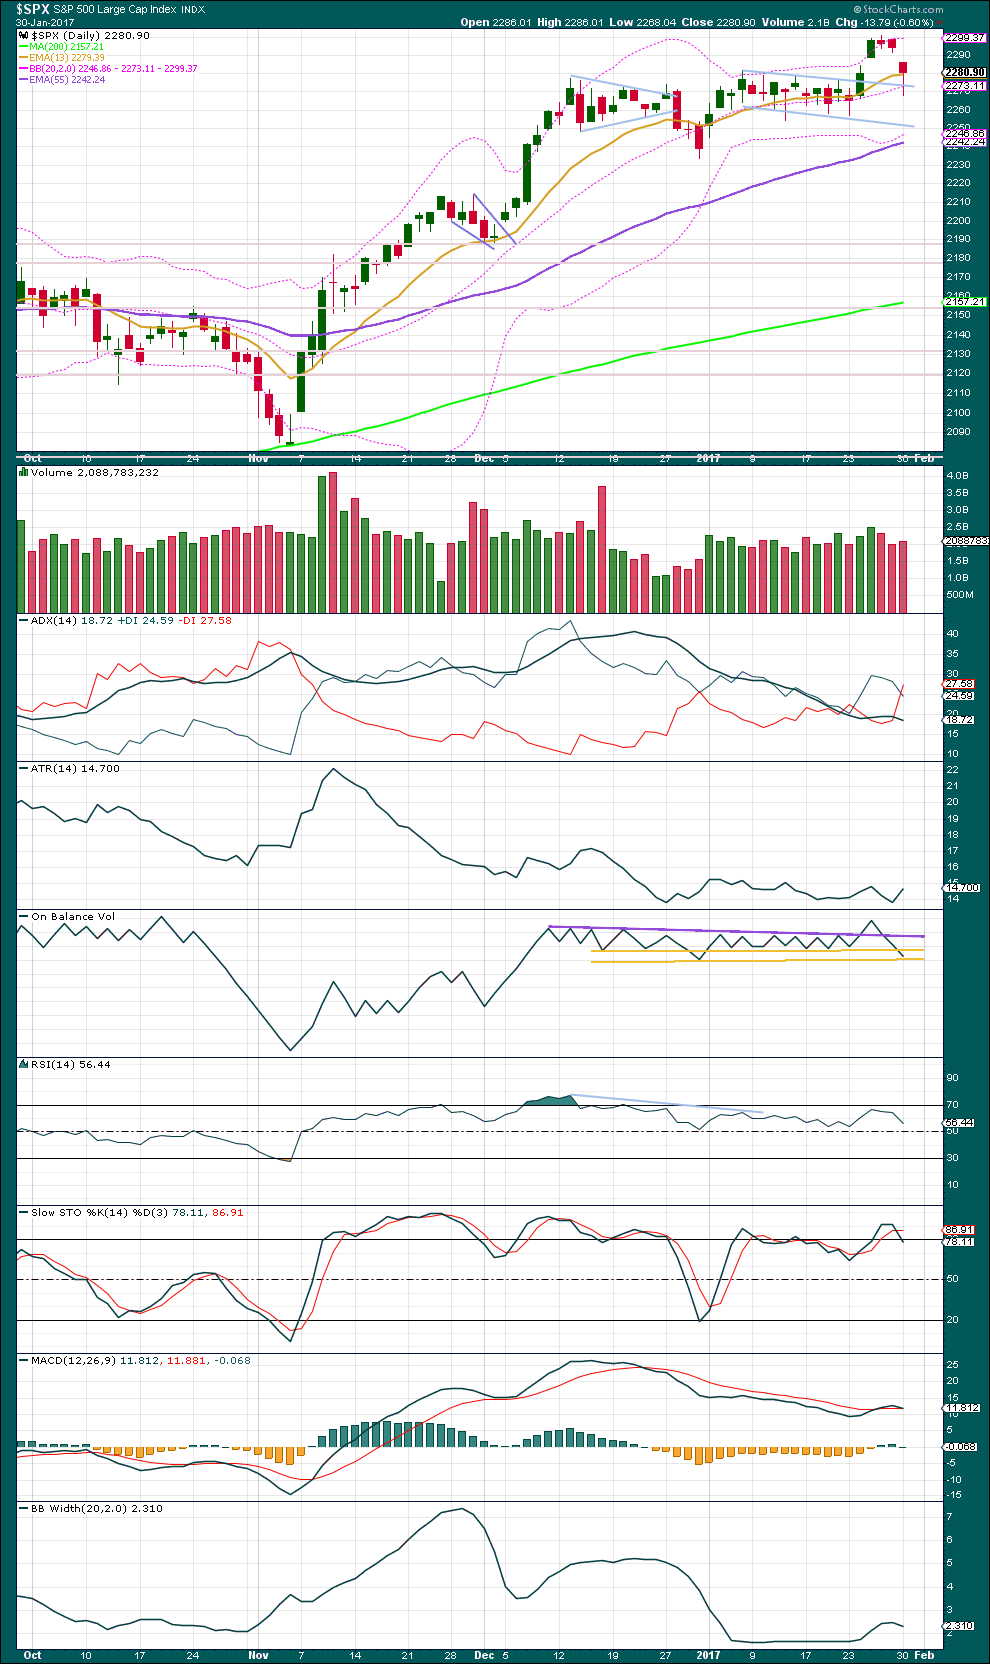
The gap down today completes an island reversal pattern. However, not much weight at all will be given to this pattern today.
From one of my favourite technical analysis texts, the classic “Technical Analysis of Stock Trends” by Magee et al:
“The island pattern is not common, and it is not, in itself, of major significance, in the sense of denoting a long term Top or Bottom, but it does, as a rule, send prices back for a complete retracement of the Minor Move which preceded it.”
In this instance, the preceding minor move would be the small upwards movement from 2,257.02 on the 23rd of January to the last high of 2,300.99 on the 26th of January.
Further from Magee: “An Island Pattern is not easy to trade on, unless it be for a short term “scalp”, as, obviously, a good share of the retracement may already have been accomplished by the time the Island is charted and an order to buy or sell on its indications can be executed.”
The preceding move has been mostly retraced. This pattern fits neatly with the expectations for the main Elliott wave count.
The long lower wick on today’s candlestick is bullish. The slight rise in volume today is bearish.
ADX still indicates the market is not yet trending, but it has today indicated a potential change from up to down. No new trend though is indicated today, only a consolidation.
ATR remains overall flat. One day of increase is not enough to conclude it has changed.
On Balance Volume gave a bearish signal with a break below the upper yellow line. However, this line has been breached before and OBV immediately returned above it, so the line is weakened. A parallel copy is drawn and pulled lower, which may offer support, but it has no technical significance.
RSI is not extreme. There is plenty of room for price to move higher or lower here.
Stochastics is overbought still, which is bearish. It exhibits longer term divergence with price (back to the 9th of December, 2016) which may favour the alternate Elliott wave count. Not too much weight will be given to the overbought condition as this oscillator may remain extreme for weeks during a trend for the S&P.
The bullish signal given by MACD yesterday may be negated today.
Bollinger Bands began to widen slightly as price moved higher. Now they have contracted slightly today as price moved lower. This suggests the trend here if it develops may be more likely upwards.
VOLATILITY – INVERTED VIX CHART
Click chart to enlarge. Chart courtesy of StockCharts.com.
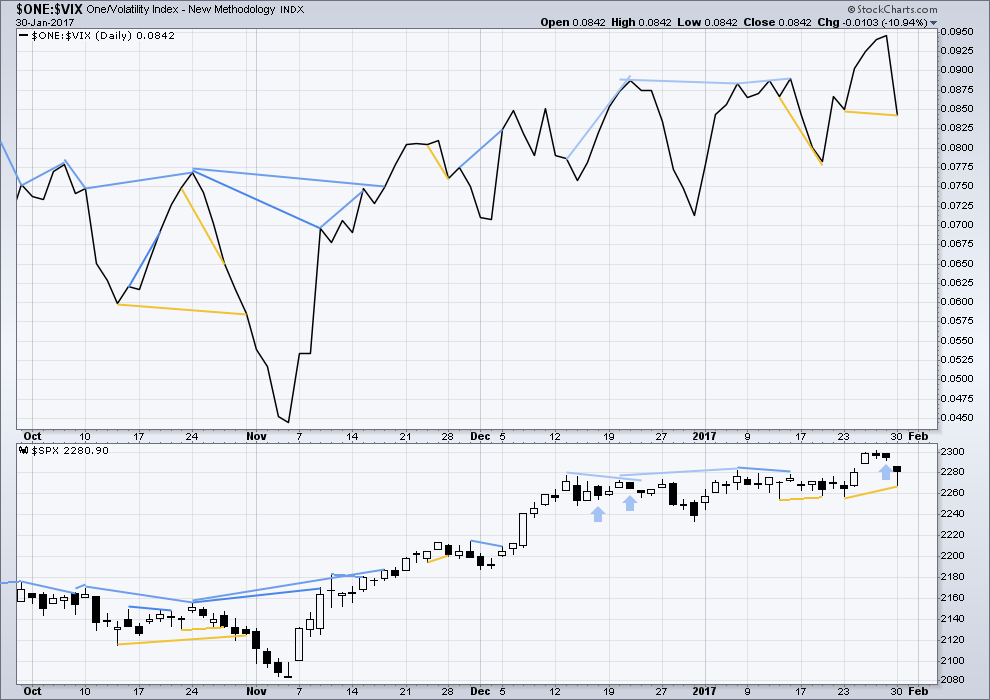
There are a few instances of multi day divergence between price and inverted VIX noted here. Bearish divergence is blue. Bullish divergence is yellow. It appears so far that divergence between inverted VIX and price is mostly working to indicate short term movements spanning one or two days. While this seems to be working more often than not, it is not always working. As with everything in technical analysis, there is nothing that is certain. This is an exercise in probability.
Single day divergence noted in last analysis between price and inverted VIX, denoted by the blue arrow, has been followed by one day of reasonable downwards movement. It may now be resolved.
New short term divergence is noted with yellow lines: price has made a higher low from the low of the 23rd of January, but inverted VIX has made a lower low. This is hidden bullish divergence and indicates underlying strength.
Four prior instances of hidden bullish divergence are noted on this chart. Only one of those four resulted almost immediately in upwards movement, and two of the four were followed by several days of downwards movement. Only a very little weight is given to this divergence today. This offers small support for the main Elliott wave count.
BREADTH – AD LINE
Click chart to enlarge. Chart courtesy of StockCharts.com.
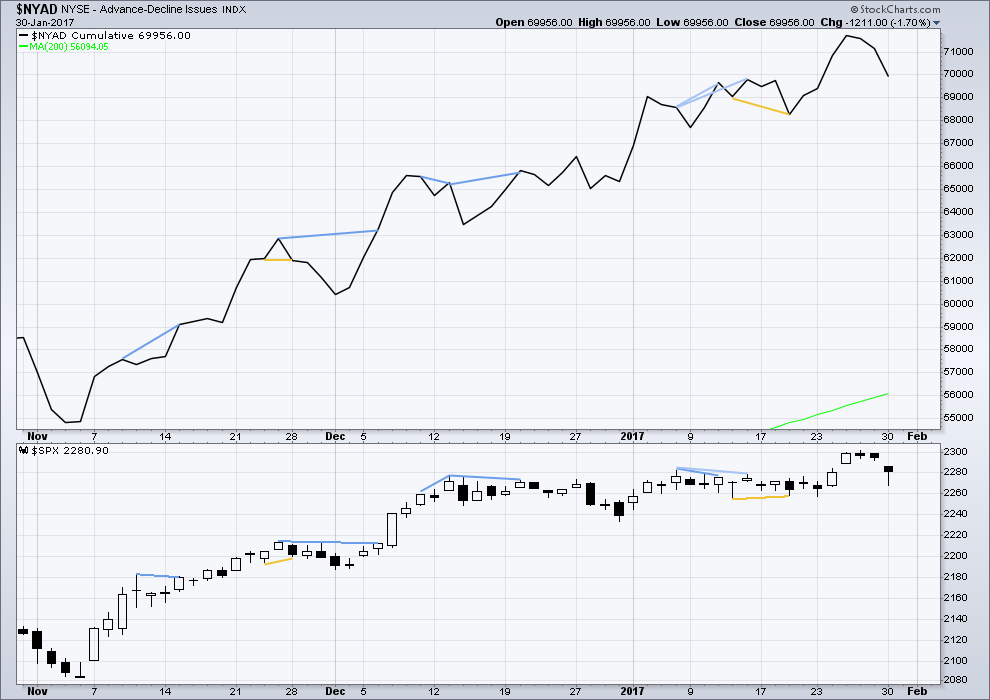
No new divergence at today’s new high is noted between price and the AD line.
No new short term divergence is noted today between price and the AD line.
At the end of last week, Lowry’s data show continuing underlying strength in this market. Their Operating Companies Only AD line is making new all time highs, so the rise in price has support from a rise in market breadth. This bull market looks healthy. Corrections are an opportunity to join the trend.
DOW THEORY
The DJIA, DJT, S&P500 and Nasdaq have made new all time highs in December of 2016. This confirms a bull market continues.
This analysis is published @ 10:47 p.m. EST.
Hourly alternate update: Still incomplete. Still requires confidence below 2,257.02.
Short term this structure has a slightly better fit for this alternate than the main count with the slight new low today.
I continue to be amazed at the complete absence of any fear whatsoever evident in this market.
True. CNN’s Fear & Greed index today is neutral.
Lara,
I am considering to initiate a position in small steps. But I had a genuine question that what will be the alternate count if the correction breaks purple trend line and overlaps with 2190.
Thanks.
If 2,193.81 is breached then you do not want to be long. This may be happening.
The probability of it is so low I’m not publishing it every day, but I am keeping an eye on this.
Always always please use a stop. Trading without a stop exposes all the equity in your account to risk, that’s now newbies wipe out their accounts at least once.
Strange ain’t it? There’s not one in a hundred analysts that are even contemplating a chart like that one. Markets back in a long term consolidation range so that purple line has just taken on extreme significance. it is a good way below the consolidation area so if it breaks….!!!!!
Always gotta consider “what if”. What if I’m wrong? It wouldn’t be the first time, nor the last.
A road map for if I’m wrong is a good idea.
Indeed! I am frankly hoping the purple line holds so we can get the final waves up completed as a break would not absolutely confirm that a top is in.
thanks a lot. this is helpful to know.
Iwm holding up but better than Dow but close to new low
The decline yesterday was aggressively bought, as evidenced by the long lower wick. The BTFD mindset is in full force along with no doubt significant FED pumping, the current extraordinary on-going bullishness suggesting more of the latter as buyers appear to already be all-in. I do not buy the notion that the banksters are going to somehow try to hurt Trump by tanking the market as that would amount to self-immolation, pure and simple. I am quite confident that market declines going forward will not be arrested by short-covering, as that market cohort has long left the scene. Keeping a close eye on 2257.02. This ought to be most interesting.
Hi Lara,
The analysis on EWSM indicates that wave (4) is complete. The attached analysis indicates that wave (4) is almost complete. Can you give me your thoughts on where the attached needs help?
Thanks, Chuck
My head hurts twisting it to see 🙂
I’ll print it out and respond later this morning here in this comment section for you Chuck. But first: the candlesticks, are they quarterly? the numbers on the bottom, are they dates? I need to be clear on exactly what I’m looking at here.
I just got back from my chiropractor! 🙂 🙂 🙂
good boy…
🙂
Lol. I use an iPad to see this one.
Okay, I’ve printed it out and can now see it’s the daily chart for recent movement.
The fourth wave here is labelled A-B-C, and incomplete. That is pretty much the same as my alternate daily chart published in this analysis.
The problem here with this wave count is how wave B is labelled. I can see subwaves labelled a-b-c-d-e which is how a triangle is labelled, but this is not a triangle.
There is a video on my education page on the structure of Elliott wave triangles. Take a look at that. You’ll see that this labelling doesn’t meet the rules.
I like the —- trend line. I’ll add that to my daily charts. It may prove useful.