
Careful analysis of volume, On Balance Volume, and VIX may assist to find an entry to join the current trend.
Summary: Price has broken out upwards from a flag pattern. A target using the measured rule is 2,323 and an Elliott wave target is 2,382. Monday, and maybe Tuesday as well, may see price move a little lower; the target is at 2,284. A new low below 2,257.02 would indicate a deeper pullback to the purple trend line. If looking for a point to enter long, always use a stop and do not invest more than 1-5% of equity on any one trade.
Volume declined for Friday, On Balance Volume is very close to support, but VIX diverged from price on Friday. The last time VIX did this was during a consolidation which moved price overall lower. That is one reason why I expect some more downwards movement. But look out, the alternate is possible.
New updates to this analysis are in bold.
Last monthly and weekly charts are here. Last historic analysis video is here.
MAIN ELLIOTT WAVE COUNT
WEEKLY CHART
Click chart to enlarge.
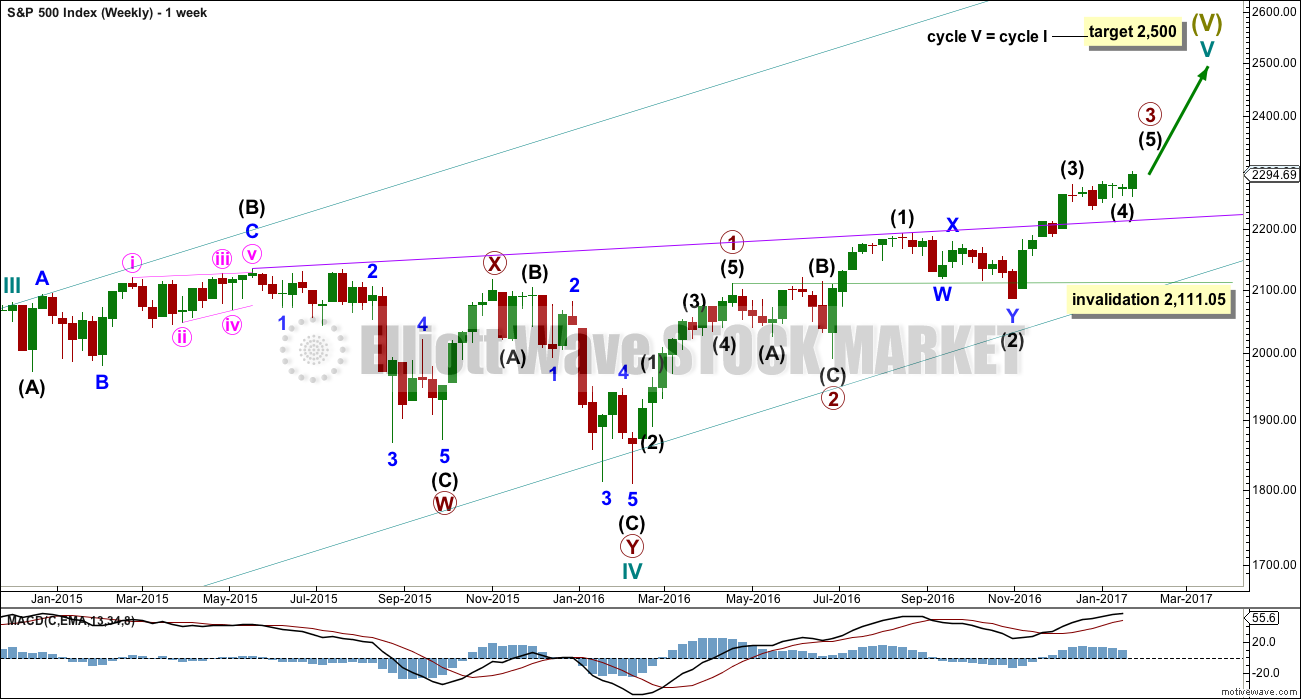
Cycle wave V is an incomplete structure. Within cycle wave V, primary wave 3 may be relatively close to completion.
When primary wave 3 is complete, then the following correction for primary wave 4 may not move into primary wave 1 price territory below 2,111.05.
Primary wave 2 was a flat correction lasting 47 days (not a Fibonacci number). Primary wave 4 may be expected to most likely be a zigzag, but it may also be a triangle if its structure exhibits alternation. If it is a zigzag, it may be more brief than primary wave 2, so a Fibonacci 21 sessions may be the initial expectation. If it is a triangle, then it may be a Fibonacci 34 or 55 sessions.
Primary wave 3 at this stage though is incomplete and may continue to move price higher.
DAILY CHART
Click chart to enlarge.
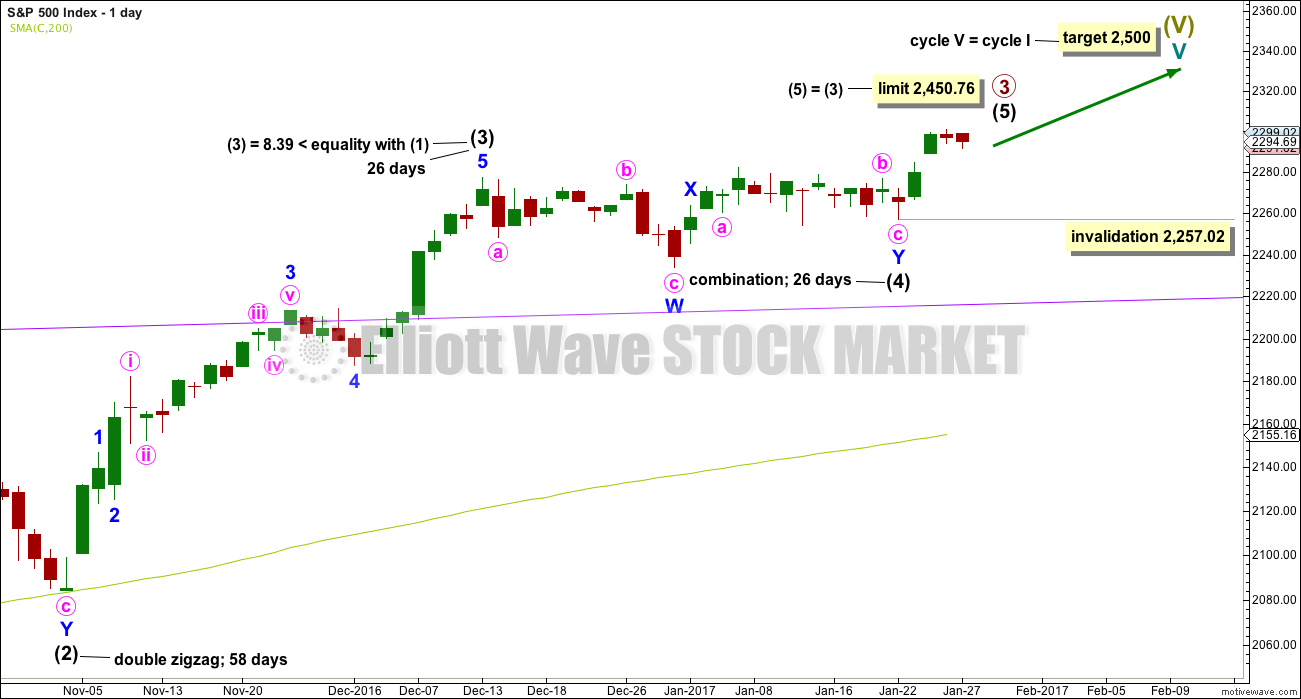
It is possible that intermediate wave (4) is a complete combination: zigzag – X – flat. It would have been even in duration with intermediate wave (3), both lasting 26 days.
Intermediate wave (3) is shorter than intermediate wave (1). One of the core Elliott wave rules states a third wave may never be the shortest wave, so this limits intermediate wave (5) to no longer than equality in length with intermediate wave (3) at 2,450.76.
Within intermediate wave (5), no second wave correction may move beyond its start below 2,257.02.
Intermediate wave (5) has so far lasted just four days. It may be expected to be shorter both in length and duration compared to intermediate wave (3). At this stage, an expectation of a Fibonacci 13 days total for intermediate wave (5) looks reasonable, so it may now continue for another 9 days or sessions.
The proportion here between intermediate waves (2) and (4) is acceptable. There is alternation. Both are labelled W-X-Y, but double zigzags are quite different structures to double combinations.
HOURLY CHART
Click chart to enlarge.
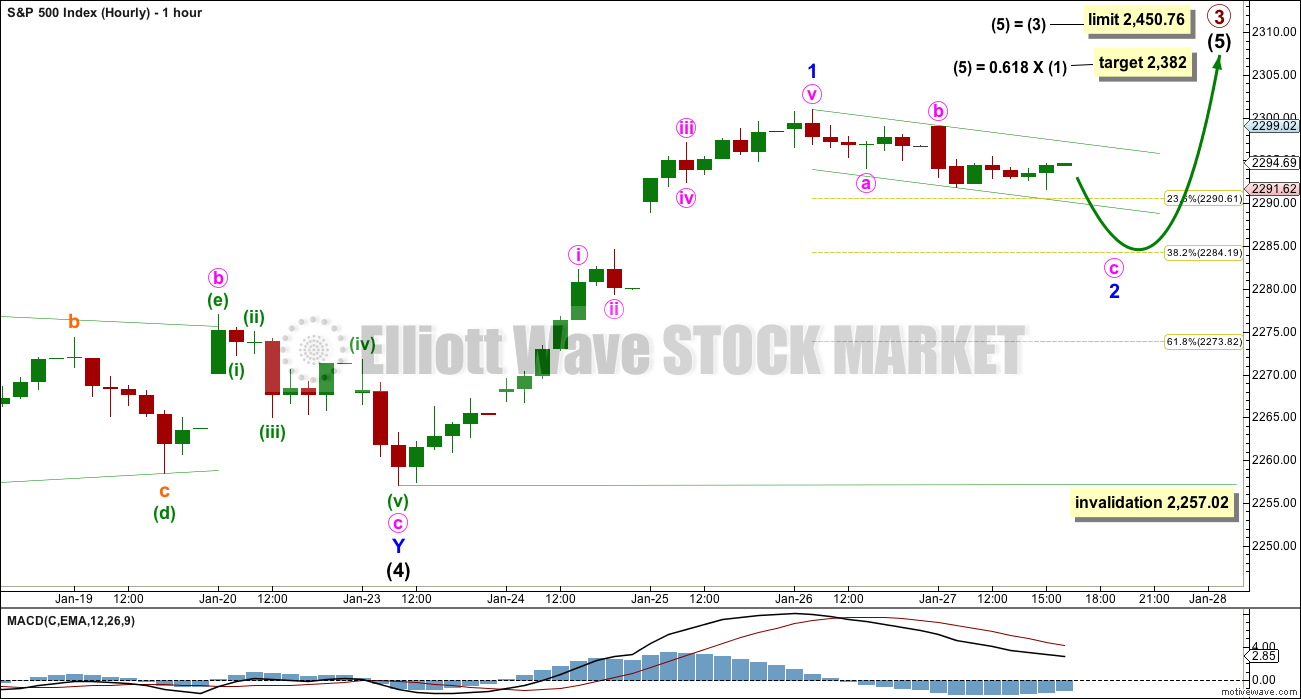
Intermediate wave (5) must subdivide as a five wave structure, either an impulse or an ending diagonal. At this stage, it is not possible to eliminate either option.
Within intermediate wave (5), minor wave 1 may be complete.
Minor wave 2 may be relatively brief and shallow. This was the pattern within the last upwards wave of intermediate wave (3) (from the 4th November, 2016, to the 13th December, 2016, seen on the daily chart). There, minor wave 2 was just 0.34 of minor wave 1 and was over within one session. Look out for this tendency again.
Within intermediate wave (3), the longest duration for a correction was four days for minor wave 4.
Within intermediate wave (1), minor wave 2 was brief lasting only two days. It was also shallow at only 0.30 of minor wave 1.
This does not mean that minor wave 2 within intermediate wave (5) must also be brief and shallow, only that the balance of probability points to this.
The preferred target for minor wave 2 will be about 2,284.
Analysis of the structure of minor wave 2 at the five minute chart level shows it is most likely incomplete. Minute wave a subdivides as a leading contracting diagonal and minute wave b subdivides as a three. Minute wave c must be a five wave structure. But as of Friday’s low that does not fit, so it looks likely to move lower.
If price moves below 2,257.02, this main wave count would be invalidated and the alternate below would be confirmed.
ALTERNATE ELLIOTT WAVE COUNT
DAILY CHART
Click chart to enlarge.
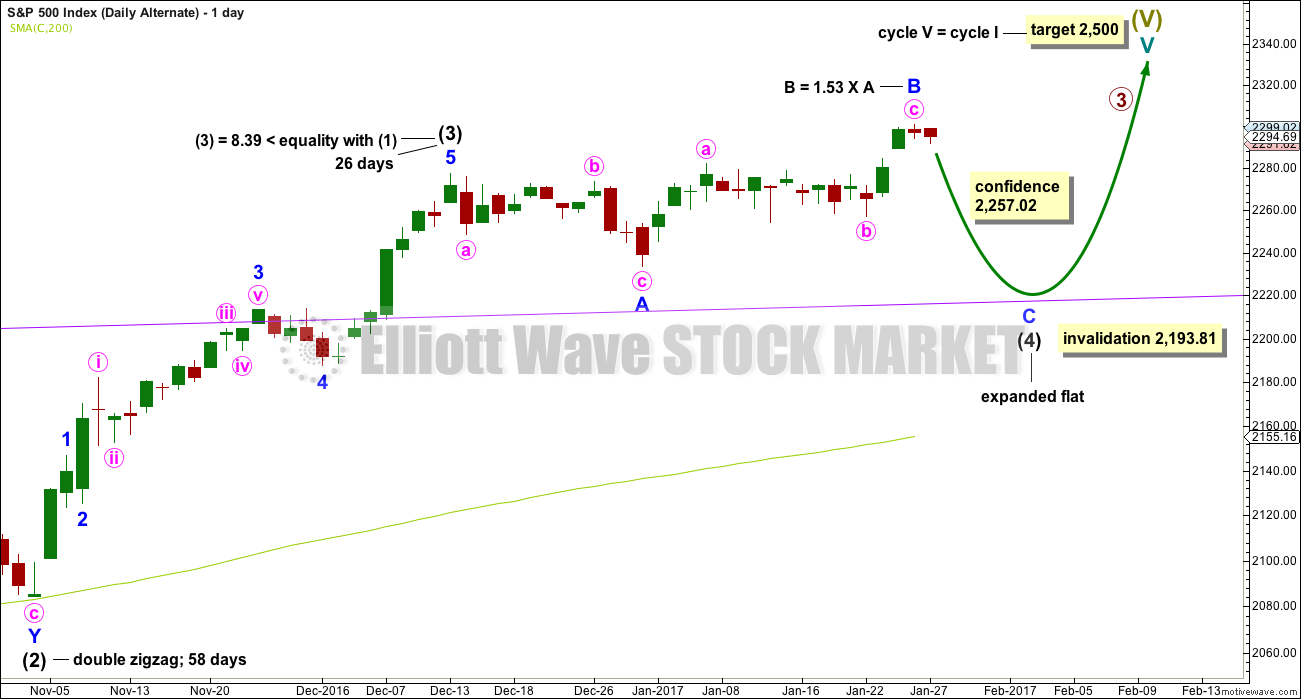
This was the main wave count until recently. With classic analysis now very bullish, it is now an alternate as it has less support.
It remains possible that intermediate wave (4) is an incomplete expanded flat correction. With On Balance Volume breaking below support on Friday, this alternate wave count has increased in probability. It illustrates the risk to entering long positions based upon the main wave count here.
So far intermediate wave (4) may have lasted 30 sessions. It may continue for another four to total a Fibonacci 34 days or sessions.
No target is given for minor wave C downwards because a target calculated using the Fibonacci ratio of 1.618 to minor wave A results in price falling short of the purple trend line. Minor wave C may end only when price comes down to touch the trend line again.
Minor wave B is now a 1.53 length to minor wave A. This is longer than the normal length of up to 1.38 but within the allowable convention of 2. The length of minor wave B has reduced the probability of this wave count.
Intermediate wave (4) may not move into intermediate wave (1) price territory below 2,193.81. It should find very strong support at the purple trend line and stop there.
TECHNICAL ANALYSIS
WEEKLY CHART
Click chart to enlarge. Chart courtesy of StockCharts.com.
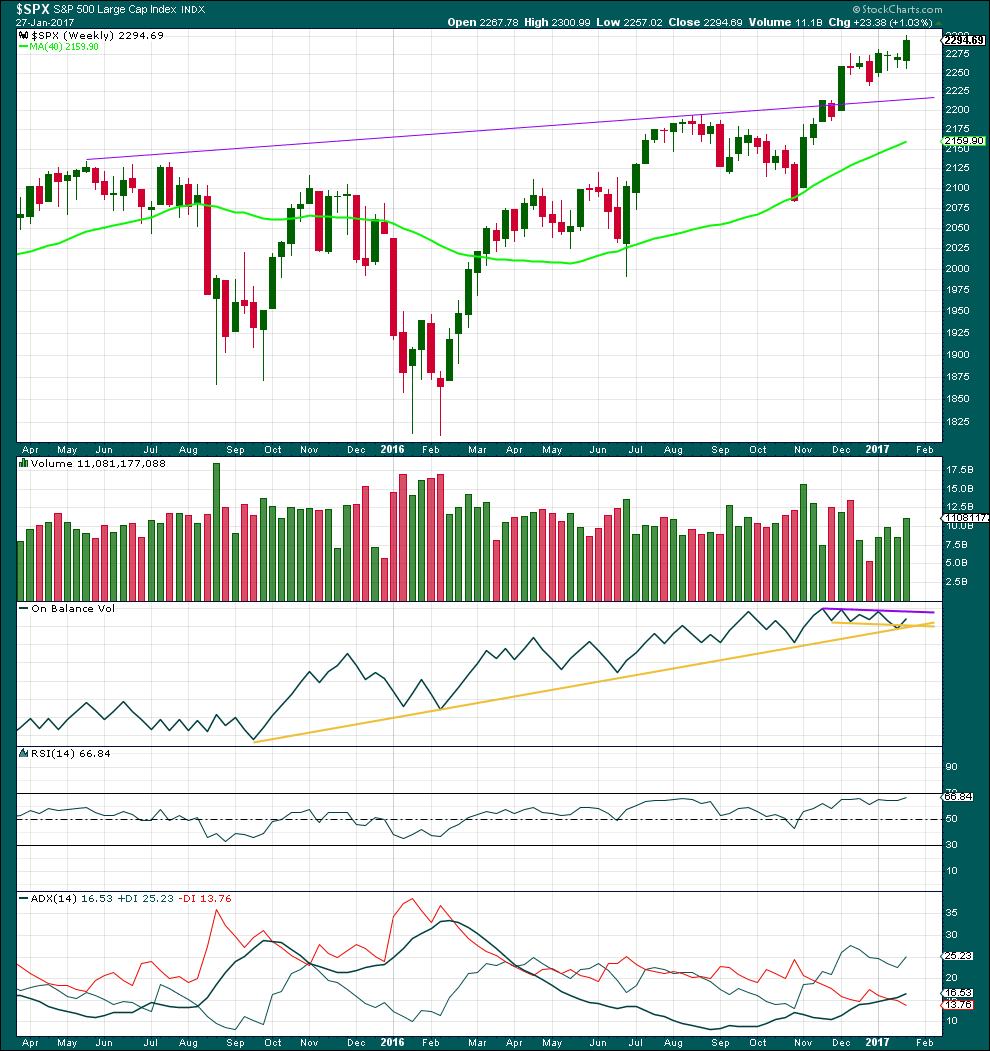
A strong upwards week comes with an increase in volume. The rise in price is supported by volume.
On Balance Volume has found support and moved up and away from the long yellow support line. This is a bullish signal. OBV has not yet reached resistance. It may find some resistance at the purple line.
RSI is not yet overbought and exhibits no divergence with price. There is room still for price to rise further.
ADX indicates the beginning of an upwards trend. This is not extreme. There is plenty of room for the trend to continue.
DAILY CHART
Click chart to enlarge. Chart courtesy of StockCharts.com.
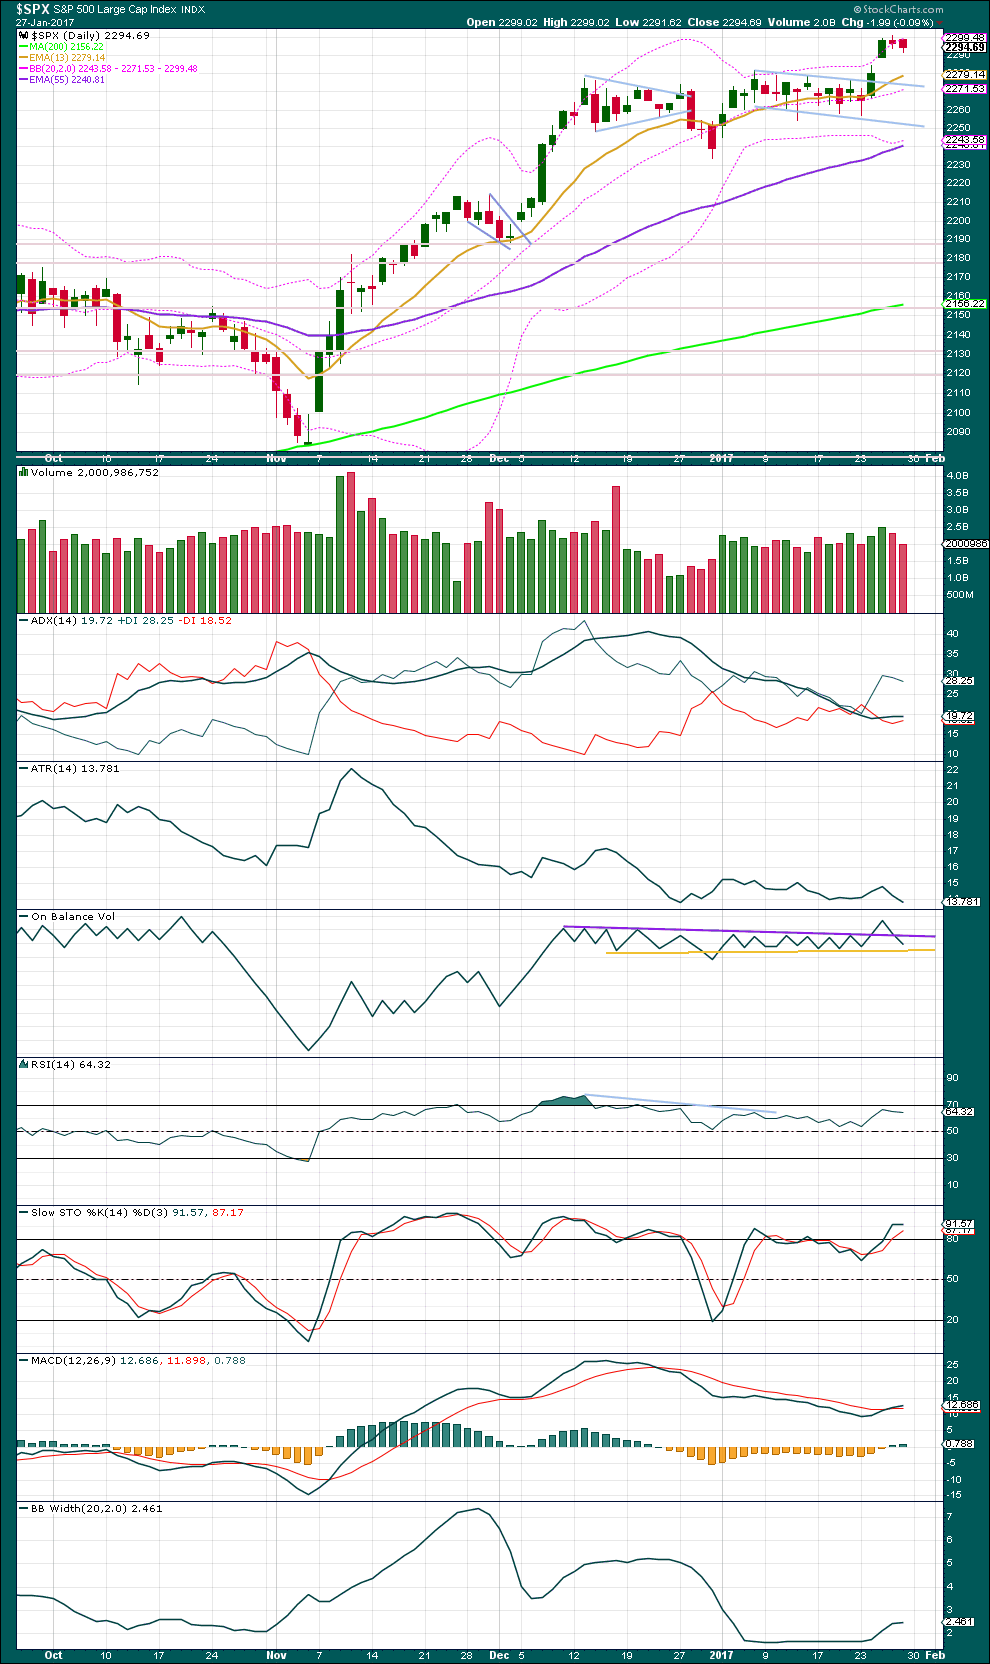
A bull flag pattern has completed and an upwards breakout closed above prior resistance. The flag pole is short, only 48.48 points, so a target using the measured rule would be about 2,323.
A downwards day for Friday comes with a decline in volume. The fall in price is not supported by volume. Volume suggests that downwards movement may end here or very soon short term.
The breakaway gap may now offer support. If any members hold long positions, this may be used to pull up stops. Or if entering a long position, the lower edge of the gap may provide a good point for a stop.
Price found resistance about the round number pivot at 2,300.
ADX today is increasing from yesterday and it is above 15. An upwards trend is indicated, which is not extreme, so there is room for this trend to continue for a reasonable distance.
ATR is now overall flat with a small range day today. ATR increased while price moved higher, so there is still some strength within this trend.
On Balance Volume gave a strong bullish signal with a break above the purple trend line. Now OBV has moved below the purple trend line, negating the strong bullish signal. The yellow line is close by and may offer some support. This may assist to halt the fall in price. If price moves lower early next week, it may not be by much.
There is still strong and long held divergence between price and RSI. This may disappear, but it does offer some support to the Elliott wave count which sees this upwards wave as a fifth wave. Fifth waves very commonly exhibit divergence as they end.
RSI is not yet overbought, so there is room still for price to rise further.
There is strong and long held divergence between price and Stochastics. This may persist for reasonable periods of time during a trending market.
MACD shows a bullish crossover.
Bollinger Bands continue to expand. Volatility may be returning to the market after the breakout. There is plenty of room for volatility to increase further.
Price closed close to the upper edge of Bollinger Bands today, but this does not necessarily mean that price must move lower tomorrow. The last upwards trend saw price close above the upper range of Bollinger Bands for three days in a row, but the end of that trend was still not seen for a following three days. Price can sit at the extreme of Bollinger Bands for several days when a trend is strong.
VOLATILITY – INVERTED VIX CHART
Click chart to enlarge. Chart courtesy of StockCharts.com.
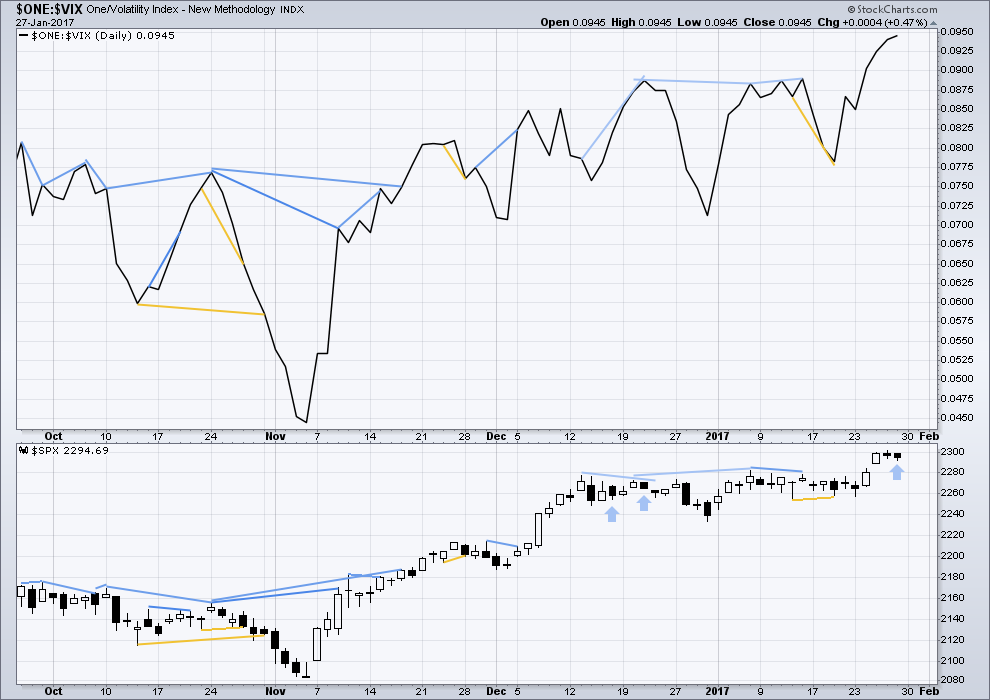
There are a few instances of multi day divergence between price and inverted VIX noted here. Bearish divergence is blue. Bullish divergence is yellow. It appears so far that divergence between inverted VIX and price is mostly working to indicate short term movements spanning one or two days. While this seems to be working more often than not, it is not always working. As with everything in technical analysis, there is nothing that is certain. This is an exercise in probability.
Price moved lower during Friday’s session and the balance of volume during the session was down. Normally, inverted VIX would also move lower indicating an increase in volatility as price declines. However, inverted VIX moved higher on Friday indicating a decline in volatility. The fall in price is not accompanied by a corresponding decline in volatility. This is abnormal.
The last two times this occurred are noted with blue arrows. It is noted that on those occasions divergence was followed overall by a further decline in price. Not immediately, but this was during a consolidation that ended lower.
That may happen again here. Normally, I would interpret this divergence as bullish, but it may actually be bearish considering recent behaviour.
BREADTH – AD LINE
Click chart to enlarge. Chart courtesy of StockCharts.com.
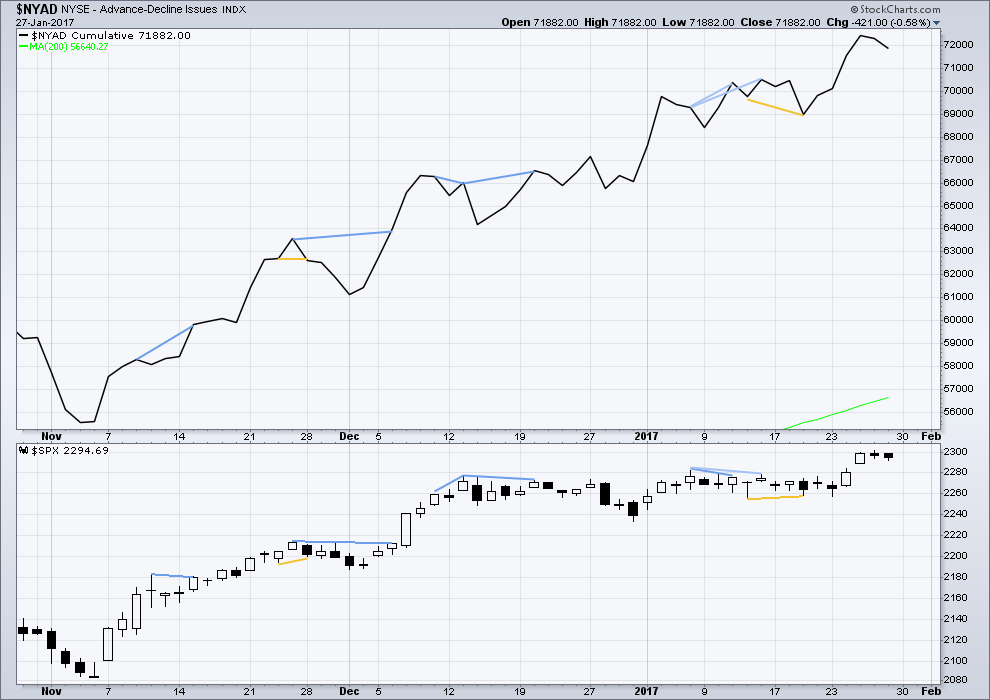
No new divergence at today’s new high is noted between price and the AD line.
The AD line moved lower for Friday. The fall in price was accompanied by a normal decline in market breadth.
DOW THEORY
The DJIA, DJT, S&P500 and Nasdaq have made new all time highs in December of 2016. This confirms a bull market continues.
This analysis is published @ 12:19 a.m. EST on 28th January, 2016.
[Note: Analysis is public today for promotional purposes. Member comments and discussion will remain private.]
Laura , your preferred analysis is to buy pullback . ” target is at 2,284. A new low below 2,257.02 would indicate a deeper pullback to the purple trend line ”
We decisively went thru 2284 – in fact gaped down to that area this AM , but have yet to break your 2257.02
Are you still looking to purchase these pullbacks ? looking to scale in starting here .
With the gap now filled that looks like a false breakout. The alternate may be swapped over to be the main wave count today, depending on what volume and indicators have to say when this session is over.
Here’s an hourly chart for the alternate. No target, use the purple trend line. That can be seen on daily and weekly charts.
I’ll be expecting downwards movement most likely at this stage to the end of this week. I’ll be looking for an entry to go long then.
Complacency more extreme than I have ever seen. Those filled gaps are signalling a larger correction underway. Either the C leg of Lara’s alternate, or some other form of a possible fourth wave correction. Peter Temple has discarded his ED for SPX because of the new ATH but now thinks we have a larger degree fourth in play after a completed third wave up. I am looking at a long trade with any VIX penetration of the upper BB. I am keeping in mind that sharp paper trade that expects a VIX visit to the twenty and possibly higher area. That means at the very least a 5% correction in the markets. It could be the prelude to the final blow-off top in a manic fifth and final wave to end this bankster fueled, and seemingly interminable saga. Could the end be closer than we think??!!
I really do hope the end is closer than we think. But at this stage I’m expecting October.
Cesar has subscribed to some cycle analysis which looks pretty good, but that guy’s prediction of a big change in April / May does look overly optimistic with my Elliott wave count and with what Lowry’s are seeing.
Just for kicks Verne, as I’m a CMT I get EWI’s research and you gotta give Steve credit for his consistency, calling for another move higher, but would no longer call for a move higher if 19900 is broken. Shockingly noncommittal analysis that is getting less and less accurate. Now, to your point, it should be a larger degree 4th wave down to the maximum allowable downside that Ms. Yellen et all ordains.
🙂 Wouldn’t be surprised to see a rate raise just to mess with D. Trump.
Point well taken Chris. Steve did indeed nail that move up out of the fourth wave from what he dubbed an “imperfect triangle”. I also think he is right in calling for at more highs before the bull retires, as does Lara’s count. A lot of analysts were expecting a big move from that long consolidation process. giving a 50% chance of a move down, and to be honest, I thought we would see a move down to the purple line and remained long (a bit painfully! 🙂 ) volatility before getting stopped out with the manic move higher. This move down should at the very least test that break-out area and could even prove to be a false break-out, with a larger correction now underway. Ike predicted that whatever the initial break was would then be reversed and it looks as if he was right on that score with the island reversal we saw. I am still surprised at Mr Market’s accommodation of all the remarkable bullishness with the relentless move higher we have seen the past many weeks. He usually manages to buck off a few bull riders ahead of a more sustained romp higher….he still might. So far as Yellen and company is concerned, the market be becoming sufficiently top heavy as to be little swayed by FED largesse. Market declines the last several cycles have proceeded with a remarkable absence of any selling pressure what-soever. A market that begins to decline on its own weight poses a interesting scenario when its decline is unable to be halted by short covering and must depend on additional FED leveraged buying. Everyone is decidedly bullish….even me! 🙂
Agreed, let me know when you short volatility and I’ll sell the rest of my longs ;$) and by the looks of the COT reports there are no more shorts left of the non-commercial side
If today’s gap lower on the SPX holds, we will have a 3-day island reversal top. However, Bullkowski writes this pattern is dead last in reliability (23rd out of 23):
“Overall performance rank for up/down breakouts (1 is best): 23 out of 23; 21 out of 21
Break even failure rate for up/down breakouts: 18%; 17%
Average rise/decline: 23%; 17%
Throwback/pullback rate: 70%; 65%
Percentage meeting price target for up/down breakouts: 69%; 62%”
Hi Lara. Thanks for the excellent analysis and commentary. Appreciated.
Yesterday you were wondering why there seemed to be an absence of comments on the blog. I cannot speak for others, of course, but I was watching and waiting. I have been disinclined to take a long position. First of all, during the last two consolidations (the current one and the one at the beginning of Dec.) your main count was looking for much deeper corrections. In Dec. it did not materialize and we are waiting for a possible deeper correction now. This always makes me hesitant. In fact I was long up to a week or so ago. With the main count confidently calling for a decline to the purple trend line, I chose to close those positions. As a result, I have not been willing to take on another long position as the market moves higher. Thus, I am just watching.
In addition, I am looking at another possible count which would put us near a correction of one degree higher. Below is a count I have been watching. I have what you label as Intermediate (3) as yet incomplete. Also, the channel I have drawn with the brown trendlines indicates we are near the top of the channel. I’d much rather open a long position closer to the lower channel line or even midway between the two.
Bottom line, at the moment I am looking and waiting for a correction toward 2200-2220 on the SPX before I take a long position. Of course, I will continue to consider all opportunities to go long as they are presented. Right now, I am hesitant.
I am open to any comment on my chart. Thanks again.
Based upon this morning’s open (closed the gap 2284 to 2288, and a fall below 2282) I would adjust the labeling on my chart above to v of 3 complete. Looking for wave 4 to move to 2250 to 2220 . Thereabouts I will go 100% long.
I am traveling most of the day today. I’ll be back this evening. Have a great day.