
Upwards movement continues, which fits the larger picture of the main Elliott wave count.
In looking for an entry to join the trend classic technical analysis, particularly On Balance Volume, may be useful.
Summary: Price has broken out upwards from a flag pattern. A target using the measured rule is 2,323 and an Elliott wave target is 2,382. A small pullback today may present an opportunity to join the trend. On Balance Volume is at strong support and may halt the fall in price here. If entering long, accept the risk that price may move a little lower tomorrow towards 2,284 but not below 2,257.02. Always use a stop and do not invest more than 1-5% of equity on any one trade.
New updates to this analysis are in bold.
Last monthly and weekly charts are here. Last historic analysis video is here.
MAIN ELLIOTT WAVE COUNT
WEEKLY CHART
Click chart to enlarge.
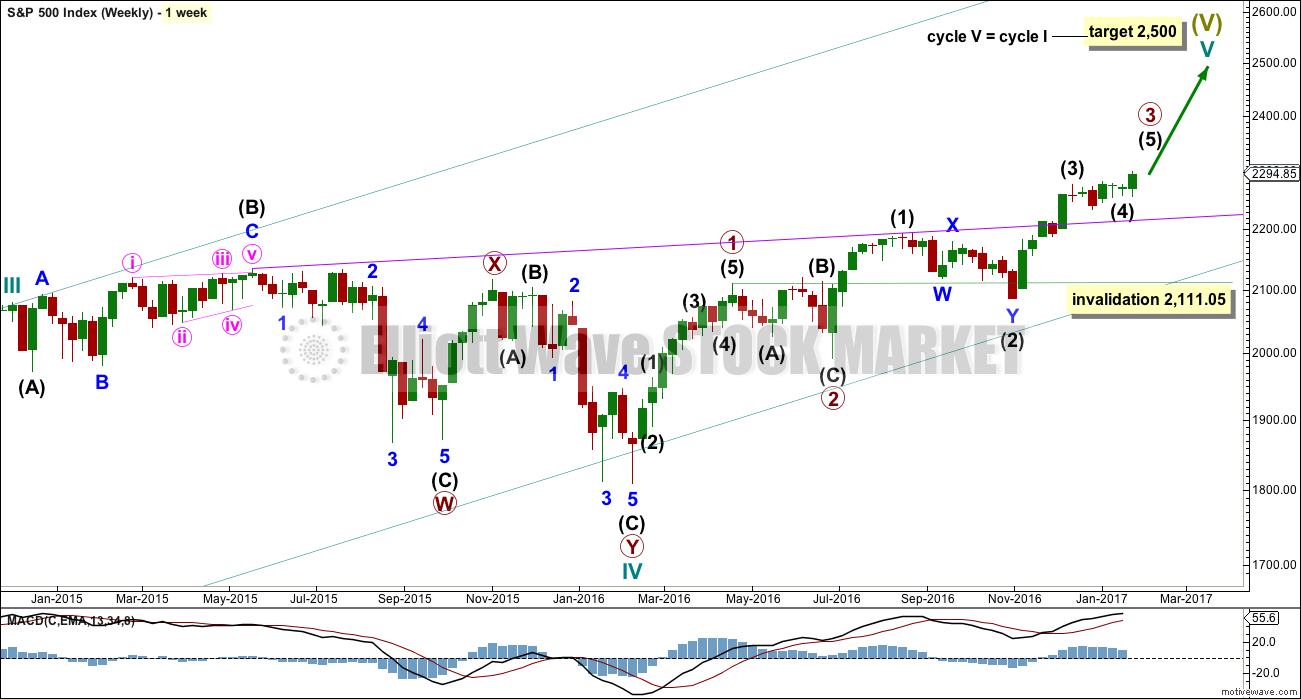
Cycle wave V is an incomplete structure. Within cycle wave V, primary wave 3 may be relatively close to completion.
When primary wave 3 is complete, then the following correction for primary wave 4 may not move into primary wave 1 price territory below 2,111.05.
Primary wave 2 was a flat correction lasting 47 days (not a Fibonacci number). Primary wave 4 may be expected to most likely be a zigzag, but it may also be a triangle if its structure exhibits alternation. If it is a zigzag, it may be more brief than primary wave 2, so a Fibonacci 21 sessions may be the initial expectation. If it is a triangle, then it may be a Fibonacci 34 or 55 sessions.
Primary wave 3 at this stage though is incomplete and may continue to move price higher.
DAILY CHART
Click chart to enlarge.
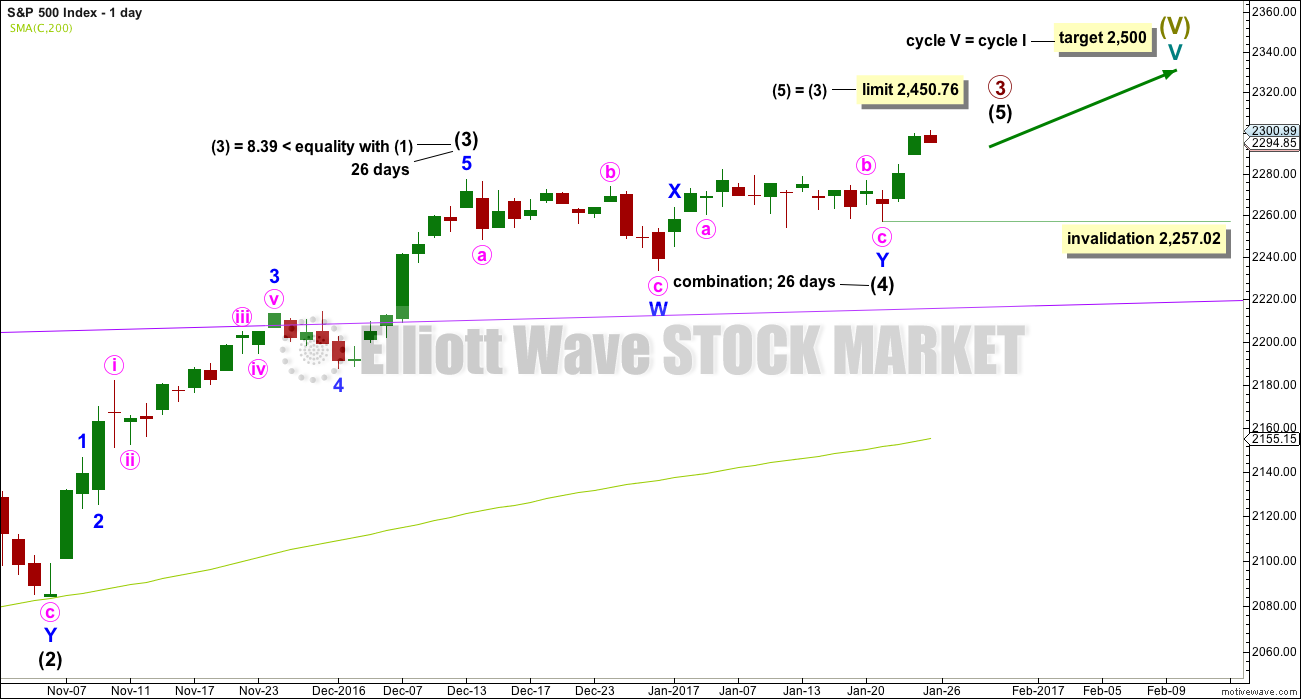
It is possible that intermediate wave (4) is a complete combination: zigzag – X – flat. It would have been even in duration with intermediate wave (3), both lasting 26 days.
Intermediate wave (3) is shorter than intermediate wave (1). One of the core Elliott wave rules states a third wave may never be the shortest wave, so this limits intermediate wave (5) to no longer than equality in length with intermediate wave (3) at 2,450.76.
Within intermediate wave (5), no second wave correction may move beyond its start below 2,257.02.
Intermediate wave (5) has so far lasted just three days. It may be expected to be shorter both in length and duration compared to intermediate wave (3). At this stage, an expectation of a Fibonacci 13 days total for intermediate wave (5) looks reasonable, so it may now continue for another 10 days or sessions.
The proportion here between intermediate waves (2) and (4) is acceptable. There is alternation. Both are labelled W-X-Y, but double zigzags are quite different structures to double combinations.
HOURLY CHART
Click chart to enlarge.
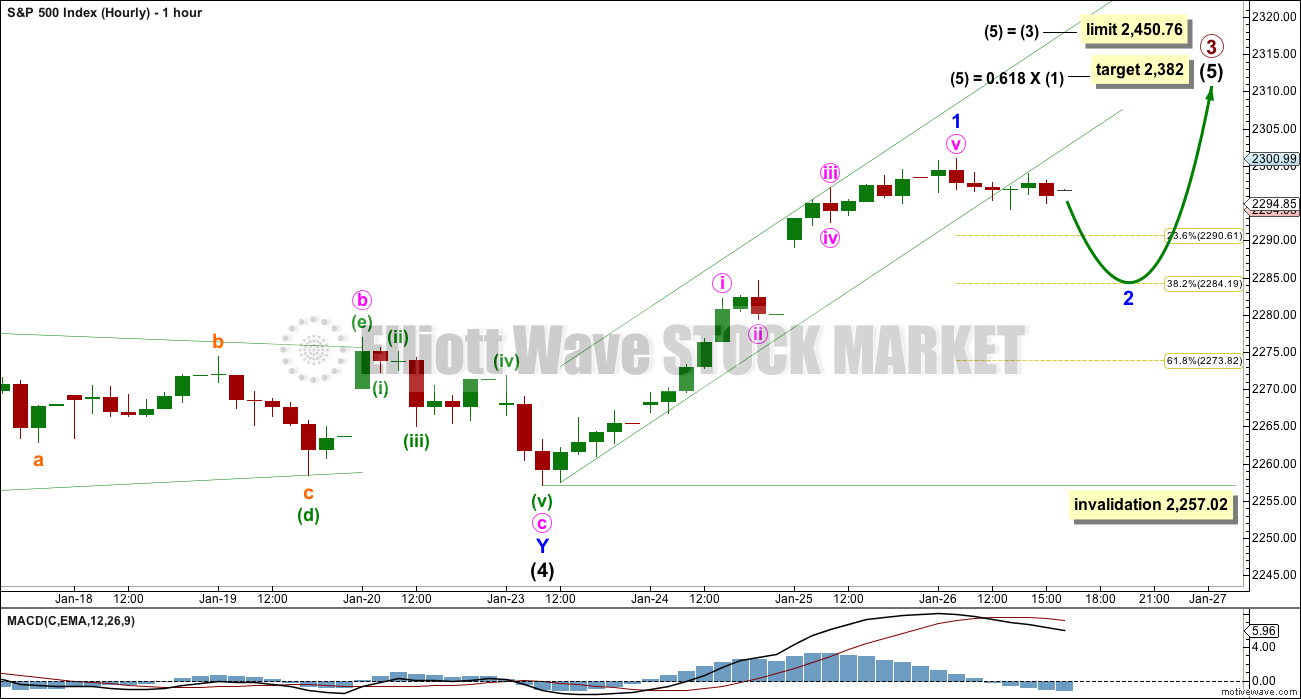
Intermediate wave (5) must subdivide as a five wave structure, either an impulse or an ending diagonal. At this stage, it is not possible to eliminate either option.
Within intermediate wave (5), minor wave 1 may be complete and minor wave 2 may have begun today.
Minor wave 2 may be relatively brief and shallow. This was the pattern within the last upwards wave of intermediate wave (3) (from the 4th November, 2016, to the 13th December, 2016, seen on the daily chart). There, minor wave 2 was just 0.34 of minor wave 1 and was over within one session. Look out for this tendency again.
Within intermediate wave (3), the longest duration for a correction was four days for minor wave 4.
Within intermediate wave (1), minor wave 2 was brief lasting only two days. It was also shallow at only 0.30 of minor wave 1.
This does not mean that minor wave 2 within intermediate wave (5) must also be brief and shallow, only that the balance of probability points to this.
The preferred target for minor wave 2 tomorrow will be about 2,284. It may either be over quickly within the session, or it may print a red daily candlestick or doji.
It is also possible that that minor wave 2 is over at today’s low. Strong support today from On Balance Volume suggest this is likely.
ALTERNATE ELLIOTT WAVE COUNT
DAILY CHART
Click chart to enlarge.
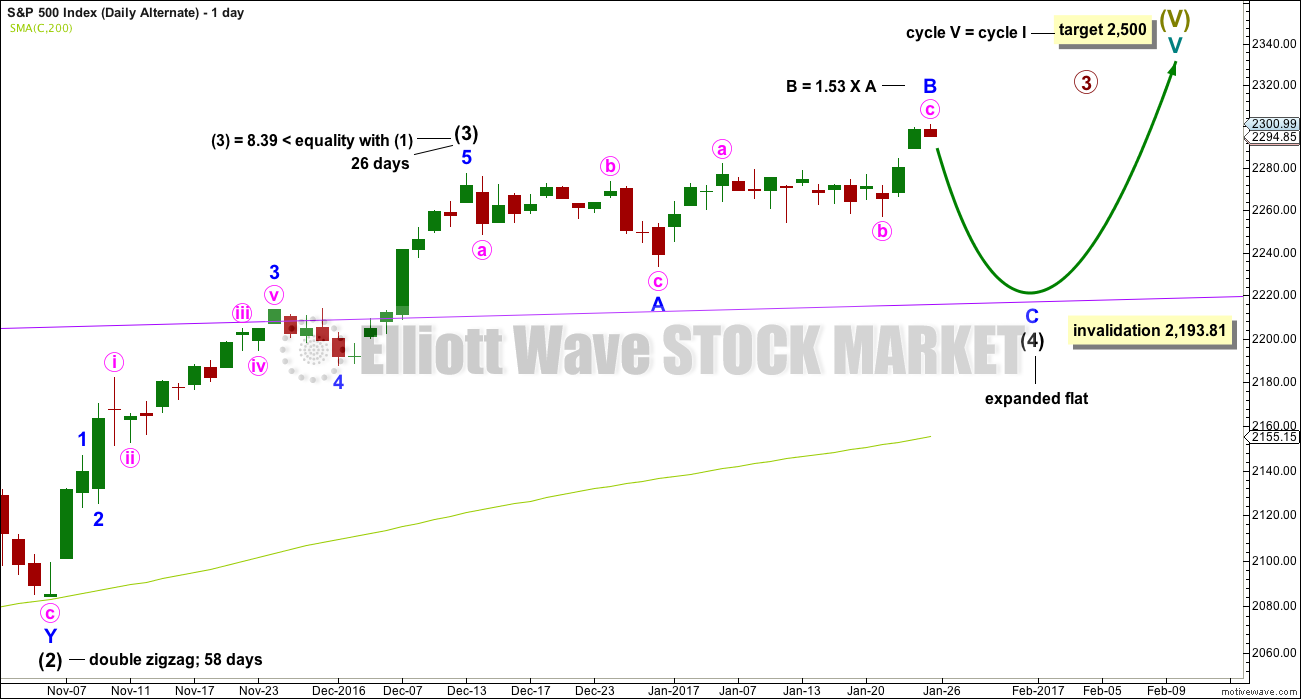
This was the main wave count until recently. With classic analysis now very bullish, it is now an alternate as it has less support.
It remains possible that intermediate wave (4) is an incomplete expanded flat correction. If On Balance Volume breaks below support tomorrow, then this may be the main wave count again.
So far intermediate wave (4) may have lasted 29 sessions. It may continue for another five to total a Fibonacci 34 days or sessions.
No target is given for minor wave C downwards because a target calculated using the Fibonacci ratio of 1.618 to minor wave A results in price falling short of the purple trend line. Minor wave C may end only when price comes down to touch the trend line again.
Minor wave B is now a 1.53 length to minor wave A. This is longer than the normal length of up to 1.38 but within the allowable convention of 2. The length of minor wave B has reduced the probability of this wave count.
Intermediate wave (4) may not move into intermediate wave (1) price territory below 2,193.81. It should find very strong support at the purple trend line and stop there.
TECHNICAL ANALYSIS
WEEKLY CHART
Click chart to enlarge. Chart courtesy of StockCharts.com.
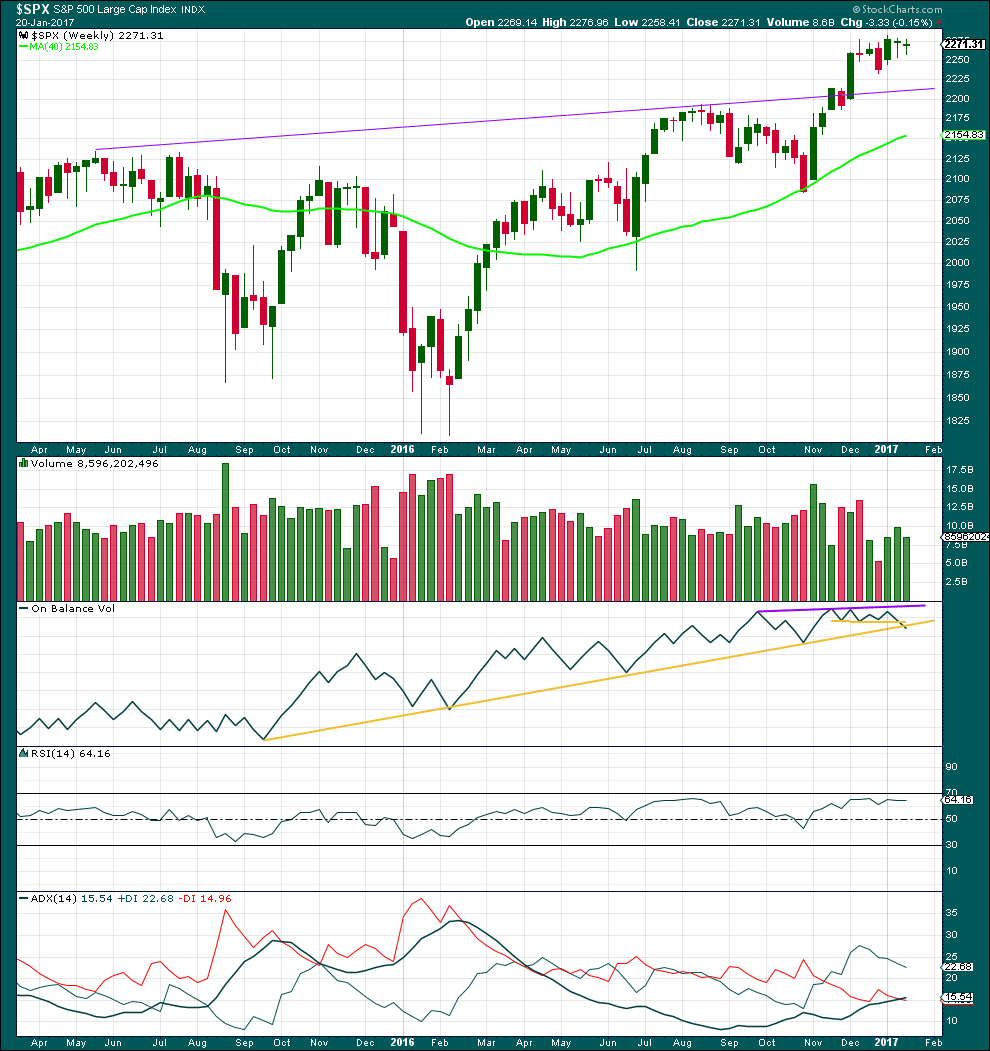
A very small range inside week completes a small green doji candlestick. Price is consolidating.
A decline in volume last week supports the idea that price is consolidating. This supports the main Elliott wave count that sees a correction unfolding for intermediate wave (4).
On Balance Volume last week has come down to the long held yellow support line. This line goes back to September 2015 and it has been tested four times so far. This would be the fifth test. This line has good technical significance. It looks like OBV may be breaking below this line, but there is a little leeway in exactly how this line is drawn, so a clearer break is required before it may be read as a bearish signal.
A break below the long yellow support line by OBV would be a good bearish signal supporting the main Elliott wave count.
RSI is not extreme. There is room for the upwards trend to continue.
ADX is still increasing and is above 15 indicating the market may be in the early stages of an upwards trend.
DAILY CHART
Click chart to enlarge. Chart courtesy of StockCharts.com.
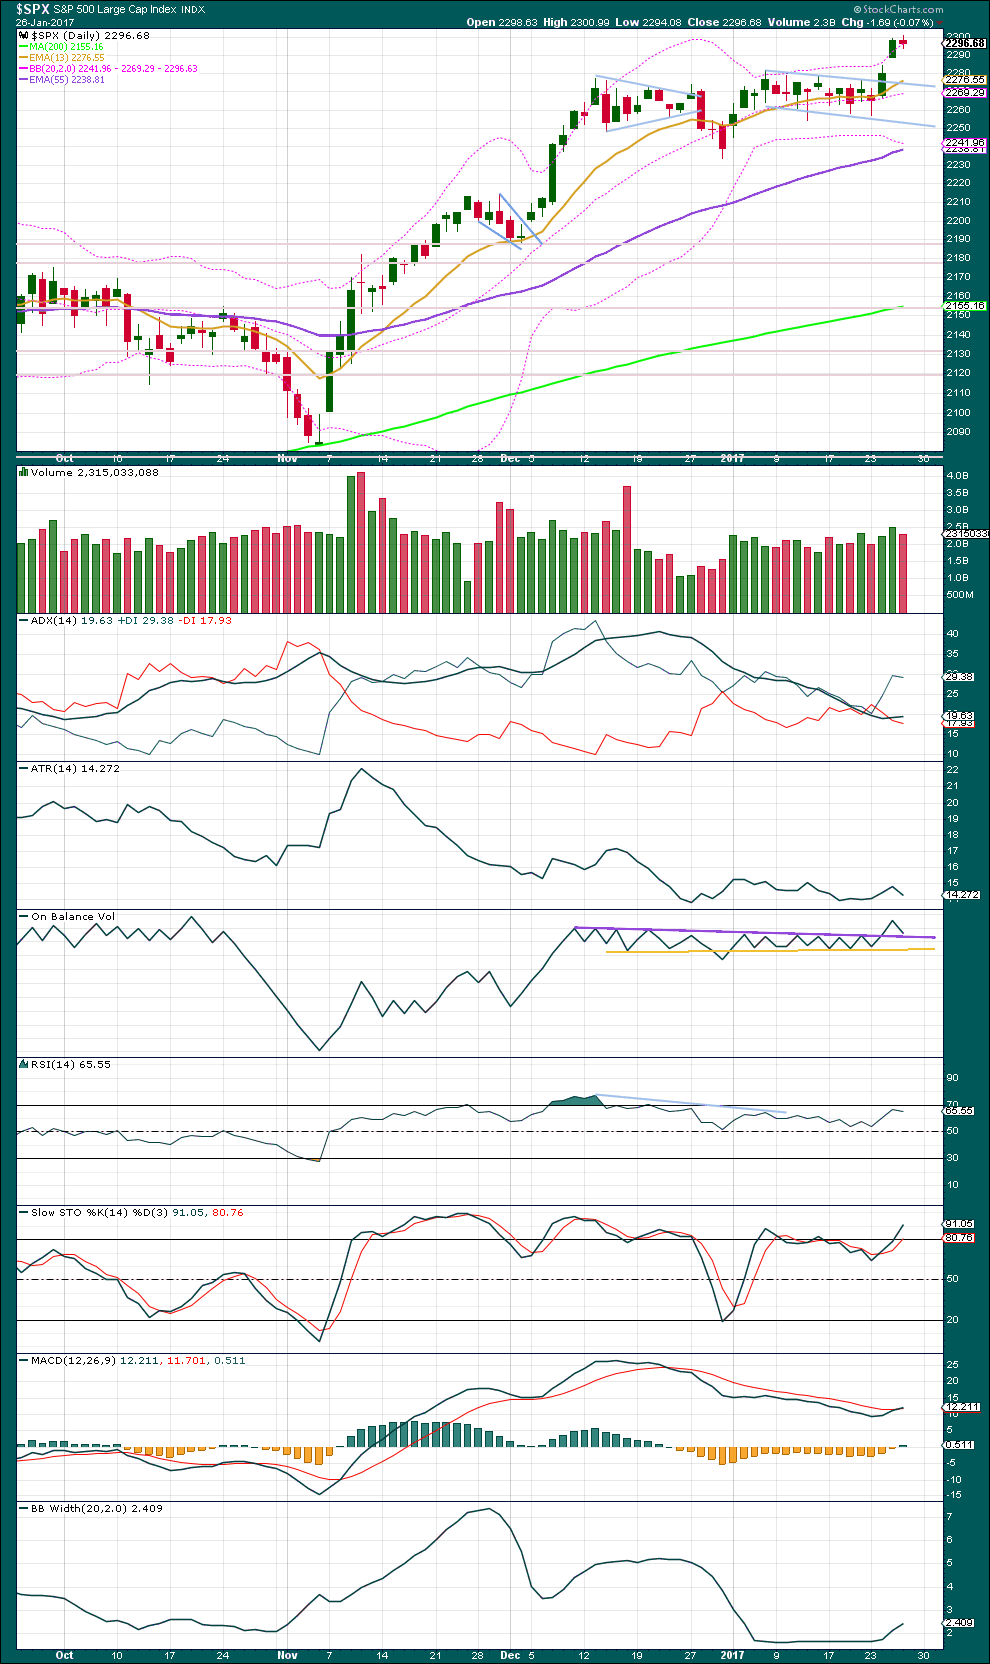
A bull flag pattern has completed and an upwards breakout closed above prior resistance. The flag pole is short, only 48.48 points, so a target using the measured rule would be about 2,323.
Price moved higher today with a higher high and a higher low, but the candlestick closed red. Within the session, price moved mostly lower and the balance of volume indicates more support for downwards than upwards movement today. With lighter volume for downwards movement, the fall in price was not supported by volume compared to yesterday’s support for a rise in price. The market today fell mostly of its own weight. This suggests upwards movement tomorrow.
The breakaway gap may now offer support. If any members hold long positions, this may be used to pull up stops. Or if entering a long position, the lower edge of the gap may provide a good point for a stop.
Price found resistance about the round number pivot at 2,300.
ADX today is increasing from yesterday and it is above 15. An upwards trend is indicated, which is not extreme, so there is room for this trend to continue for a reasonable distance.
ATR is now overall flat with a small range day today. ATR increased while price moved higher, so there is still some strength within this trend.
On Balance Volume gave a strong bullish signal with a break above the purple trend line. Now it has come back down to this line with a back test of support. This line is almost horizontal, long held, and repeatedly tested, so it offers strong technical significance. The first expectation should be for it to hold. This may halt the fall in price here and initiate the next upwards wave to new highs.
There is still strong and long held divergence between price and RSI at today’s new high. This may disappear, but it does offer some support to the Elliott wave count which sees this upwards wave as a fifth wave. Fifth waves very commonly exhibit divergence as they end.
RSI is not yet overbought, so there is room still for price to rise further.
There is strong and long held divergence between price and Stochastics. This may persist for reasonable periods of time during a trending market.
MACD today shows a bullish crossover.
Bollinger Bands continue to expand. Volatility may be returning to the market after the breakout. There is plenty of room for volatility to increase further.
Price closed close to the upper edge of Bollinger Bands today, but this does not necessarily mean that price must move lower tomorrow. The last upwards trend saw price close above the upper range of Bollinger Bands for three days in a row, but the end of that trend was still not seen for a following three days. Price can sit at the extreme of Bollinger Bands for several days when a trend is strong.
VOLATILITY – INVERTED VIX CHART
Click chart to enlarge. Chart courtesy of StockCharts.com.
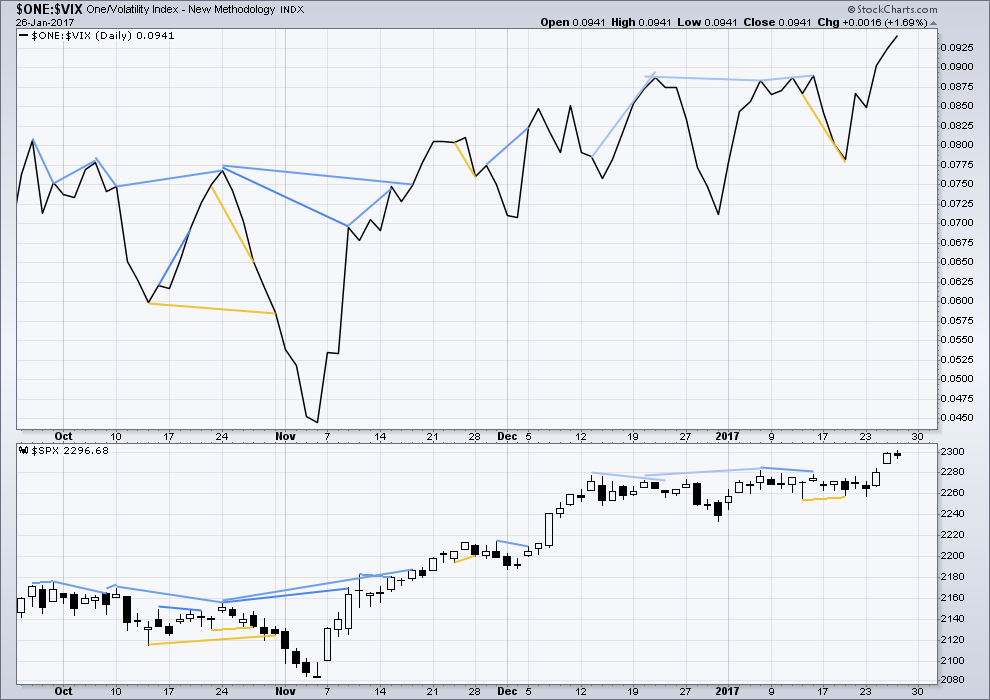
There are a few instances of multi day divergence between price and inverted VIX noted here. Bearish divergence is blue. Bullish divergence is yellow. It appears so far that divergence between inverted VIX and price is mostly working to indicate short term movements spanning one or two days. While this seems to be working more often than not, it is not always working. As with everything in technical analysis, there is nothing that is certain. This is an exercise in probability.
Price moved upwards today and volatility declined, which is normal. However, during today’s session, price moved lower within the session to close below the open and the balance of volume favoured downwards movement. This may be interpreted as some small single day divergence with inverted VIX. The fall in price during the session was not accompanied by a corresponding increase in volatility, so it may be followed by upwards movement tomorrow.
BREADTH – AD LINE
Click chart to enlarge. Chart courtesy of StockCharts.com.
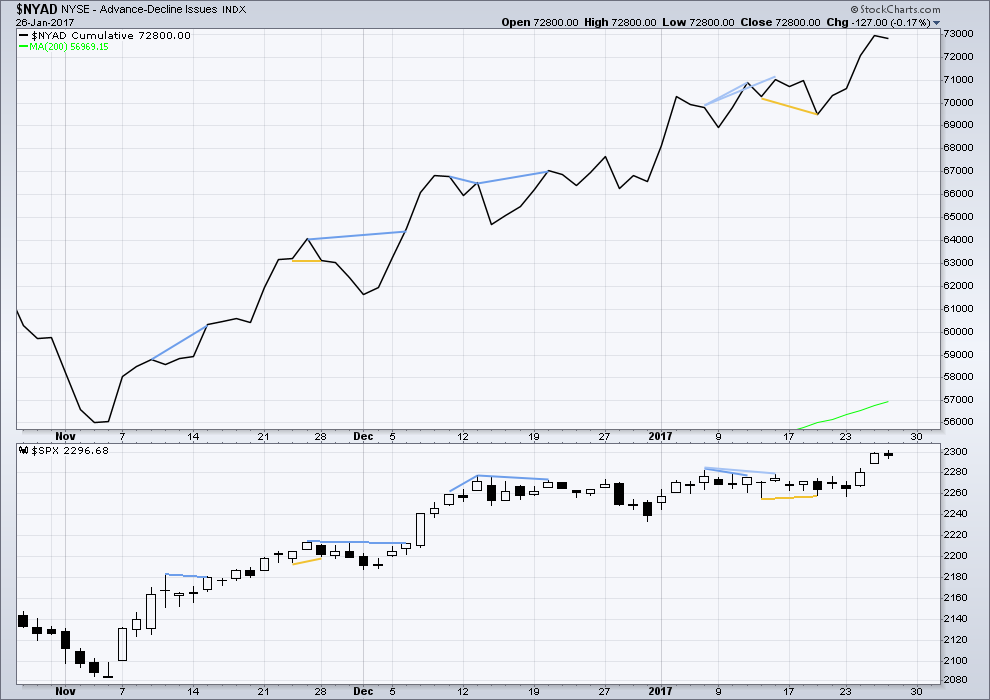
No new divergence at today’s new high is noted between price and the AD line.
Price moved higher today, but during the session price moved downwards to close below the open. The balance of volume during the session was downwards. The AD line declined; during this session, there was a decline in market breadth to support the decline in price.
DOW THEORY
The DJIA, DJT, S&P500 and Nasdaq have made new all time highs in December of 2016. This confirms a bull market continues.
This analysis is published @ 09:32 p.m. EST.
Bears Vanish From S&P 500 Options as Put-Call Ratio Baffles Pros
• Traders are using calls more than any time since 2009
• Average short interest in U.S. stocks at lowest since 2014
https://www.bloomberg.com/news/articles/2017-01-27/bears-vanish-from-s-p-500-options-as-put-call-ratio-baffles-pros
The ratio (daily) was even lower in March 2000. That was the end of a long running bull market and the start of the Dotcom crash. In that instance it could have been read as very bearish.
You can see that right on the left hand side of the chart (the one in the article, not the one you’ve posted here David). Yet the article doesn’t make any mention of what the situation was when the ratio was that low in 2000, nor what happened then. IMO that is not being very honest, and so not really very useful.
I have taken time to look back over this ratio and I don’t see a pattern. So my conclusion to date has been to not give it any weight.
Furthermore, the data in this Bloomberg article appears to be quite different to the put / call ratio that StockCharts have. I know there are many different ways to calculate it.
I’d rather look at the trend of the ratio in comparison to the trend for price than trying to use the raw ratio as a bullish or bearish indicator.
Thanks Lara, I appreciate your input and insight. I don’t know where their data came from but definitely trust Stockcharts. After reading your points I must conclude Bloomberg was way off the mark. Thanks again for the guidance.
Where is everybody? This market now looks like it’s offering an opportunity for us to jump in and join this trend.
The trend is up.
Minor 2 may now be over. I know it looks brief and shallow, but that is the pattern for this market. Especially when the impulse one degree higher is not extending, and in this case remember intermediate (5) may not extend. It can’t be longer than intermediate (3).
My concern this morning is On Balance Volume. If it’s broken below that purple line that would be a bearish signal, and a fairly strong one. If that happens then minor wave 2 may turn out to be deeper and more time consuming.
I’ll know after the session is closed and I have StockCharts data.
For now, this is my updated hourly wave count for you all.
Have a good and relaxing weekend everyone 🙂