
Upwards movement has invalidated the main hourly Elliott wave count and confirmed an alternate.
Summary: It is slightly more likely today that price has broken out upwards from a flag pattern. A target using the measured rule is 2,323 and an Elliott wave target is 2,382. If On Balance Volume can break above resistance tomorrow, then confidence may be had in these targets. A new low below 2,257.02 would indicate a deeper pullback to the purple trend line.
New updates to this analysis are in bold.
Last monthly and weekly charts are here. Last historic analysis video is here.
MAIN ELLIOTT WAVE COUNT
DAILY CHART
Click chart to enlarge.
This first wave count is close to even in probability with the second wave count below. I would judge this first wave count to be about 45% likely with the second count below about 51% likely. The remaining 4% is the possibility that both are wrong, but with these two wave counts covering both directions of up and down they should suffice for trading purposes.
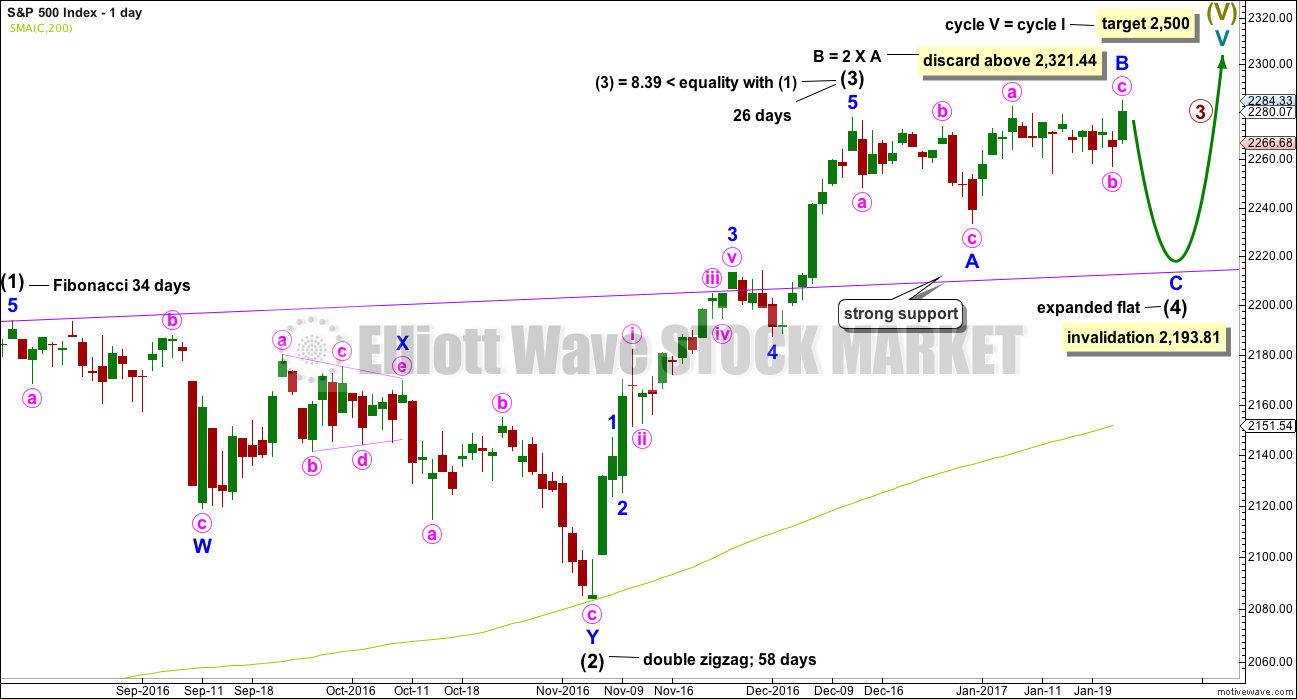
Intermediate wave (4) is exhibiting alternation with intermediate wave (2). Intermediate wave (2) is a double zigzag and intermediate wave (4) is an incomplete expanded flat.
Along the way up to the final target at 2,500 a more time consuming fourth wave correction for primary wave 4 would be expected for this wave count.
The purple trend line is the most important piece of technical analysis on all charts. Draw it carefully from prior all time highs of 2,134.28 on the 21st of May, 2015, to 2,193.81 on the 15th of August, 2016. Extend it out. Daily charts are on a semi log scale.
The correction for intermediate wave (4) should end if price comes down to touch the purple trend line.
Intermediate wave (4) may not move into intermediate wave (1) price territory below 2,193.81.
At this stage, intermediate wave (4) has lasted 27 sessions. With the very slow rate of this correction it may now be possible for it to continue for another 7 sessions to total a Fibonacci 34. This would see it end on the 2nd of February.
Expanded flats are very common structures. This would allow intermediate wave (4) to exhibit alternation with the double zigzag of intermediate wave (2).
When minor wave B is twice the length of minor wave A at 2,321.44, then the idea of a flat correction for intermediate wave (4) should be discarded based upon a very low probability. This idea may be discarded before that price point is reached if classic technical analysis indicates it is highly unlikely.
HOURLY CHART
Click chart to enlarge.
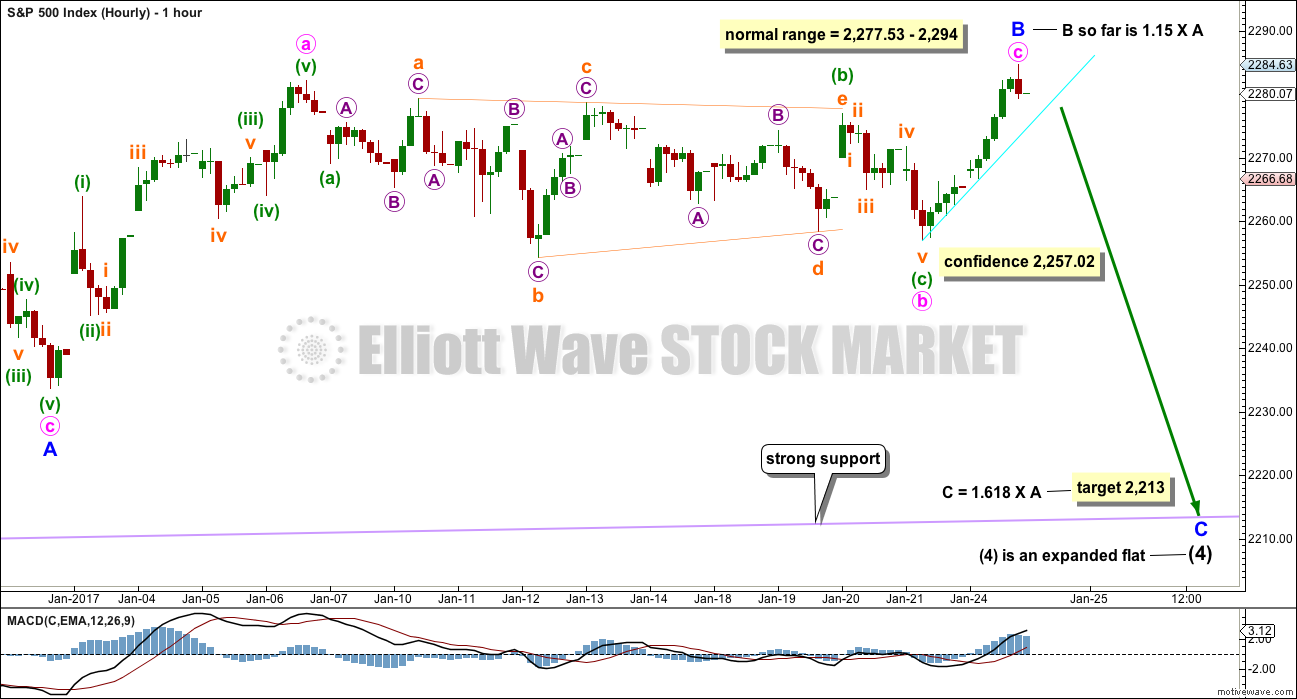
Minor wave B may be a zigzag that may be complete or may continue higher.
The target for minor wave C assumes the most likely Fibonacci ratio to minor wave A, and would see price come down to sit almost exactly on the purple trend line.
Minor wave B is today seen as a zigzag. So far it is a 1.15 length of minor wave A, so it remains within the normal range of 1 to 1.38 times the length of minor wave A.
If price makes a new low below 2,257.02, the second wave count below would be invalidated and some confidence may be had in this first wave count.
SECOND ELLIOTT WAVE COUNT
DAILY CHART
Click chart to enlarge.
This second wave count today is judged to be slightly more likely, about 51%. If tomorrow continues higher, and if On Balance Volume breaks above resistance, then this wave count will be the only wave count.
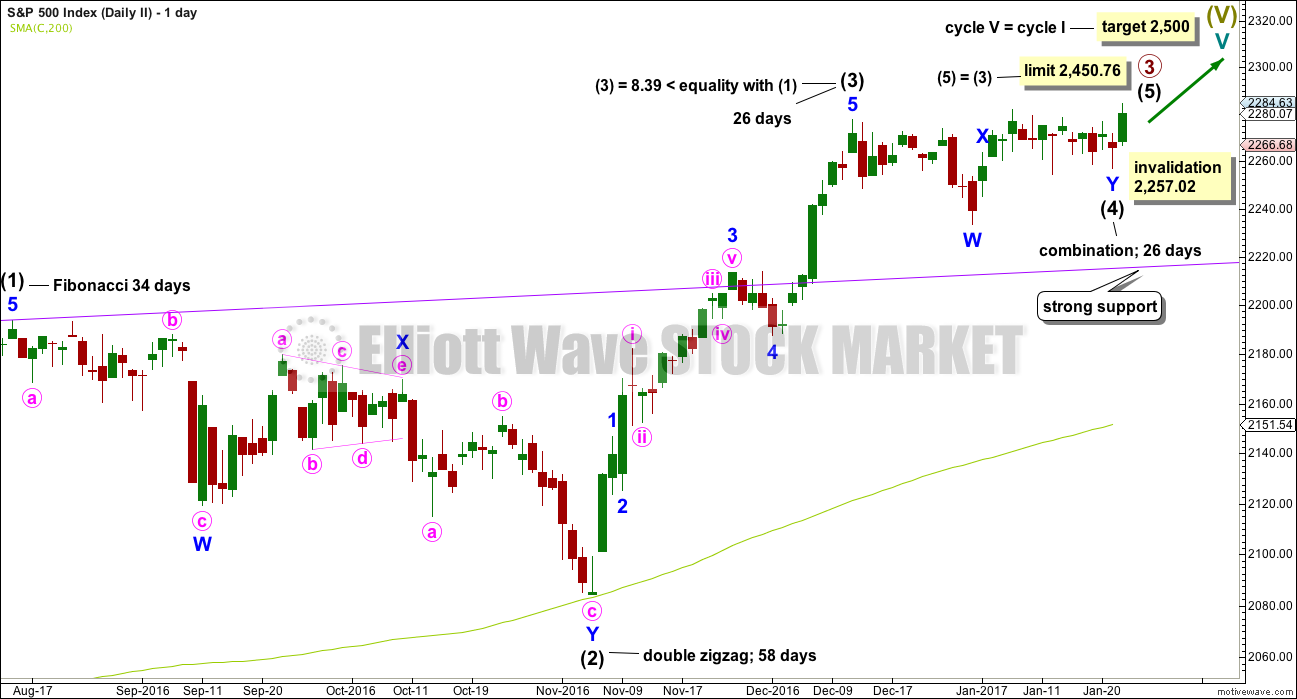
It is possible that intermediate wave (4) is a complete combination: zigzag – X – flat. If it is over here, it would have been even in duration with intermediate wave (3), both lasting 26 days.
Intermediate wave (3) is shorter than intermediate wave (1). One of the core Elliott wave rules states a third wave may never be the shortest wave, so this limits intermediate wave (5) to no longer than equality in length with intermediate wave (3) at 2,450.76.
Within intermediate wave (5), no second wave correction may move beyond its start below 2,257.02.
The proportion here between intermediate waves (2) and (4) is acceptable. There is alternation. Both are labelled W-X-Y, but double zigzags are quite different structures to double combinations.
I have considered a triangle for intermediate wave (4). It will fit and meet all Elliott wave rules, but I have discarded the idea based upon a very low probability due to the triangle not sitting within its trend lines. The idea does not have the right look.
HOURLY CHART

Click chart to enlarge.
If intermediate wave (4) is over as a double combination, then intermediate wave (5) has begun. The target for intermediate wave (5) assumes it should end before it reaches its limit.
Targets for minor wave 2 tomorrow would be the 0.382 and 0.618 Fibonacci ratios of minor wave 1, with the 0.618 Fibonacci ratio slightly favoured as this would be a second wave correction.
Intermediate wave (5) must subdivide as a five wave structure. It may be either an impulse or an ending diagonal. If it is an ending diagonal, then it would most likely be of the contracting variety. The classic technical analysis equivalent pattern is a rising wedge.
A Fibonacci 13 or 21 days duration would be the first expectation.
TECHNICAL ANALYSIS
WEEKLY CHART
Click chart to enlarge. Chart courtesy of StockCharts.com.
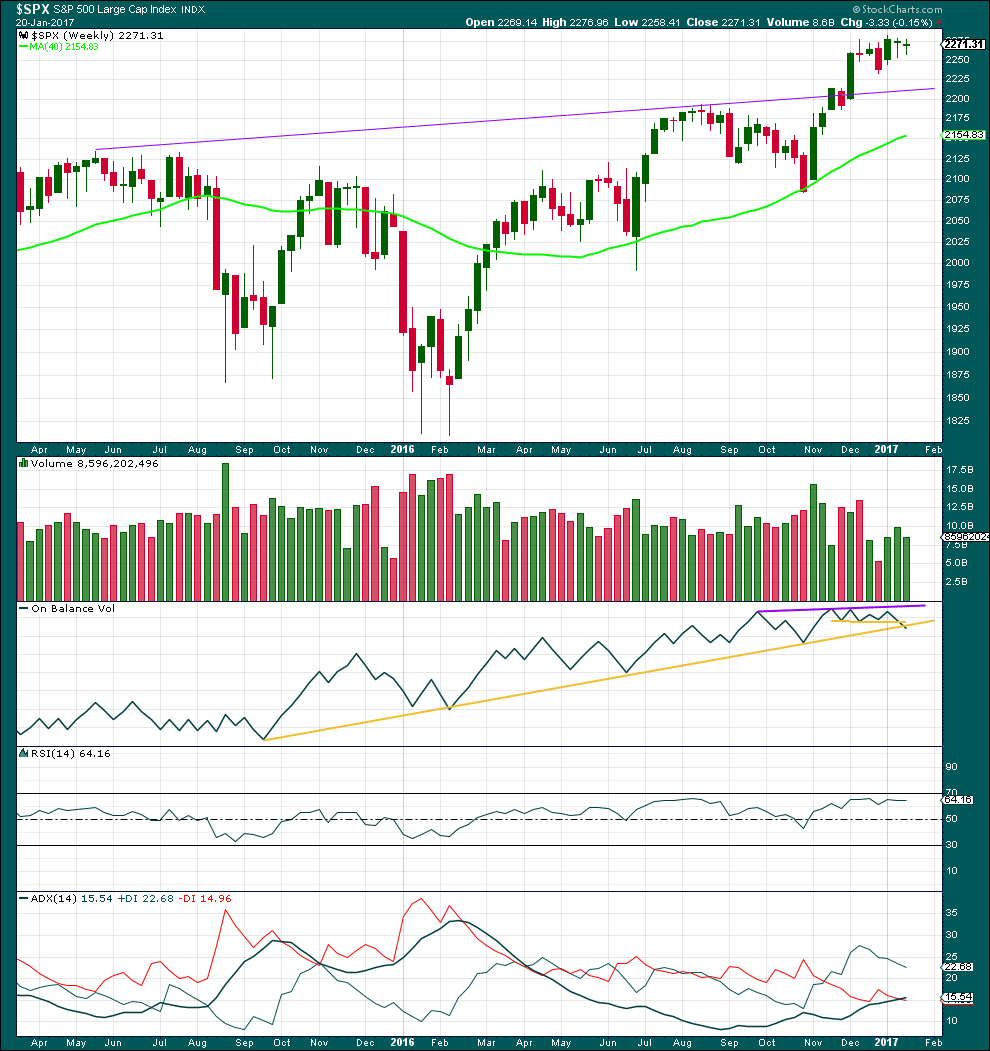
A very small range inside week completes a small green doji candlestick. Price is consolidating.
A decline in volume last week supports the idea that price is consolidating. This supports the main Elliott wave count that sees a correction unfolding for intermediate wave (4).
On Balance Volume last week has come down to the long held yellow support line. This line goes back to September 2015 and it has been tested four times so far. This would be the fifth test. This line has good technical significance. It looks like OBV may be breaking below this line, but there is a little leeway in exactly how this line is drawn, so a clearer break is required before it may be read as a bearish signal.
A break below the long yellow support line by OBV would be a good bearish signal supporting the main Elliott wave count.
RSI is not extreme. There is room for the upwards trend to continue.
ADX is still increasing and is above 15 indicating the market may be in the early stages of an upwards trend.
DAILY CHART
Click chart to enlarge. Chart courtesy of StockCharts.com.
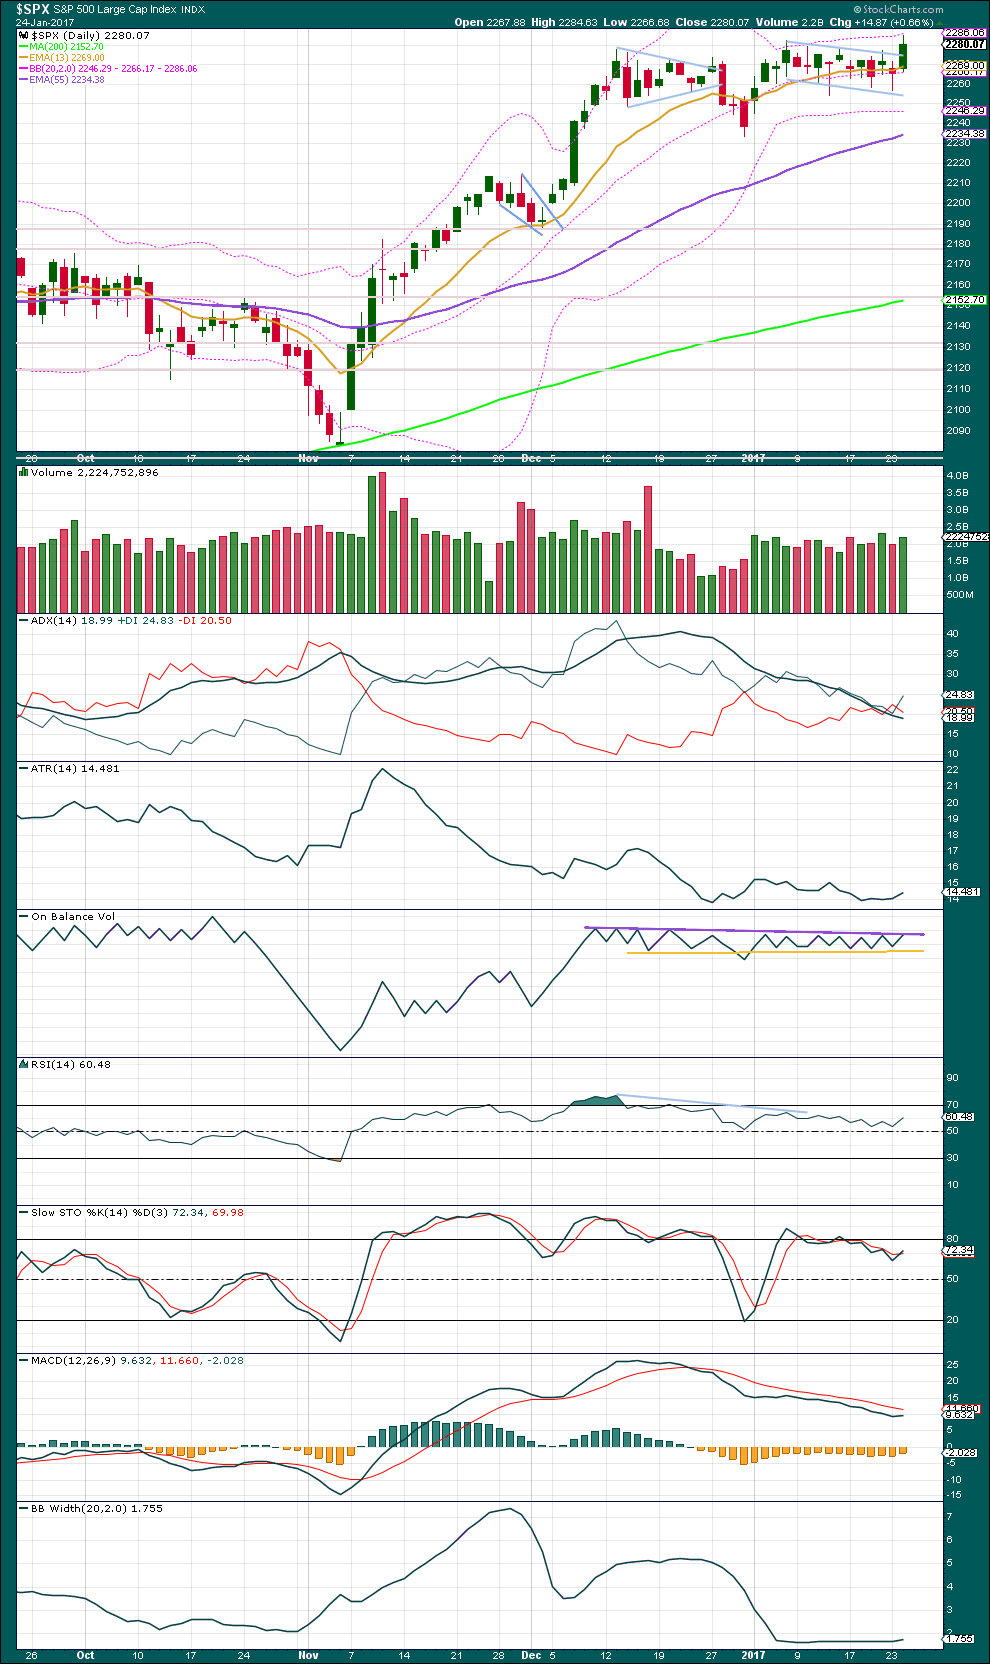
It looks like a bull flag pattern has completed and today an upwards breakout closed above prior resistance. The flag pole is short, only 48.48 points, so a target using the measured rule would be about 2,323.
Today’s upwards day comes with a slight increase in volume to support the rise in price, but volume is lighter than the last upwards day two days prior. This small increase in volume is not what would usually be expected for a breakout to have confidence. However, it is noted that after the last major low on the 4th November, 2016, the first three upwards days came on relatively light and declining volume. At this time, this market appears to be often rising due to a lack of resistance and not necessarily due to the increased activity of buyers.
The next strong resistance may be the next round number pivot about 2,300.
ADX is declining, indicating the market is not currently trending. This is a lagging indicator based upon 14 day averages.
ATR is overall flat but may be beginning to show some increase.
On Balance Volume is at very strong resistance today. The purple resistance line is long held, almost horizontal, and has been tested now multiple times. If OBV can break above resistance tomorrow, then confidence may be had in an upwards breakout. If that happens, then members should join the upwards trend.
Resistance here by OBV indicates some downwards movement tomorrow may be very likely.
There is now strong and long held divergence between price and RSI at today’s new high.
There is strong and long held divergence between price and Stochastics.
Divergence between RSI and Stochastics, and price, has been noted before yet price broke out to new all time highs. It will be noted again today, but it comes with a warning that it may not be reliable.
MACD today remains bearish.
Bollinger Bands remain tightly contracted. Price has touched the upper edge of Bollinger Bands today, but this may continue for several more days if an upwards breakout has just occurred as it did recently from the 7th of December to the 14th of December before a consolidation began.
VOLATILITY – INVERTED VIX CHART
Click chart to enlarge. Chart courtesy of StockCharts.com.
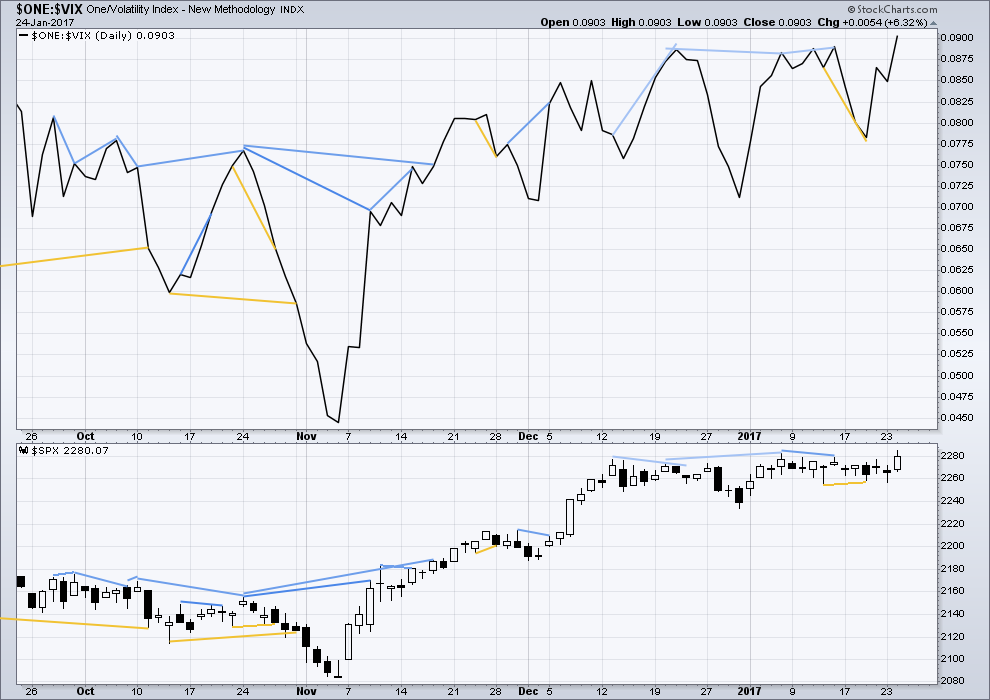
There are a few instances of multi day divergence between price and inverted VIX noted here. Bearish divergence is blue. Bullish divergence is yellow. It appears so far that divergence between inverted VIX and price is mostly working to indicate short term movements spanning one or two days. While this seems to be working more often than not, it is not always working. As with everything in technical analysis, there is nothing that is certain. This is an exercise in probability.
There is no new divergence between price and inverted VIX at today’s new high.
BREADTH – AD LINE
Click chart to enlarge. Chart courtesy of StockCharts.com.
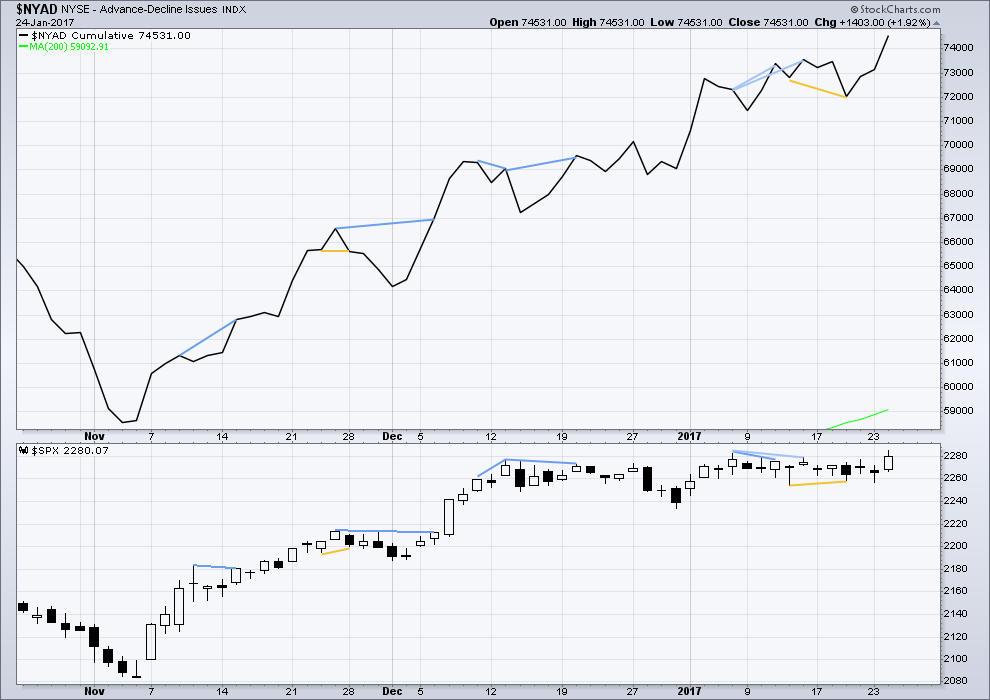
No new divergence at today’s new high is noted between price and the AD line. Upwards movement today has support from market breadth.
DOW THEORY
The DJIA, DJT, S&P500 and Nasdaq have made new all time highs in December of 2016. This confirms a bull market continues.
This analysis is published @ 12:31 a.m. EST on 25th January, 2017.
Well I would have thought this was impossible! I guess I have to face reality!
It now appears DOW may go to 40,000 1st before any major Bear Market!
Who’d a thunk it? Up to this point not me.
Lara,
I am just wondering if it is possible that we have just started Primary 5, rather than Intermediate 5 of Primary 3. This would require that what you have labeled as the end of Intermediate 1 of Primary 3 was actually the end of Primary 1 (I think that was your wave count several months ago).
Thanks,
Peter
Yes, that could fit.
I’ll update that chart and may publish it again today.
That would see this upwards wave as almost the end of cycle V. Which wouldn’t fit at all with what Lowry’s see happening, they don’t see the end of this bull market for at least another 4 months, absolute minimum. Likely longer.
I’ve just checked that updated chart of that old count, and it’s now invalid.
Primary 1 even ending earlier on 22nd March is still longer than primary 3.
Primary 5 with todays high is not longer than primary 3.
That leaves primary 3 as the shortest wave, violating a core rule and invaliding the count.
This gives us some important information; primary 3 isn’t over.
Lara,
I’m confused. If Primary 1 ended where you have Intermediate 1 of Primary 3 labeled, and Primary 3 ended where you have Intermediate 3 of Primary 3 labeled, then, yes, Primary 3 would be shorter (much shorter) than Primary 1. In other words, Intermediate 3 of Primary 3 was actually all of Primary 3. Then Primary 4 would have just ended, and Primary 5 would just be starting. It has a weird look, but if it is valid, then Primary 5 looks like it could run around 200 points without making Primary 3 the shortest wave.
Lara,
Sorry to keep belaboring the point. I went back to look at your old posts. It looks like up until the Christmas/New Year post (December 23rd), you had Primary 1 ending where you now have Intermediate 1 of Primary 3 ending. You had all of Primary 2 labeled where you now have Intermediate 2 of Primary 3 labeled.
I guess what I am asking is if this older labeling could actually be correct, which would make the recent move up for Intermediate 3 actually all of Primary 3 (around 200 points, which is much shorter than the old version of Primary 1, which was around 400 points), the recent sideways move for Intermediate 4 actually all of Primary 4, with Primary 5 starting yesterday at 2257 with room for about 200 points of upward movement (I am just eyeballing that) so as to insure that Primary 3 (currently labeled as Intermediate 3) would not be the shortest wave.
Sorry Peter, and thanks for your persistence. You’re right. I was looking at the wrong alternate.
This is what it would look like.
P3 and P4 could be over. P5 could be underway. The target at 2,500 for this idea is too high, P3 may not be the shortest.
I still don’t like the wave count, for the same reasons as why I discarded it when I found a better fit:
– P1 looks like a three, not a five.
– intermediate (4) within P1 effects only a 0.5 point retracement of P3
– intermediate (5) of P3 is remarkably short
Thanks for sticking with me, and I agree that it is a problematic count. But I know that sometimes the awkward looking counts end up, in hindsight, being correct. Only time will tell.
I agree that this third wave is incomplete. This move up is a classic thrust from a fourth wave triangle and I think we are completing wave five of three. That gap up from yesterday is also important as a move back below would probably signal the arrival of a fourth wave correction. I think that may be closer than some expect. Confirmation of course comes with a move back below 2257.02
It sure does look like a classic thrust.
Lara,
DId the Lowry’s see the bull market last year? As I remember almost all EW folks were bearish last year and only became bullish after S&P crossed 2100ish. When markets were at 1800 last year, most people were calling it to go to 1600 or even 1500. Very prudent to be cautious. Use stops as Lara suggest and don’t get complacent.
I don’t know. Their archive only goes back to October 2016 and I have not been a member for that long.
However, I understand the concept of using the AD line as a measurement of market breadth. Their Operating Companies Only AD line is better than the AD line data on Stockcharts which includes non operating companies which skew the line.
They also provide measurements of buying power and selling pressure.
I’m subscribing to them for the data as well as their summary. I’m not subscribing to them solely for their market predictions.
Lowry’s are not the same as Elliot Wave International. They’re providing quite a different service. They’ve been around since 1938.
Well, the additional information / confirmation I needed has been granted this morning with a 10 point SPX gap up opening. The market is moving up again and has broken out of resistance and the long triangle. While the main daily count is still technically viable, I am discounting it greatly. I will look for a return to that former resistance between 2278 and 2282 before I take a long position.
On the alternate hourly chart (which is now my preferred count) Minor 1 may be completing today. Minor 2 should see the return to the resistance I await. Lara’s chart shows that Minor 2 can also go a bit lower.
It looks like minor 2 didn’t move any lower.
The gap up today looks like a breakout gap, it may now provide support. Stops for long positions may be set at the lower edge of the gap, it may be expected to not be closed, breakaway gaps often aren’t.
There will be an opportunity to join the trend if anyone’s not long yet. After a breakout price often curves back down to test support before moving up and away.
That didn’t happen as expected for the purple trend line though, which illustrates that although this is typical behaviour it doesn’t always happen. I wish it did, then making $$ in this market would be so much easier.
Very interesting indeed. More data needed for the market to show its hand fully. It seems like this is so often the situation. I am sitting on hands and will continue to do so until more confirmation comes to us. Thanks for the analysis Lara.
You’re welcome Rodney.
Gold has broken an important trend line, I’m short there. It’s been moving inversely to the S&P500 at this time. If that relationship persists then S&P should move up.
My only reason for not being long ATM on S&P is On Balance Volume. I’m concerned at support at that line.