
Price has moved lower for the session as expected from the hourly Elliott wave count.
Summary: Some downwards movement to find support at the lilac / purple trend line is expected, about 2,211. If this target is wrong, it may be a little too low. Use the trend line as a preference. If this correction ends in a total Fibonacci 34 sessions, it may end on the 2nd of February. Thereafter, the bull market should resume.
This bull market is strong and healthy. Use this correction as another opportunity to join the trend.
New updates to this analysis are in bold.
Last monthly and weekly charts are here. Last historic analysis video is here.
MAIN ELLIOTT WAVE COUNT
DAILY CHART
Click chart to enlarge.
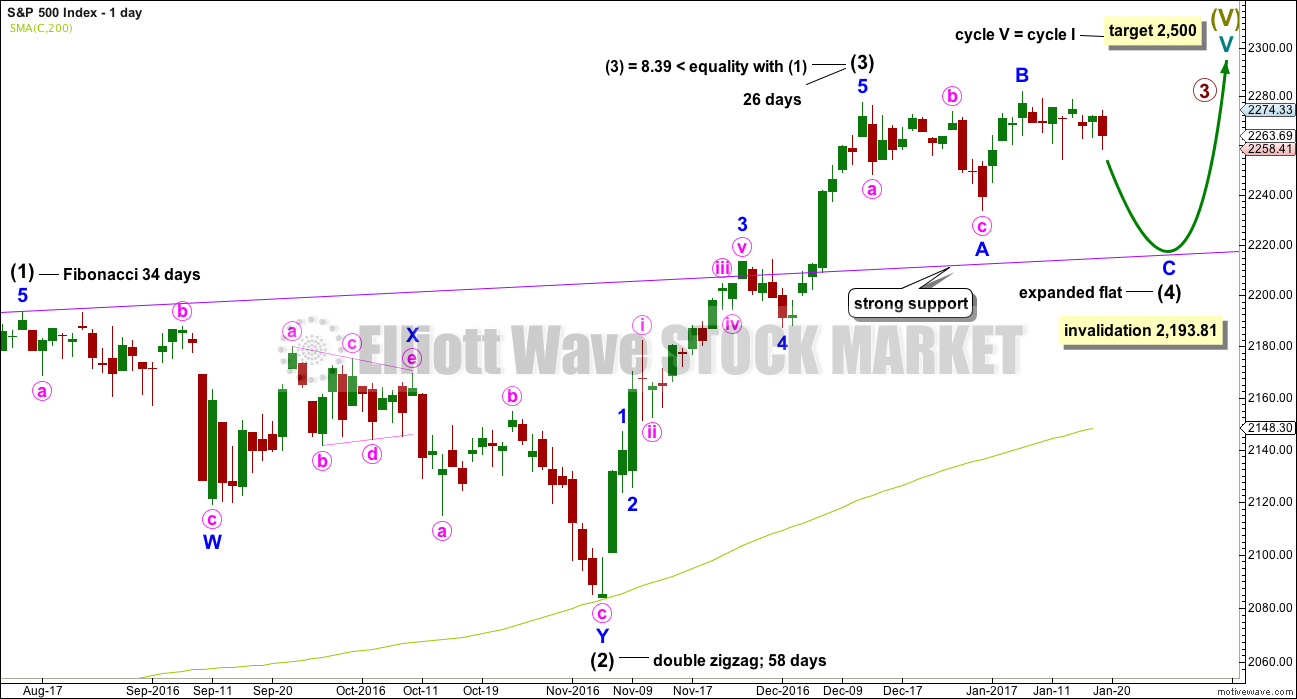
Intermediate wave (4) is exhibiting alternation with intermediate wave (2). Intermediate wave (2) is a double zigzag and intermediate wave (4) is an incomplete expanded flat.
Along the way up to the final target at 2,500 a more time consuming fourth wave correction for primary wave 4 would be expected for this wave count.
The purple trend line is the most important piece of technical analysis on all charts. Draw it carefully from prior all time highs of 2,134.28 on the 21st of May, 2015, to 2,193.81 on the 15th of August, 2016. Extend it out. Daily charts are on a semi log scale.
The correction for intermediate wave (4) should end if price comes down to touch the purple trend line.
Intermediate wave (4) may not move into intermediate wave (1) price territory below 2,193.81.
At this stage, intermediate wave (4) has lasted 24 sessions. With the very slow rate of this correction it may now be possible for it to continue for another 10 sessions to total a Fibonacci 34. This would see it end on the 2nd of February.
HOURLY CHART
Click chart to enlarge.
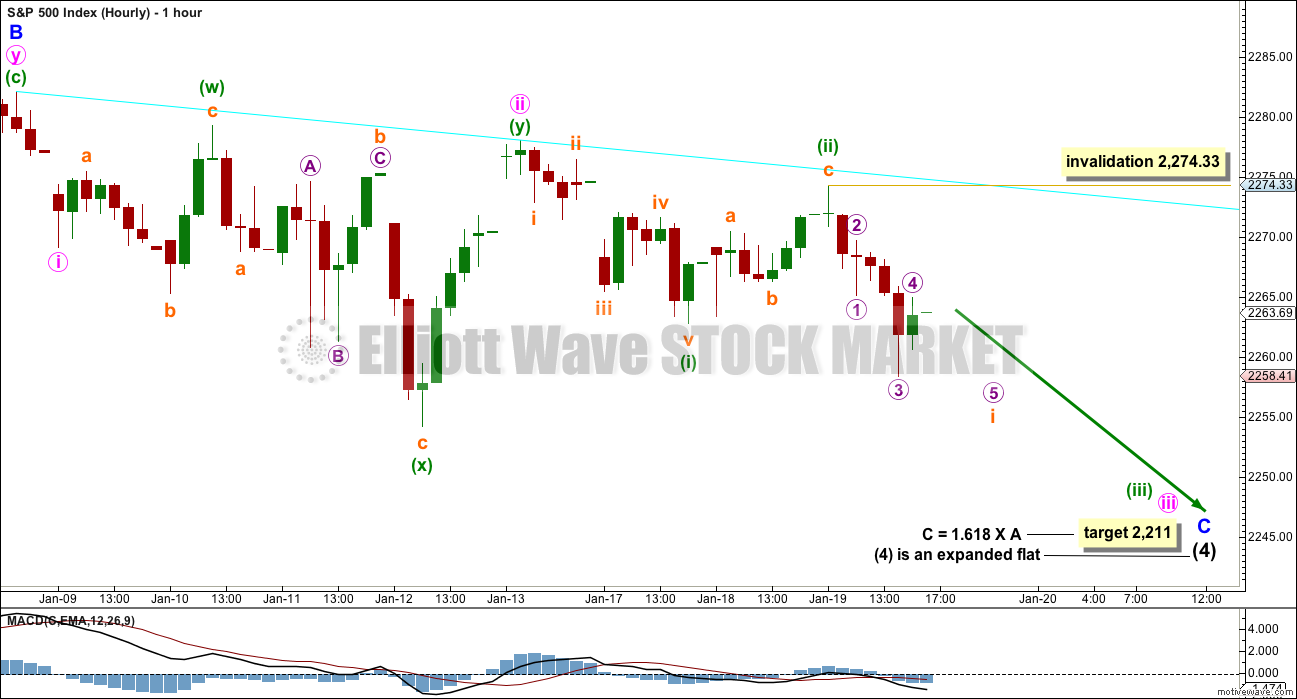
If the target calculated is wrong, it may be too low. Price may find strong support just above the target at the purple trend line (now seen on the daily chart).
Minor wave C must complete as a five wave structure. It is extremely likely to make at least a slight new low below the end of minor wave A at 2,233.62 to avoid a truncation and a very rare running flat.
Within minute wave iii, minuette waves (i) and (ii) may now be complete. Within minuette wave (iii), the upcoming correction for subminuette wave ii may not move beyond the start of subminuette wave i above 2,274.33
When minute wave iii is over, then minute wave iv should unfold sideways and may not move into minute wave i price territory.
A resistance line is added today in cyan. This line is tested four times, not too strongly sloped, and now held for a reasonable time at the hourly chart level. It offers some reasonable technical significance. Corrections along the way down may be expected to find resistance here if this wave count is correct.
ALTERNATE ELLIOTT WAVE COUNT
WEEKLY CHART
Click chart to enlarge.
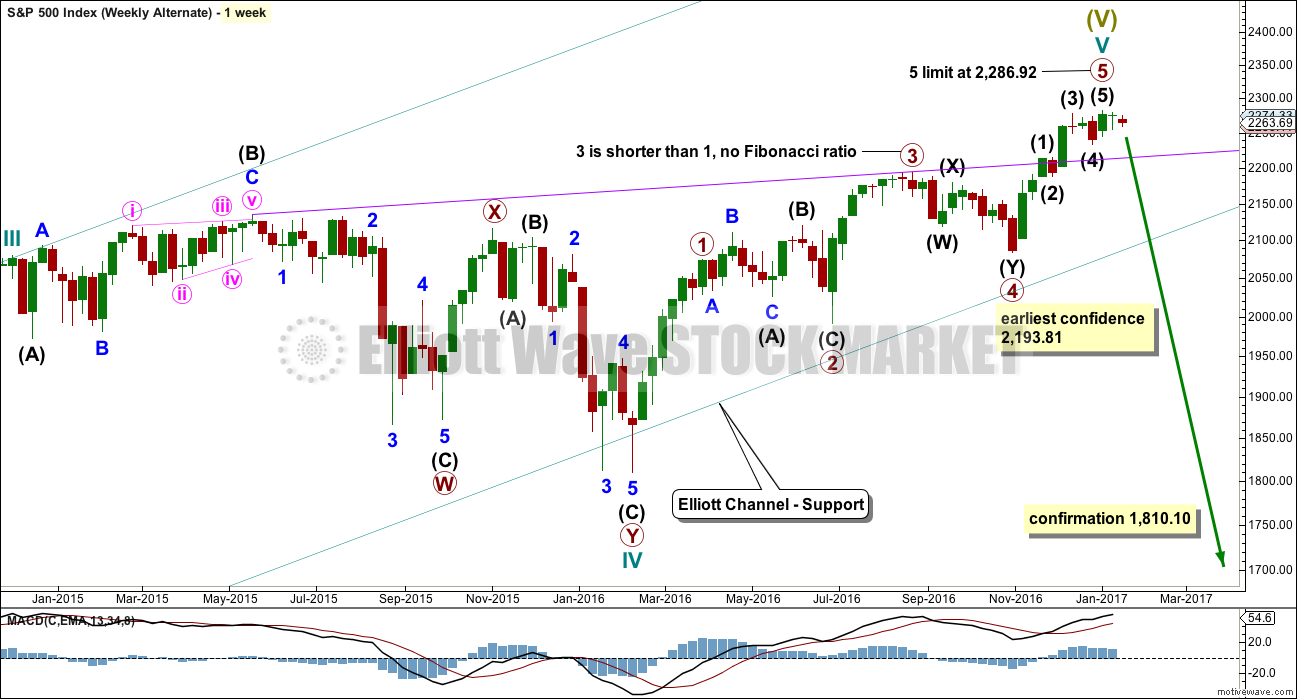
What if the main wave count is wrong? What if cycle wave V is complete already? Does that fit?
Yes, it does. But this wave count has very little support from classic technical analysis.
If price makes a new low below 2,193.81, then a variation of this wave count would be the new main wave count. At that stage, the degree of labelling within cycle wave V would be moved all down one degree. >Only primary wave 1 of cycle wave V may be over.
I am discarding the idea that primary wave 5 may continue much further. It cannot because the core Elliott wave rule stating a third wave may not be the shortest within an impulse must be met. Here, primary wave 3 is shorter than primary wave 1 by 60.94 points. Primary wave 3 may not be the shortest wave, so primary wave 5 is limited to no longer than equality in length with primary wave 3 at 2,286.92. So far primary wave 5 is 4.82 points shorter than primary wave 3, so thus far the rule is met.
Only a new low below 1,810.10 could finally confirm this wave count. At that stage, downwards movement could not be a second wave correction within cycle wave V, so cycle wave V would then have to be over. Only at that point would price indicate a multi generational trend change has arrived. Dow Theory would also need confirmation from DJIA and DJT to confirm such a large trend change.
When cycle wave V is over, it would complete a Grand Super Cycle wave. A trend change from bull to bear would be expected, a once in a multi generational bear market. This wave count expects to see a huge market crash, bigger than the Great Depression. The size of this trend change absolutely requires price confirmation and technical indication before any confidence at all could be had in a wave count such as this.
This wave count does not have support from Lowry’s. They see an increase in market breadth is currently supporting the rise in price. Normally, market breadth begins to diverge from price 4-6 months prior to a final high and a change from a bull to a bear market. There is no divergence at all at this point in time.
ADX at the monthly chart level does not support this wave count. This trend is not extreme: ADX is below 20 and increasing at the monthly chart level. At market highs ADX is most often extreme (not always, it wasn’t in September 2007).
The only piece of technical analysis I can see at this stage is strong multi month divergence with RSI at the monthly chart level. This is common before a turn from a bull to bear market. However, this divergence can persist for very long periods of time. RSI and price exhibited divergence, for 45 months, prior to the high of March 2000 going back to June 1996. This is a warning of a coming bear market, but it is not particularly useful for timing.
At this time, price and RSI at the monthly chart level exhibit divergence back to November 2013, a period now of 37 months.
This wave count is just one possibility in the world of many possibilities. It does not have a good probability, I would judge it to be as low as 5-10%. However, low probability does not mean it cannot happen. Sometimes low probability outcomes do occur; when they do, they are never what was expected. This wave count is published in the spirit of always considering possibilities, with the knowledge that nothing is impossible.
TECHNICAL ANALYSIS
WEEKLY CHART
Click chart to enlarge. Chart courtesy of StockCharts.com.
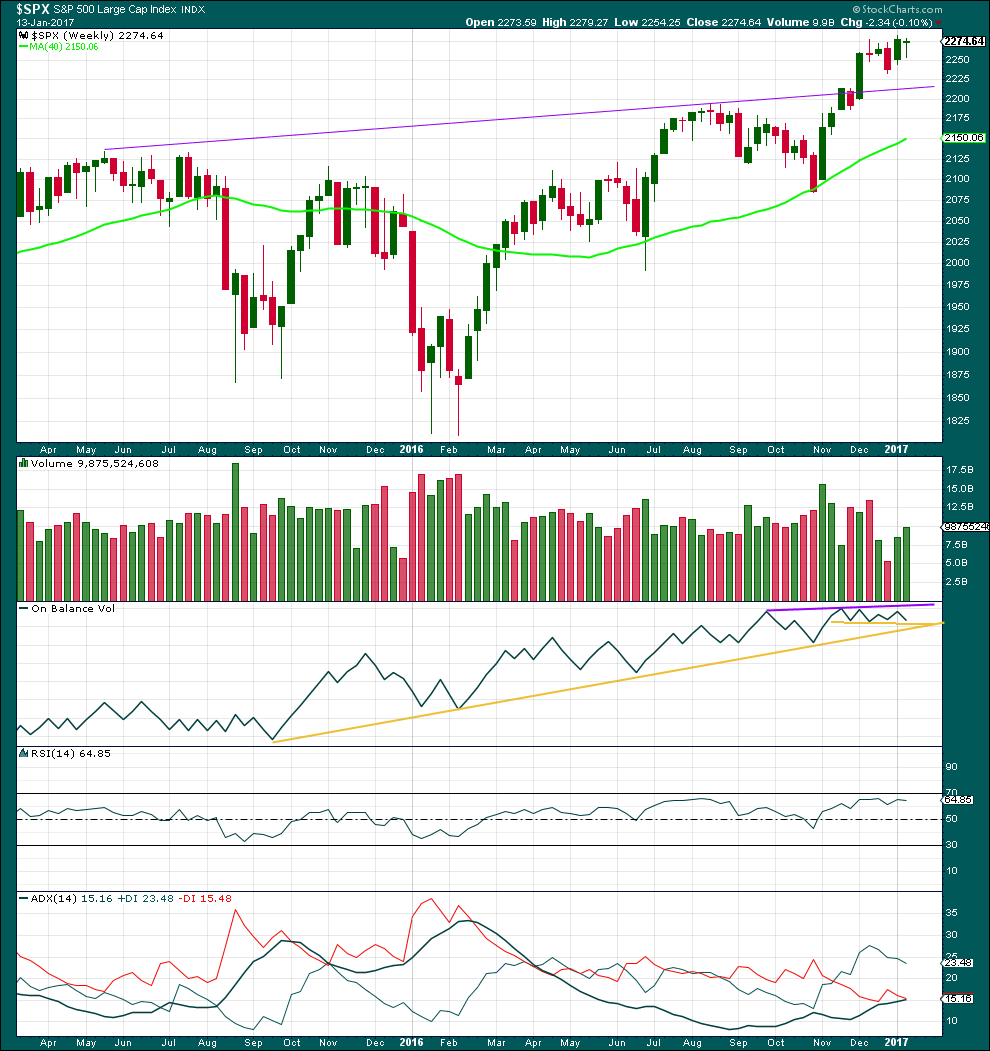
Last week completes an inside week for a Dragonfly doji. Doji are common within consolidations, so this does not signal any trend change but does support the idea that price is consolidating for the week.
The week completed with stronger volume, the balance of which was downwards. There was some support for downwards movement during the week and this also supports the idea that price is within a consolidation that may move lower.
RSI is not extreme. There is room still for price to continue higher when the consolidation is complete.
ADX indicates price is most likely in the early stages of a new trend. The black ADX line is increasing and above 15 but below both directional lines, so the trend is young. The +DX line is above the -DX line, so the trend is indicated as upwards.
DAILY CHART
Click chart to enlarge. Chart courtesy of StockCharts.com.
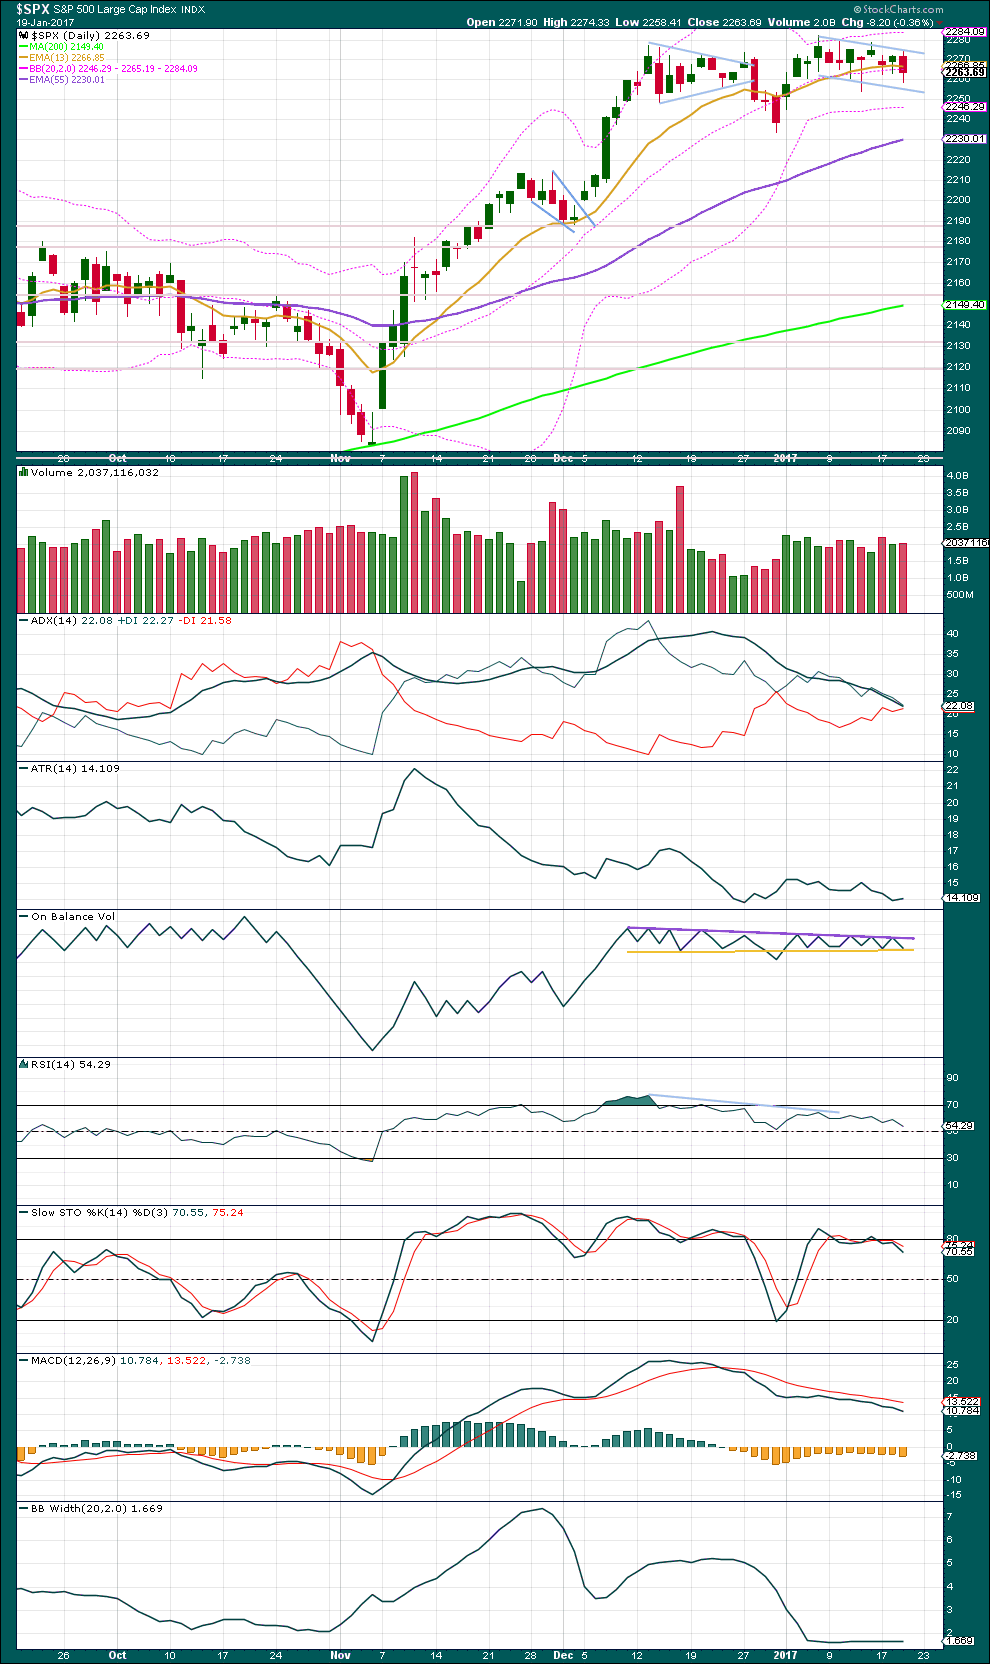
A larger range day than yesterday moved price lower. The balance of volume was down and volume was slightly higher than yesterday. The fall in price today had some support from volume. This supports the idea of more downwards movement here.
Price is consolidating in a full flag pattern. Price today found support at the lower edge of the pattern. The Elliott wave count expects this support to give way in coming days for a deeper correction. In the short term, this support line is offering an obstacle to downwards movement.
ADX is declining, indicating the market is not currently trending; it is consolidating. ADX is still above 20 and further consolidation would be necessary to bring it down further, which would allow room for the existing longer term bull trend to resume. The +DX line remains above the -DX line, so no trend change is indicated at this stage.
ATR is overall flat as price is consolidating, in agreement with ADX.
On Balance Volume has come down yet again to test the yellow support line. OBV is tightly constrained within contracting lines of support and resistance. A breakout by OBV should at this stage be taken very seriously as a bull or bear signal, depending on the direction. If OBV moves lower tomorrow, it would be a strong bearish signal that would offer strong support to the main Elliott wave count. If that happens, then expect it is very likely that price may come down to test the purple trend line on the daily main Elliott wave chart.
MACD remains bearish offering some small support for the main Elliott wave count.
Bollinger Bands remain remarkably tightly contracted. Volatility will return to this market, and On Balance Volume may indicate the next direction for price.
VOLATILITY – INVERTED VIX CHART
Click chart to enlarge. Chart courtesy of StockCharts.com.
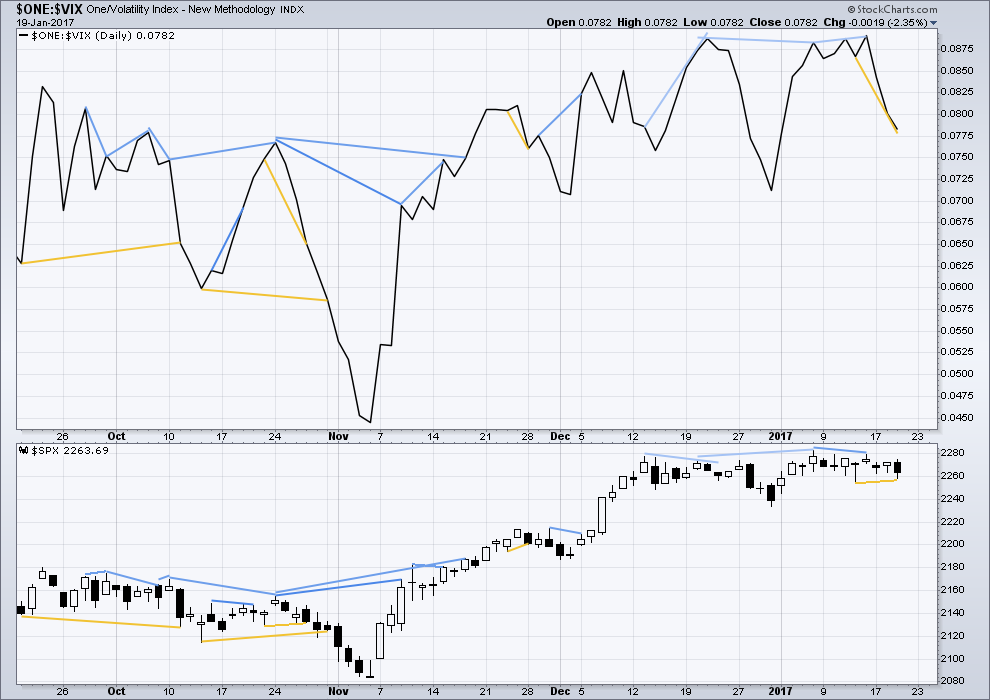
There are a few instances of multi day divergence between price and inverted VIX noted here. Bearish divergence is blue. Bullish divergence is yellow. It appears so far that divergence between inverted VIX and price is mostly working to indicate short term movements spanning one or two days. While this seems to be working more often than not, it is not always working. As with everything in technical analysis, there is nothing that is certain. This is an exercise in probability.
Short term hidden bullish divergence has been followed by a downwards day. It is concluded that this bullish divergence has failed. It was noted yesterday that in three of the four recent instances bullish divergence between price and inverted VIX failed. Now that is four of five. It will not be given much weight at all.
Price and inverted VIX moved lower today. The fall in price today came with a normal increase in volatility.
Short term hidden bullish divergence between the lows of the 12th of January and today’s low is noted in yellow. It will be given little to no weight at this time.
I will keep watching instances of divergence; it may begin to work again. It seems that bearish divergence is currently more reliable than bullish divergence.
BREADTH – AD LINE
Click chart to enlarge. Chart courtesy of StockCharts.com.
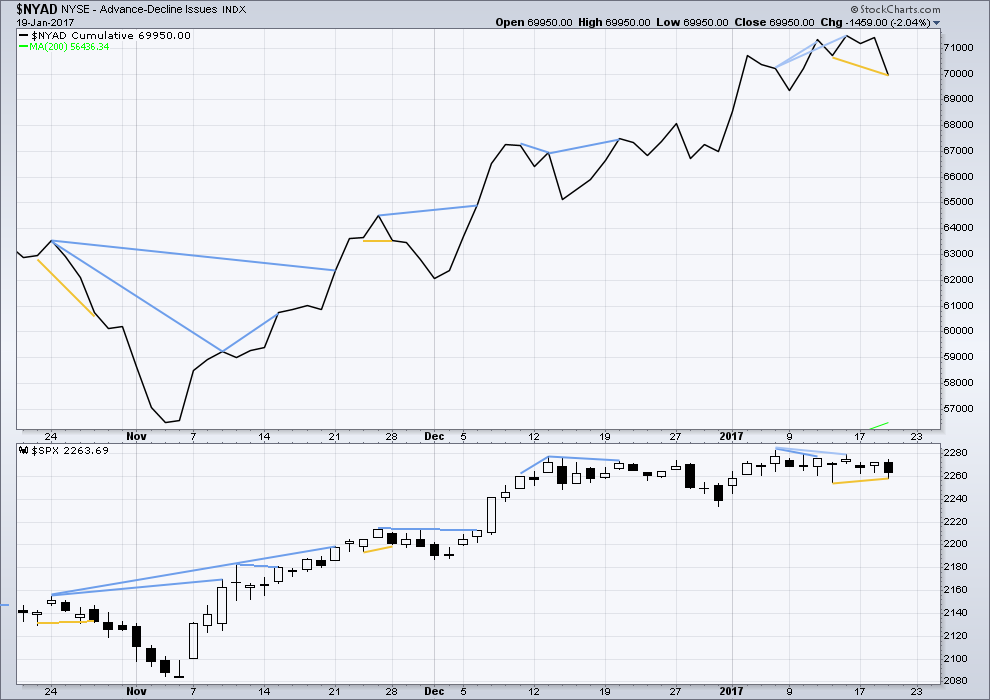
There is today hidden bullish short term divergence between price and the AD line: price has made a higher low compared to the low of the 12th of January, but the AD line today has made a lower low.
Two other instances of hidden bullish divergence between price and the AD line are noted with yellow trend lines on this chart. The bullish divergence failed in both instances becuase it was not followed by one or two days of upwards movement.
That may well happen again here. It will be given little to no weight in this analysis today.
DOW THEORY
The DJIA, DJT, S&P500 and Nasdaq have made new all time highs in December of 2016. This confirms a bull market continues.
This analysis is published @ 09:45 p.m. EST.
The main hourly count has been invalidated this morning. If SPX reaches above 2281.90, then the daily count will be invalidated as well. I think that would mean Primary (4) would have completed at 2233.62 on Dec. 30th as a simple zig-zag. Of course, Lara may have some entirely different ideas.
Everything was looking so good for the main count. Until this morning! Thank you President Trump. (Is that our new go to phrase when we don’t like what we see?)
I think my labelling of minuette (ii) as complete was premature, and my moving the invalidation point down too quick.
I would have expected minor C to be moving more strongly lower by now. It really is mucking around. I’m wondering now if this is a continuation of minor wave B, that would explain price behaviour neatly.
I’ll take some time to chart what that would look like today.
For now this is my updated hourly chart.
Oops! sorry about the duplicate – I was attempting to edit and double posted and only noticed too late to delete.
The question of any remaining life-span for primary five for the alternate count is a fascinating one indeed. The whisker’s breadth of room for continued upward movement would imply very limited upside it seems.
The sluggish nature of the current correction is, as so many other things in this market, most peculiar. One would have thought that the C wave down would be sharp, concluding with dispatch so the bull could continue to run. Is this possibly a proverbial calm before…well, you know… 🙂
DJI 20,000 where art thou?!
Duplicate fixed 🙂
I agree that this C wave is sure taking its time to develop, and it leaves me wondering whether there is something else going on here. But I can’t for the life of me figure out what it is.
It may be a B wave.
They are confounding.