
Downwards movement was again expected, but this time did not eventuate for Friday.
Price moved higher but did not make a new high, and volume was weaker.
Note: NYSE is closed on Monday, so there will be no new price action from BarChart to analyse. Next analysis of this market will be after Tuesday’s close.
Summary: Some downwards movement to find support at the lilac / purple trend line is expected, about 2,211. If this target is wrong, it may be a little too low. Use the trend line as a preference. If this correction ends in a total Fibonacci 34 sessions, it may end on the 2nd of February. Thereafter, the bull market should resume.
This bull market is strong and healthy. Use this correction as another opportunity to join the trend.
New updates to this analysis are in bold.
Last monthly and weekly charts are here. Last historic analysis video is here.
DAILY CHART
Click chart to enlarge.
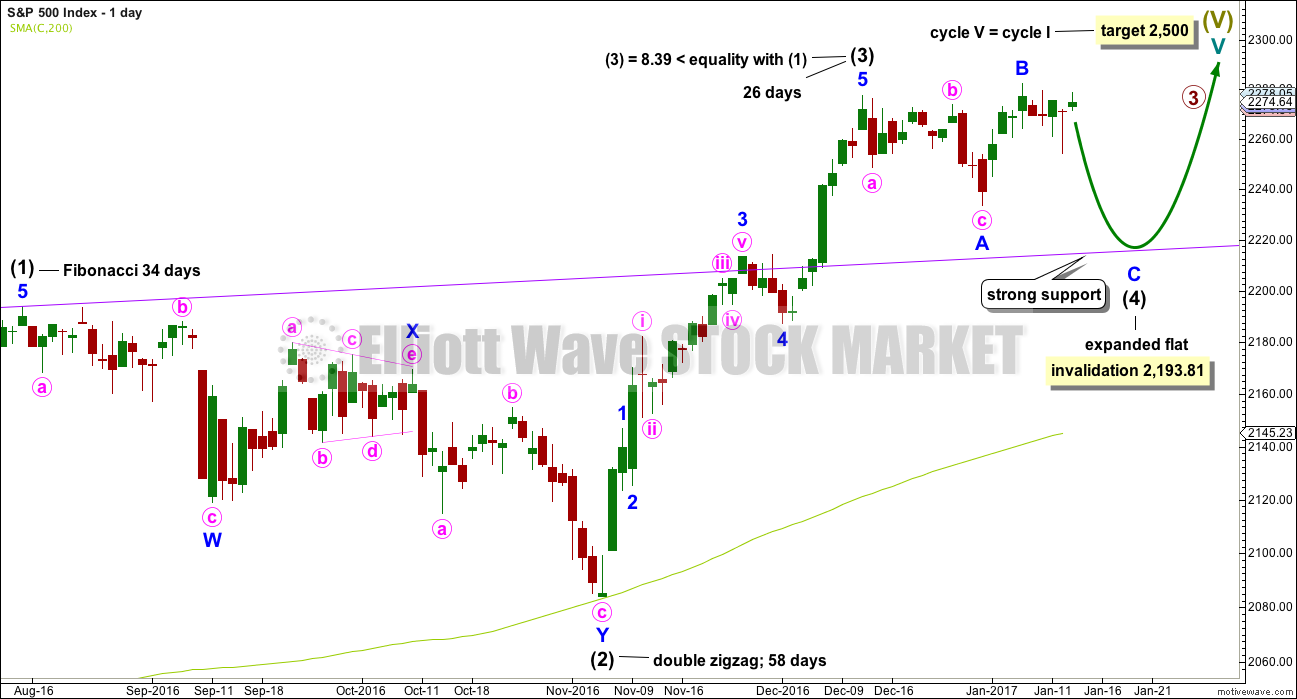
Intermediate wave (4) is exhibiting alternation with intermediate wave (2). Intermediate wave (2) is a double zigzag and intermediate wave (4) is an incomplete expanded flat.
Along the way up to the final target at 2,500 a more time consuming fourth wave correction for primary wave 4 would be expected for this wave count.
The purple trend line is the most important piece of technical analysis on all charts. Draw it carefully from prior all time highs of 2,134.28 on the 21st of May, 2015, to 2,193.81 on the 15th of August, 2016. Extend it out. Daily charts are on a semi log scale.
The correction for intermediate wave (4) should end if price comes down to touch the purple trend line.
Intermediate wave (4) may not move into intermediate wave (1) price territory below 2,193.81.
At this stage, intermediate wave (4) has lasted 21 sessions. With the very slow rate of this correction it may now be possible for it to continue for another 13 sessions to total a Fibonacci 34. This would see it end on the 2nd of February.
HOURLY CHART
Click chart to enlarge.
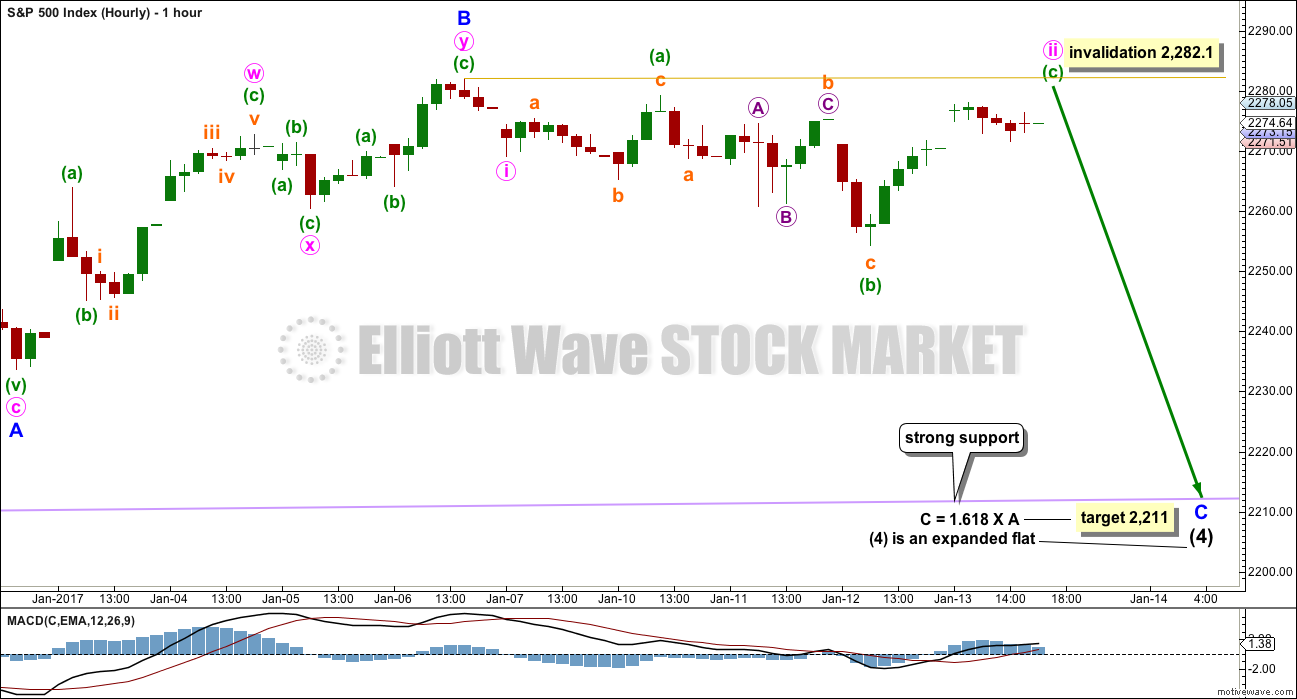
If the target calculated is wrong, it may be too low. Price may find strong support just above the target at the purple trend line. This line is copied over carefully from daily and weekly charts, which are both on semi log scales. This hourly chart is on an arithmetic scale, meaning the line will sit slightly differently. Both should be watched carefully.
Minor wave C must complete as a five wave structure. It is extremely likely to make at least a slight new low below the end of minor wave A at 2,233.62 to avoid a truncation and a very rare running flat.
The green resistance line drawn in last analysis was breached and is no longer useful, so it is removed.
An invalidation point is added within minor wave C. Minute wave ii may not move beyond the start of minute wave i above 2,282.10.
Minute wave ii may be a complete expanded flat correction. If this labelling is correct, then when markets open for Tuesday minute wave ii may begin with a very little upwards movement to move minuette wave (c) above the end of minuette wave (a) at 2,279.27 to avoid a truncation and a very rare running flat.
Thereafter, downwards movement should show some increase in momentum as a low degree third wave unfolds.
TECHNICAL ANALYSIS
WEEKLY CHART
Click chart to enlarge. Chart courtesy of StockCharts.com.
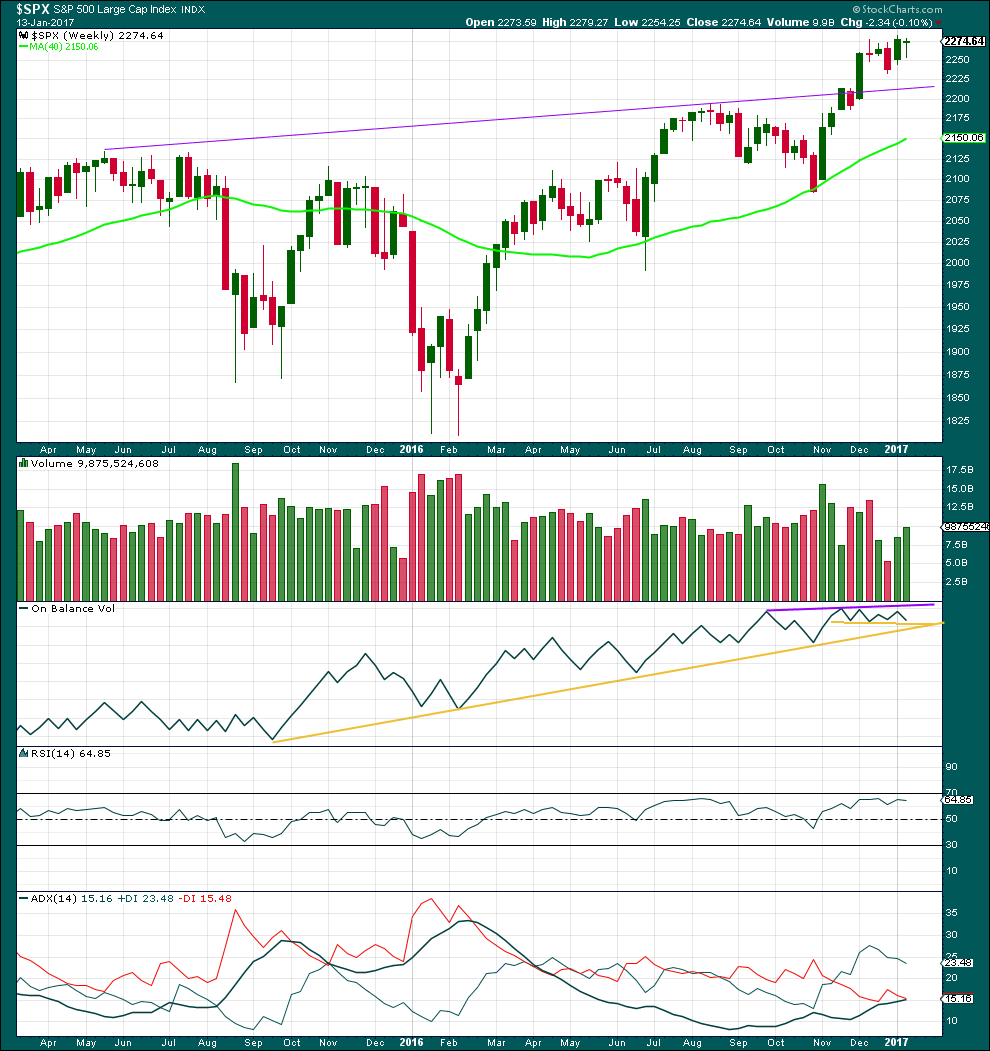
This week completes an inside week for a Dragonfly doji. Doji are common within consolidations, so this does not signal any trend change but does support the idea that price is consolidating for this week.
The week completed with stronger volume, the balance of which was downwards. There was some support for downwards movement during the week and this also supports the idea that price is within a consolidation that may move lower.
RSI is not extreme. There is room still for price to continue higher when the consolidation is complete.
ADX indicates price is most likely in the early stages of a new trend. The black ADX line is increasing and above 15 but below both directional lines, so the trend is young. The +DX line is above the -DX line, so the trend is indicated as upwards.
DAILY CHART
Click chart to enlarge. Chart courtesy of StockCharts.com.
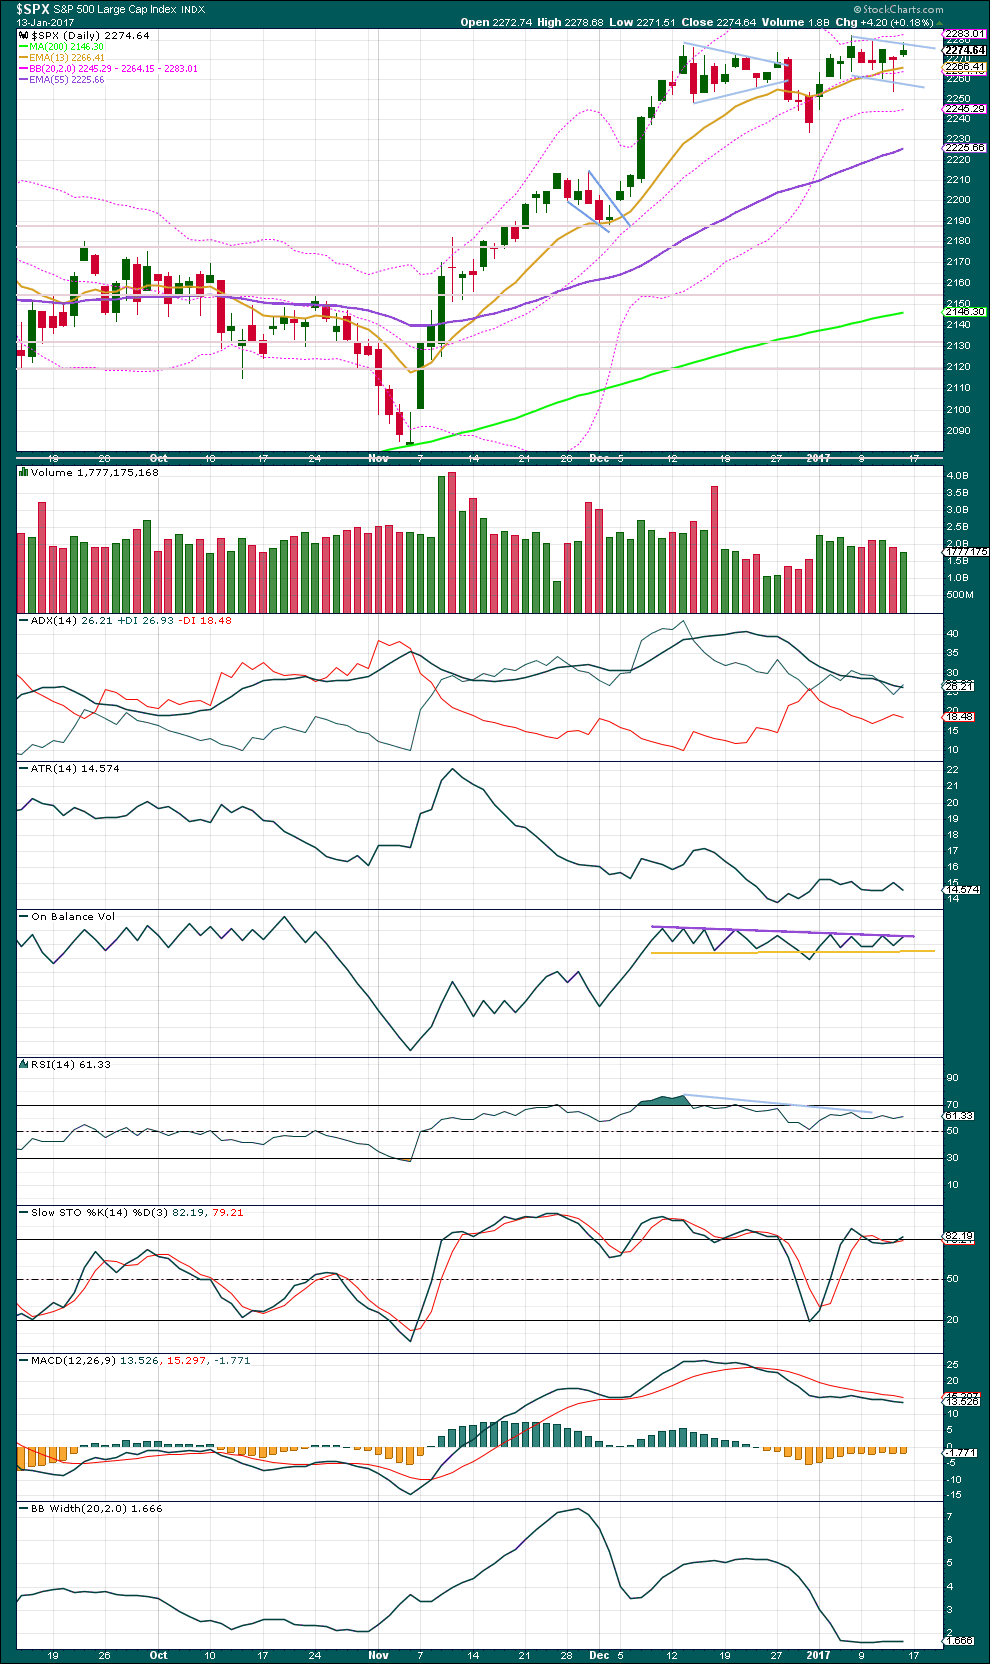
An upwards day with a longer upper wick and almost no lower wick completes a small range day. This comes with a further decline in volume. There was not support for the upwards movement in price today. This may resolve the bullishness seen in the long lower wicks of the two daily candlesticks prior, noted in last analysis.
Overall, price is now consolidating sideways. This view is supported by small range days coming on declining volume. Another small bull flag pattern may be completing, delineated by light blue trend lines. However, with some weakness (divergence) at the last high, this flag pattern may not work. If it does, then it needs an upwards breakout above resistance on a day with an increase in volume. The measured rule gives a target of about 2,323.
The bear flag pattern here is an opposite view to the Elliott wave count. If the hourly Elliott wave chart is invalidated by a new high, then use the measured rule given from the flag pattern.
The trend is still up. The short term Fibonacci 13 day average is above the mid term Fibonacci 55 day average, and both are above the long term average. All three are pointing up. Price may find support at the short term average for smaller corrections within the trend, and at the mid term average for larger corrections within the trend.
On Balance Volume remains tightly constrained, and these trend lines now have good technical significance, particularly the purple resistance line. This may assist to halt the rise in price for Friday here. A breakout would be a strong signal in either direction here.
At the last high, RSI exhibited some divergence with price to indicate the last wave up was relatively weak. This supports the Elliott wave count short term.
MACD is bearish. This also offers some small support for the Elliott wave count short term.
Bollinger Bands remain tightly constrained. Expect them to begin to widen again as volatility returns to the market.
VOLATILITY – INVERTED VIX CHART
Click chart to enlarge. Chart courtesy of StockCharts.com.
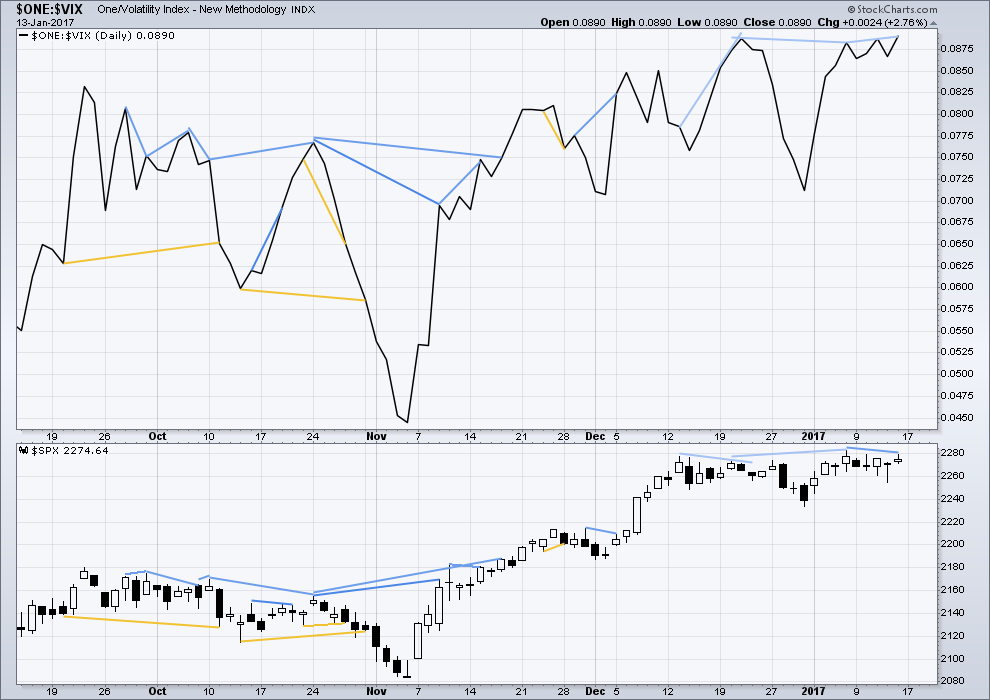
There are a few instances of multi day divergence between price and inverted VIX noted here. Bearish divergence is blue. Bullish divergence is yellow. It appears so far that divergence between inverted VIX and price is mostly working to indicate short term movements spanning one or two days. While this seems to be working more often than not, it is not always working. As with everything in technical analysis, there is nothing that is certain. This is an exercise in probability.
Short term hidden bearish divergence is noted today between price and inverted VIX: price has made a lower high, but inverted VIX has made a new high. This indicates weakness to upwards movement from price, and it may be followed by one or two days of downwards movement.
BREADTH – AD LINE
Click chart to enlarge. Chart courtesy of StockCharts.com.
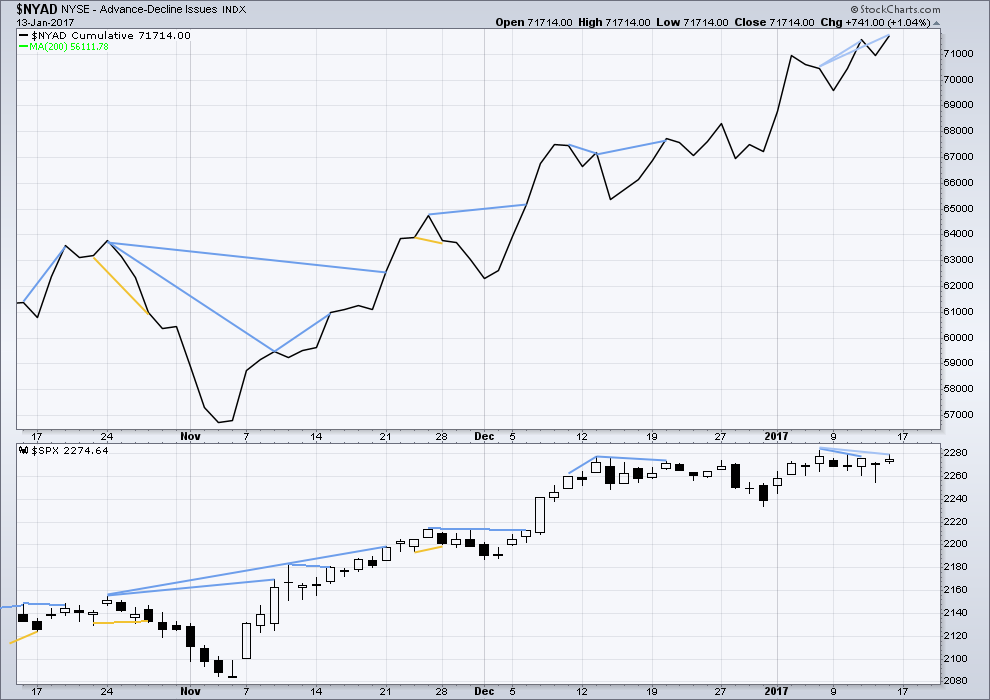
Short term bullish and bearish divergence is again working between price and the AD line to show the direction for the following one or two days.
The AD line today made a new all time high, but price failed to make a corresponding new high. This is hidden bearish divergence and indicates weakness within upwards movement today from price. This may now be followed by one or two days of downwards movement.
DOW THEORY
The DJIA, DJT, S&P500 and Nasdaq have made new all time highs in December of 2016. This confirms a bull market continues.
This analysis is published @ 06:58 p.m. EST.
[Note: Analysis is public today for promotional purposes. Member comments and discussion will remain private.]
I pay close attention to Bottarelli Research’s “Sharp Paper” trade alerts. These are option trades involving far larger than the daily option trading volume of the underlying equity. The results of these trades are as close to insider trading as I have ever seen while still remaining completely legit. The win rate on these alerts is an amazing 88%. The last looser (and that only for about a week or so as the trader held the position) was a massive Brexit trade on European financials that really went South big time.
A trader today bought 100,000.00 VIX Feburary 21 strike calls. This trade is not particularly unusually large as VIX trades a bit less than four times that many calls daily. The trader is paying 0.49 per contract, so he needs a break even price of 21.49 for VIX by expiration, which represents a roughly 87% gain in VIX. Pure premium outlay for this trade is a cool 4.9 million. The trader will pocket ten million for each dollar VIX moves beyond 21.49
Here is why I am interested in this trade. Peter Kimble is still calling an ED in SPX.
If he is right, a fourth wave zig-zag will have to re-enter wave one territory which should take us below 2200.00 An awful lot of traders are watching that support, formerly resistance line in the 2210-2220 area and if it is broken, we could see a real spike in the fear gauge, easily moving VIX into the mid twenties. I do not think a possible break will be fatal, but it will dislodge a large number of bull riders ahead of the market’s move on to new highs. I will be looking for a VIX upper BB penetration to signal the completion of the correction.
I’m relabelling minute ii as a complete combination: flat – X – zigzag.
Now for minute iii down. The target remains the same. When minute waves i through to iv are complete I’ll be able to calculate it at a second degree. At that stage it may widen to a zone or change. If it changes it will probably be a bit higher, as I expect that purple trend line to hold.
If the purple trend line doesn’t hold… then the wave count would be in jeopardy.
I’m working on an alternate. What if the main wave count at the weekly and daily chart level is just plain wrong? What else could be happening?
However, re reading Lowry’s report, this market has underlying breadth. The AD line is making new all time highs recently. The OCO AD line is also making new ATHs.
Price is going up. Underlying breadth is improving. The trend is not extreme. The technicals all point to continuing upwards movement. So use corrections as an opportunity to join the trend. That’s how to make money when the market is in a bullish trend, and at the end of the day we’re all here to make money. So lets make some money!
Waiting patiently for price to come and touch that purple line then I’m in long.
Happy New Year to ALL!
My view is the same (as expressed before)… not changed! Trump will be great for REAL US Economic Growth for decades to come but I firmly believe there will be a 12 to 18 month extreme adjustment period before it kicks in for equity investments (Stock Market).
You have to consider… that the US Equity Markets were EXTREMLY over valued though mid 2015 and all of 2016 + I can make a case even before that… since S&P 1050!
Nothing has changed EXCEPT that the markets are even more overvalued today than on election day! Over Valued to “nose bleed” extreme levels that will not be washed away with a 5% to 15% correction!
Trump is a disrupter and the Washington swamp will be drained! Everything will be changed in Washington! The establishment and the Globalists will NOT go down without a fight! A fight that they will NOT win! Public Service careers with then an exit of that PS Career to Great Wealth through selling influence will END under Trump! Wealth concentration to the very few Globalist’s will end. The middle class will once again prosper and that dream to go from very poor to rich and middle class to rich will be resurrected!
Corporate Cash will go into investments of real things in the USA and NOT to the wasteful Stock Buy Back Programs!
+ The FED will be neutered once & for all! Trump will give the okay to audit and change the FED or to eventually eliminate the FED!
This is my view of things and I will not change it!
DOW to 40,000 but NOT before a 12 to 18 month nasty adjustment period! Stated another way the cleansing will be upon us… finally!
Wow!
Happy New Year to you too Joe 🙂
May we all have a profitable 2017. I have a feeling it’s going to be good.
Hi Joe. Happy New Year to you as well. I certainly hope your expectations on a Trump presidency prove to he true. I hold no ill will for any country in the world. But I would like to see America great again among the world nations being a leader for good and prosperity for all.
http://www.zerohedge.com/news/2017-01-16/tumbling-pound-rattles-global-markets-chinese-stock-slide-forces-government-interven
The sustained, egregious manipulation continues; the past two trading days in China, and beginning at 6:40 am this morning in US markets. For me, I’ve been quietly exiting all long term positions, as this is not a market worth participating in (that I’ve booked a 7% gain MTD). Trading currencies has provided some entertainment as of late.