
Sideways movement to complete a small green doji candlestick fits the Elliott wave count.
Summary: Some downwards movement to find support at the lilac / purple trend line is expected, about 2,211. If this target is wrong, it may be a little too low. Use the trend line as a preference. If downwards movement ends in three days, then the consolidation would have totalled a Fibonacci 21 days. Thereafter, the bull market should resume.
This bull market is strong and healthy. Use this correction as another opportunity to join the trend.
New updates to this analysis are in bold.
Last monthly and weekly charts are here. Last historic analysis video is here.
DAILY CHART
Click chart to enlarge.
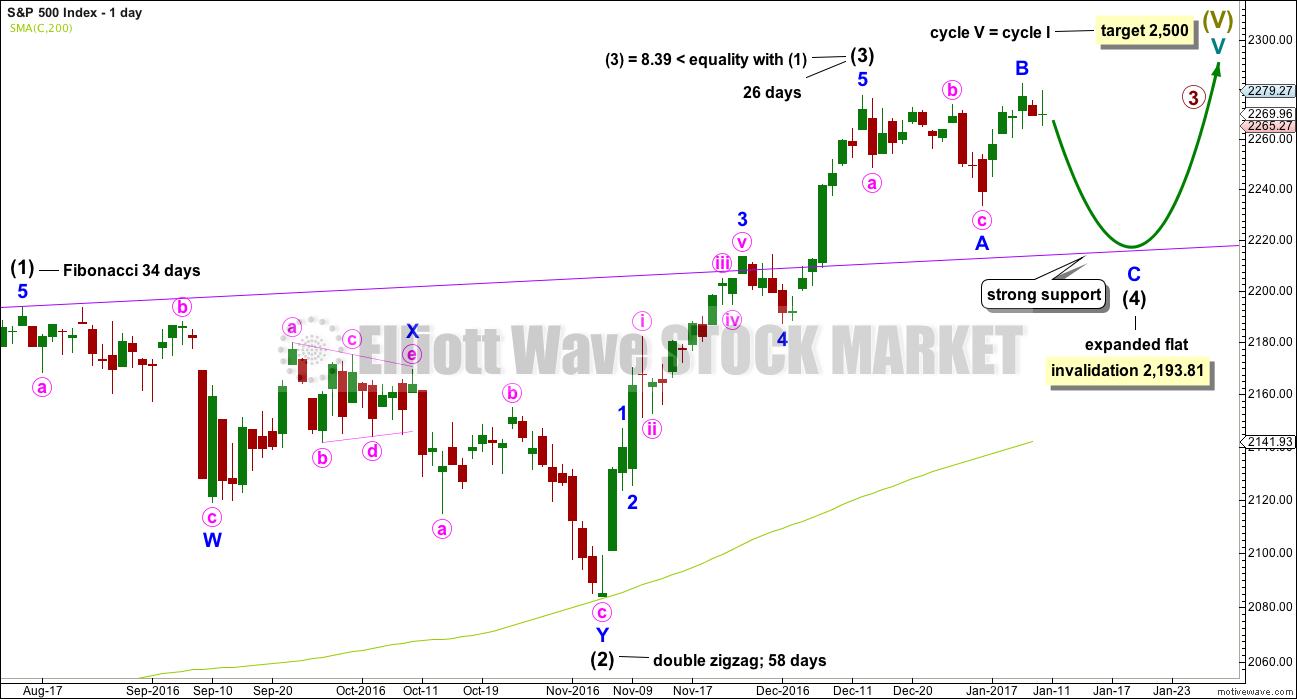
Intermediate wave (4) is exhibiting alternation with intermediate wave (2). Intermediate wave (2) is a double zigzag and intermediate wave (4) is an incomplete expanded flat.
Along the way up to the final target at 2,500 a more time consuming fourth wave correction for primary wave 4 would be expected for this wave count.
The purple trend line is the most important piece of technical analysis on all charts. Draw it carefully from prior all time highs of 2,134.28 on the 21st of May, 2015, to 2,193.81 on the 15th of August, 2016. Extend it out. Daily charts are on a semi log scale.
The correction for intermediate wave (4) should end if price comes down to touch the purple trend line.
Intermediate wave (4) may not move into intermediate wave (1) price territory below 2,193.81.
HOURLY CHART
Click chart to enlarge.
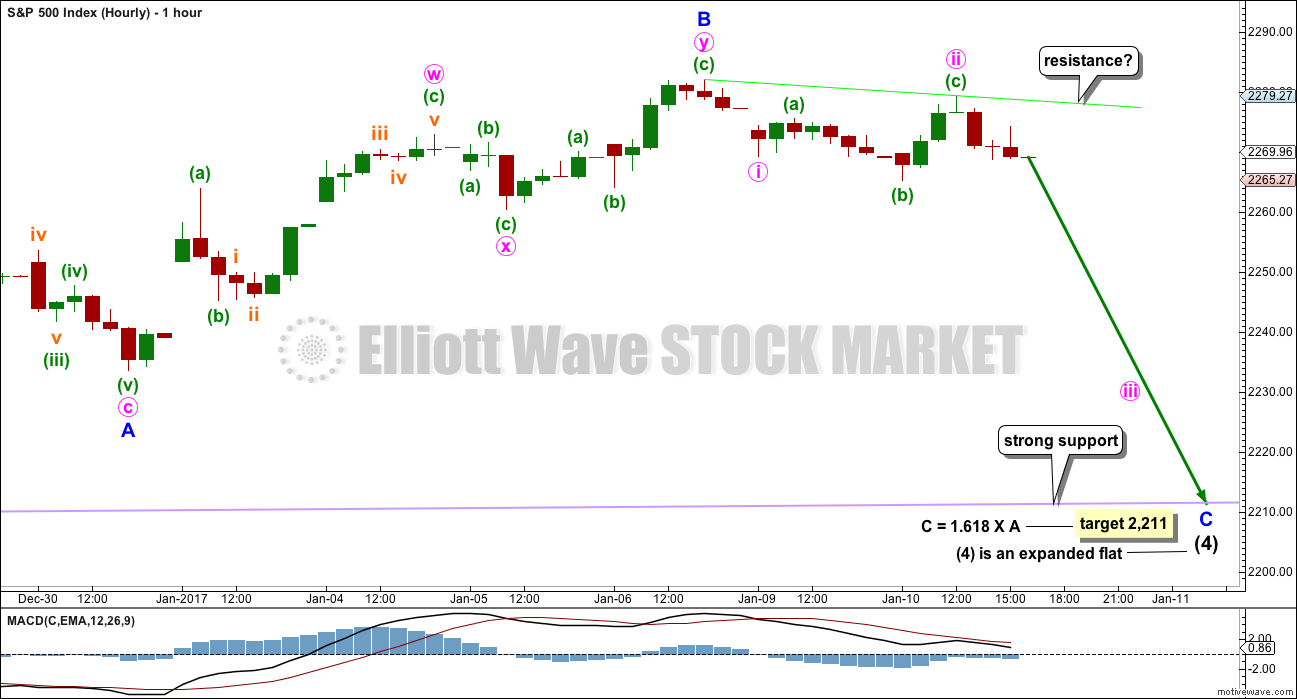
If the target calculated is wrong, it may be too low. Price may find strong support just above the target at the purple trend line.
Minor wave C must complete as a five wave structure. It is extremely likely to make at least a slight new low below the end of minor wave A at 2,233.62 to avoid a truncation and a very rare running flat.
Sideways movement for Tuesday’s session fits as an expanded flat correction for minute wave ii. A tentative resistance line is drawn across the last two highs. If price remains below this line and makes a new low below 2,265.27, then a little confidence may be had that a small third wave down should be underway.
So far intermediate wave (4) has lasted 18 sessions. If it exhibits a Fibonacci duration, it may complete in another three to total a Fibonacci 21, but this may not allow enough time. The next Fibonacci number in the sequence is 34, which requires a further 16 sessions, and this looks to be too long. Intermediate wave (4) may not exhibit a Fibonacci duration.
TECHNICAL ANALYSIS
WEEKLY CHART
Click chart to enlarge. Chart courtesy of StockCharts.com.
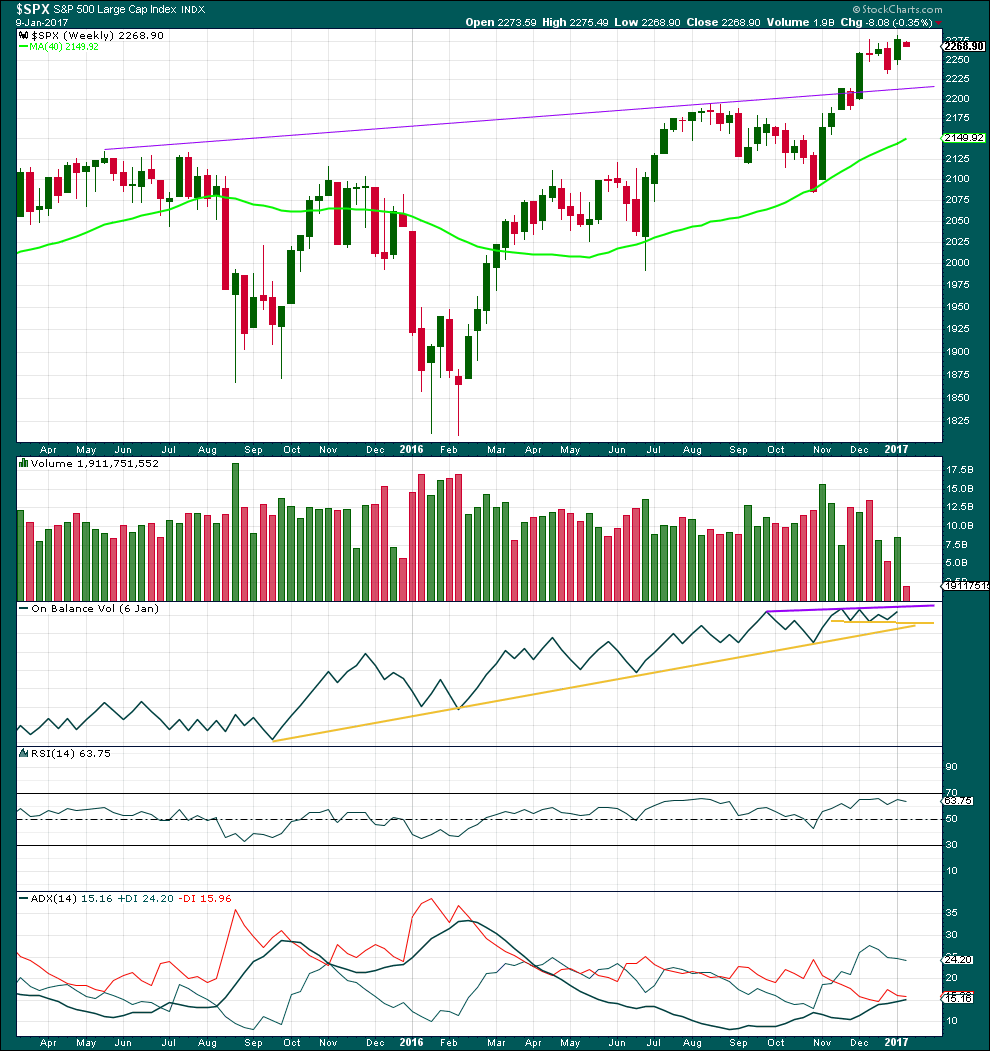
The last three complete weeks show lighter volume than the three weeks prior. This makes sense as a consolidation. Volume has an upwards bias and makes sense if the larger trend is still up.
On Balance Volume is still constrained below resistance and above support.
RSI is not extreme and still in bullish territory.
ADX indicates a new trend; it is above 15 and rising. The trend is up.
DAILY CHART
Click chart to enlarge. Chart courtesy of StockCharts.com.
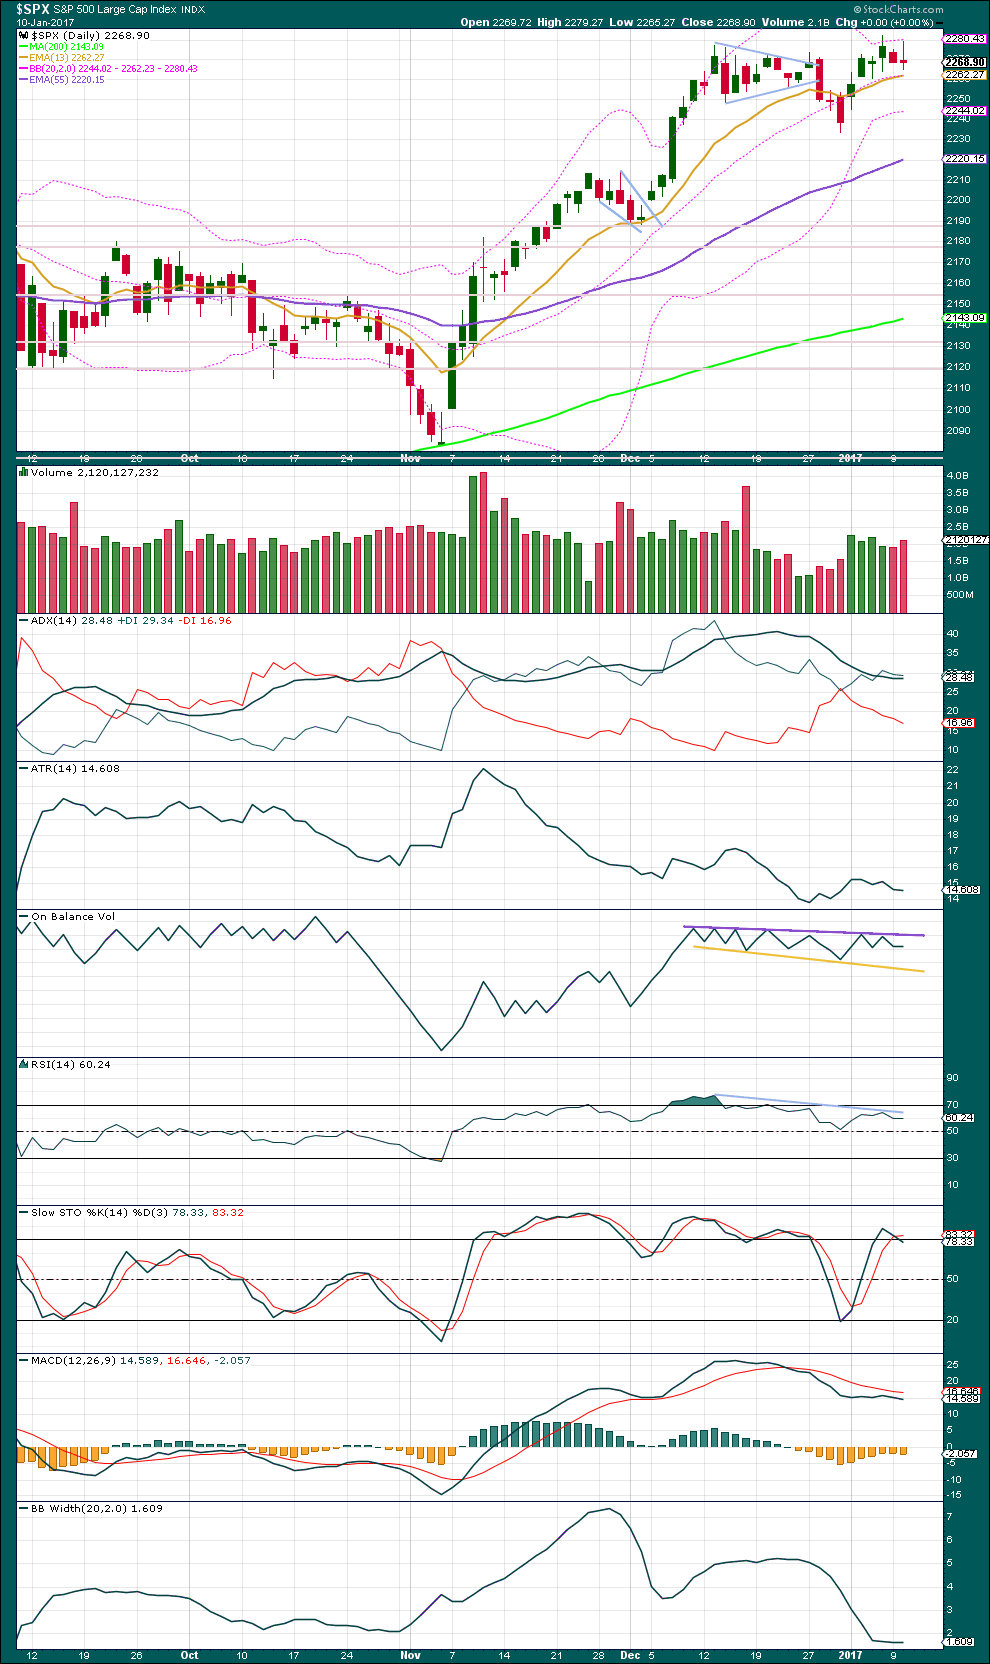
Sideways movement over the last eighteen days has brought ADX down from extreme. ADX is declining, indicating the market is not currently trending. The +DX line remains above the -DX line, so only a consolidation is indicated.
Some increase in volume for another red daily candlestick indicates downwards movement has some support from volume today. This supports the Elliott wave count short term.
ATR is low and overall flat. This is normal for a consolidation.
There is divergence between price and RSI at the last high. This supports the Elliott wave count, which sees the last high the end of a B wave. B waves will typically show a lack of strength.
On Balance Volume remains constrained below resistance and above support.
Stochastics is overbought and also exhibits multiple regular bearish divergence with price at highs. This supports the Elliott wave count.
MACD is bearish.
Bollinger Bands are tightly contracted. This also supports the Elliott wave count. This is more normal for a consolidation.
The picture for the S&P today still looks fairly clear: price is consolidating. Expect support at the purple trend line on the weekly TA chart.
VOLATILITY – INVERTED VIX CHART
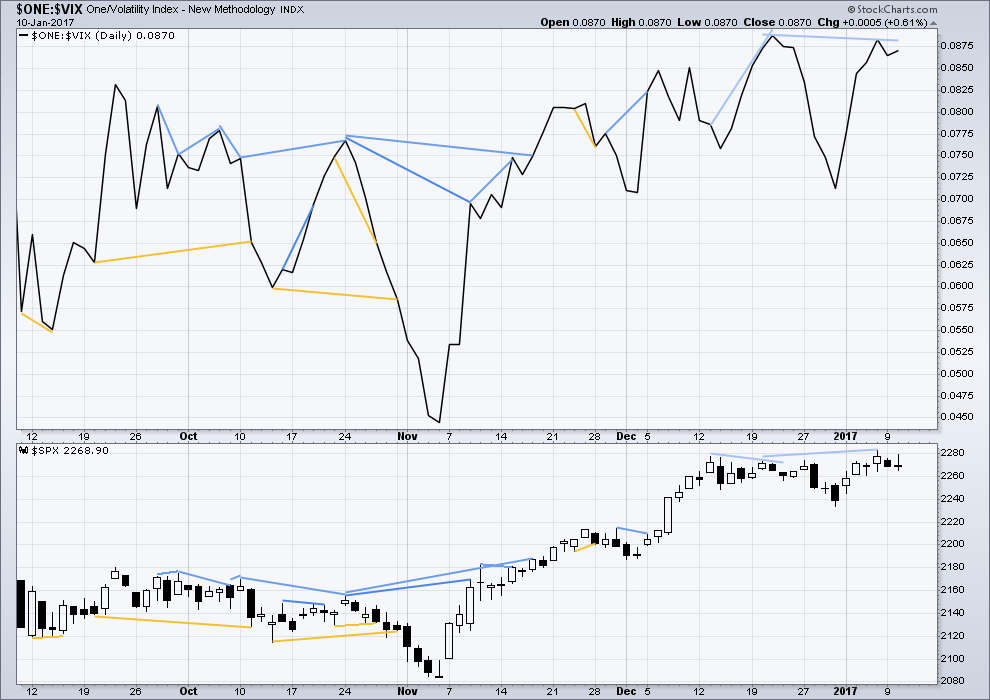
Click chart to enlarge. Chart courtesy of StockCharts.com.
There are a few instances of multi day divergence between price and inverted VIX noted here. Bearish divergence is blue. Bullish divergence is yellow. It appears so far that divergence between inverted VIX and price is mostly working to indicate short term movements spanning one or two days. While this seems to be working more often than not, it is not always working. As with everything in technical analysis, there is nothing that is certain. This is an exercise in probability.
Some short term divergence between price and inverted VIX is noted. This is regular bearish divergence. This supports the Elliott wave count short term. Some downwards movement for one or two days may result. This has now been followed by two red / black daily candlesticks, so it may now be resolved.
BREADTH – AD LINE
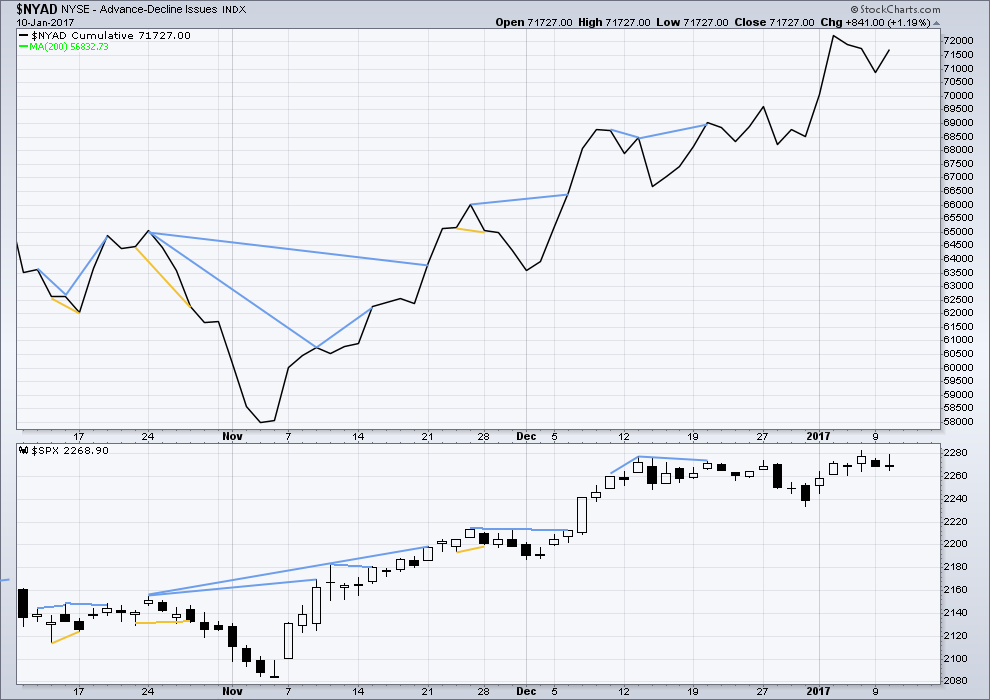
Click chart to enlarge. Chart courtesy of StockCharts.com.
Short term bullish and bearish divergence is again working between price and the AD line to show the direction for the following one or two days.
There was an instance of single day divergence two sessions ago between price and the AD line: while price moved to a new high and completed a green / white candlestick, the AD line declined slightly. This has now been followed by two red / black daily candlesticks, so it may now be resolved.
I subscribe to Lowry’s On Demand service to keep a track of the health of the market in terms of market breadth. They conclude that this bull market is strong and healthy, and is likely to continue for at least three or four months, if not substantially longer.
DOW THEORY
The DJIA, DJT, S&P500 and Nasdaq have made new all time highs in December of 2016. This confirms a bull market continues.
This analysis is published @ 06:20 p.m. EST.
I have liquidated all my long positions (leveraged) in my short term trading account at a very small profit. I will now look to re-enter around 2230 or 2220. At that same time, I will also be adding to my non-leveraged long term account long positions (now at 50%).
Good call Lara. I look forward to Mr. Market’s early 2017 gift to join the trend. A move from 2220 to the not yet announced target for Primary 3 (2400+?) is a nice way to start the New Year.
The target would be 2,478 where primary 3 = 1.618 X primary 1.
But I’m not putting that target on charts because it’s too high.
When intermediate (4) ends, intermediate (5) is limited to no longer than equality with intermediate (3) which was only 193.74 points.
This is because intermediate (3) is shorter than intermediate (1) and the core rule stating a third wave may not be the shortest must be met.
If intermediate (4) ends at it’s target at 2,211 then intermediate (5) would have a limit at 2,404.74. So the target at 2,478 looks too high.
Thanks for the great analysis as always Lara. Quick observation/question, for those of us who run/manage money and monitor tick volume, minute candles, and moving average algo programs, they ever present, ready to arrest any declines wizard has been appearing more frequently in the very near term. How do reconcile the fact that here the market is likely at its most manipulated, and historical data and wave form matter not?
I have a rather unpopular view on that.
Markets have always been manipulated. It is my view that market manipulation can push a wave to be longer or shorter than it would otherwise, can cause corrections to be more deep or shallow, but cannot overall change the wave count.
It is my view that market manipulation is part of social mood. That it fits into the wave count.
When a structure is complete and the market is ready to turn no amount of manipulation can stop it. For evidence of this statement I offer the example of the bubble and crash in the Chinese stock market.
The CCP did everything they could do, blatant attempts at manipulation to hold price up. Nothing they did worked.
The market will do what the market will do.
Eventually the public will resist central bank and government attempts to prop up this ageing market, then it will be ready to turn. But not yet. Governments and banks can only operate with social licence. Once they lose that and the mass of people turn against them there will be nothing that can stop price falling.
But for now everyone is all in and the bull still is healthy.
As for the short term, manipulation matters of course. It makes TA much harder to identify turns for price.
But to date I have seen no movement in the S&P that does not fit the restrictive rules of Elliott wave. It all fits EW structure and so far all looks pretty good. I see no reason at this time to discard Elliott wave.
And finally, this is a common question. It seems to be a common view that market manipulation has made technical analysis obsolete.
I don’t think so, and that view fits neatly with social mood and the larger EW structure actually. It is common at market peaks for TA to be out of favour, to be roundly criticised. It becomes more popular in bear markets, particularly at bear market lows.
Good answer, thanks.
That resistance line is holding so far, so expect that may now continue.
Today so far gives a lower low and lower high, the definition of downwards movement. Although it’s very choppy and overlapping, not yet showing any strength for a small third wave.
With all this mucking around it doesn’t look like intermediate (4) is going to exhibit a Fibonacci duration, it doesn’t look like it can complete minor C down in just two more days.