
Another very small range day moved price essentially sideways fitting the Elliott wave count for the short term.
Two hourly Elliott wave counts are provided to end the year, with the one daily Elliott wave count remaining the same.
Summary: A small pennant pattern may be completing and may end on the 30th of December. The breakout should be upwards and the target would be about 2,359 (measured rule) or 2,473 (Elliott wave).
Last monthly chart is here.
Last weekly chart is here.
New updates to this analysis are in bold.
DAILY CHART
Click chart to enlarge.
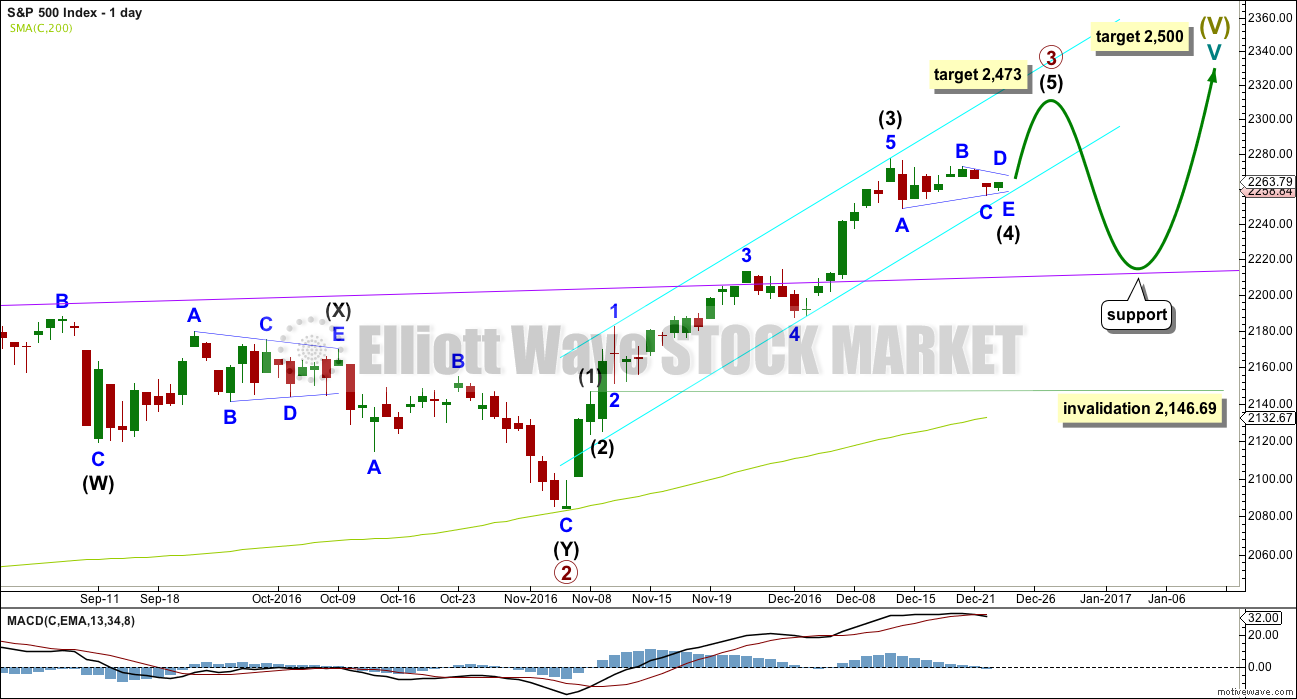
Cycle wave V must subdivide as a five wave structure. At 2,500 it would reach equality in length with cycle wave I. This is the most common Fibonacci ratio for a fifth wave for this market, so this target should have a reasonable probability.
Cycle wave V within Super Cycle wave (V) should exhibit internal weakness. At its end, it should exhibit strong multiple divergence at highs.
Within cycle wave V, primary waves 1 and 2 are complete. Primary wave 3 may be over halfway through and is now exhibiting stronger momentum than primary wave 1. It is possible primary wave 3 may fall short of the target and not reach equality in length with primary wave 1.
Within primary wave 3, the correction for intermediate wave (4) looks like it is relatively brief and shallow. Intermediate wave (2) was over very quickly within one day. Intermediate wave (4) may last a little longer and may not move into intermediate wave (1) price territory below 2,146.69. If it continues for four more sessions, it may complete in a total Fibonacci thirteen sessions ending on Friday the 30th of December. When any and all wave counts that allow for intermediate wave (4) to continue have been invalidated, then the invalidation point may be moved up to the start of intermediate wave (5).
At 2,473 primary wave 3 would reach equality in length with primary wave 1. This Fibonacci ratio is chosen for this target calculation because it fits with the higher target at 2,500.
There is already a Fibonacci ratio within primary wave 3. Intermediate wave (3) is 12.49 points short of 2.618 the length of intermediate wave (1). This is a reasonable difference, but as it is less than 10% the length of intermediate wave (3) I will consider it close enough to say there is a Fibonacci ratio here. This means that intermediate wave (5) should not be expected to exhibit a Fibonacci ratio to either of intermediate waves (1) or (3), as the S&P often exhibits Fibonacci ratios between two of its three actionary waves and rarely between all three.
When primary wave 3 is complete, then the following correction for primary wave 4 may last about one to three months and should be a very shallow correction remaining above primary wave 1 price territory. Although primary wave 3 has now moved above the end of primary wave 1, it looks like primary wave 3 needs to move higher to allow enough room for primary wave 4 to unfold.
A best fit cyan trend channel is drawn about primary wave 3. Draw the first trend line from the high labelled minor wave 1 to the high labelled intermediate wave (3), then place a parallel copy on the low next to minor wave 4. The lower edge of this channel may provide support now.
HOURLY CHART
Click chart to enlarge.
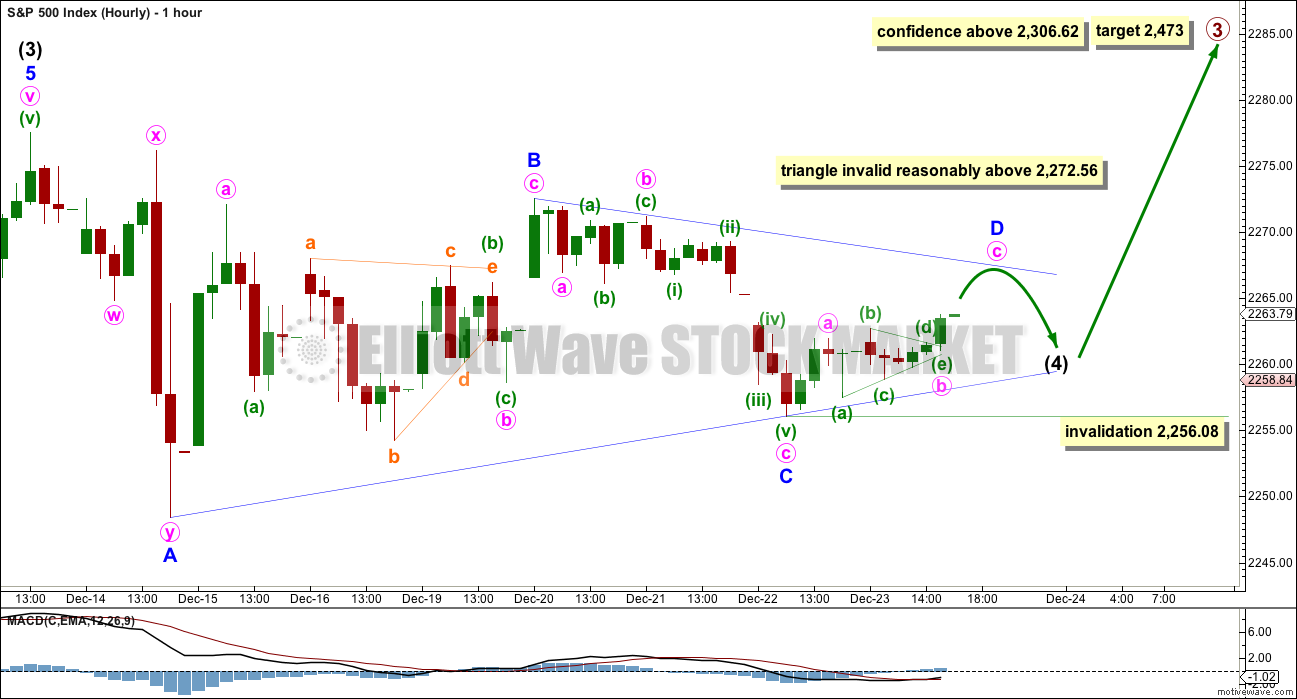
The triangle may still be at least two days away from completion. Minor wave D would be likely to end at the B-D trend line, as it is drawn, and it may sit along the highs within minor wave C.
Minor wave D, for a contracting triangle, may not move beyond the end of minor wave B above 2,272.56.
Minor wave D, for a barrier triangle, should end about the same level as minor wave B; a triangle will remain valid as long as the B-D trend line remains essentially flat. In practice, this means that minor wave D may end slightly above 2,272.56. This is the only Elliott wave rule which is not black and white.
Minor wave E may not move beyond the end of minor wave C below 2,256.08.
When the triangle is complete, the breakout is expected to be upwards. Intermediate wave (5) is expected to be a long extension if the target at 2,473 is to be reached.
A new high above 2,306.62 would see the idea of a flat correction continuing discarded, so some confidence may then be had that intermediate wave (4) is over and intermediate wave (5) is underway.
This first hourly chart has a higher probability than the alternate below. I would judge this main hourly chart to have about a 70% probability.
ALTERNATE HOURLY CHART
Click chart to enlarge.
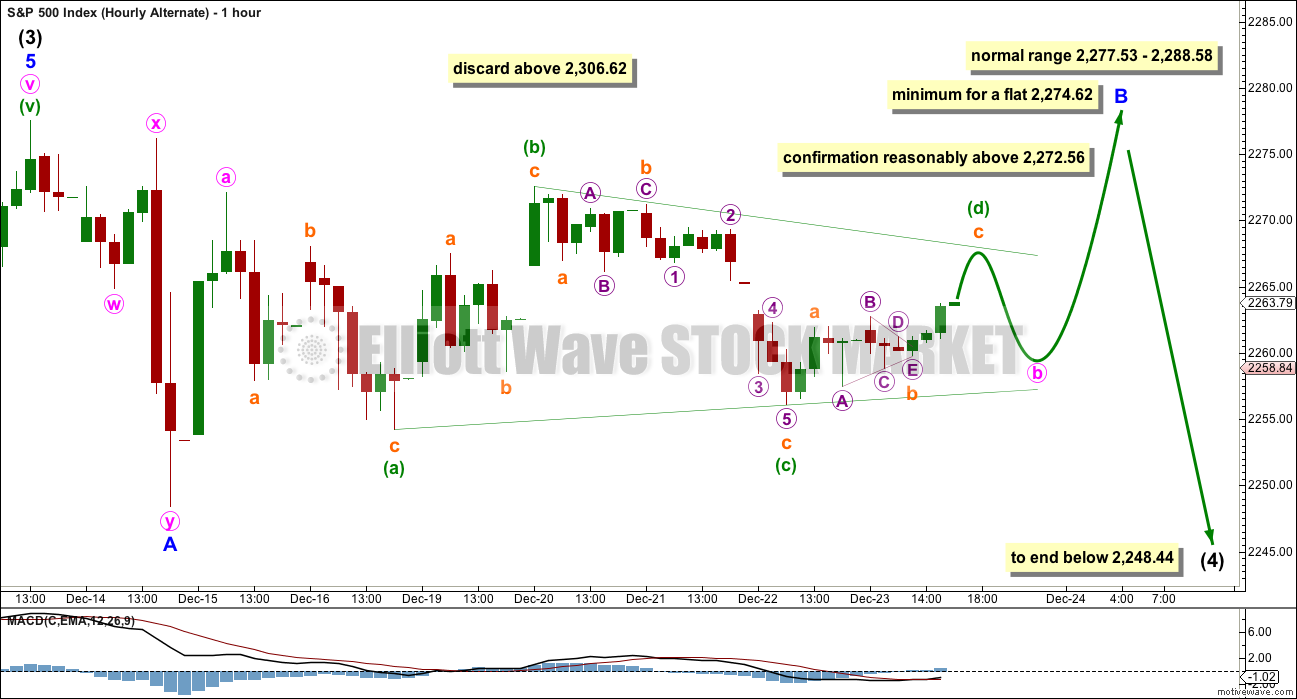
What if a flat correction is still unfolding?
Within the flat correction, minor wave A subdivides as a three; multiples are classified as threes.
Within a flat correction, minor wave B must retrace a minimum 0.9 length of minor wave A at 2,274.62. The normal range for minor wave B within a flat correction is from 1 to 1.38 the length of minor wave A at 2,277.53 to 2,288.58.
Minor wave B may be unfolding as a zigzag. Within the zigzag, minute wave b may be an almost complete running contracting triangle. In the short term, this wave count expects the same movement next as the main wave count.
There is no Elliott wave rule stating a maximum length for B waves within flat corrections, but there is a convention within Elliott wave that states when the potential B wave is longer than twice the length of the A wave that the idea of a flat should be discarded based upon very low probability. This point would be above 2,306.62.
TECHNICAL ANALYSIS
WEEKLY CHART
Click chart to enlarge. Chart courtesy of StockCharts.com.
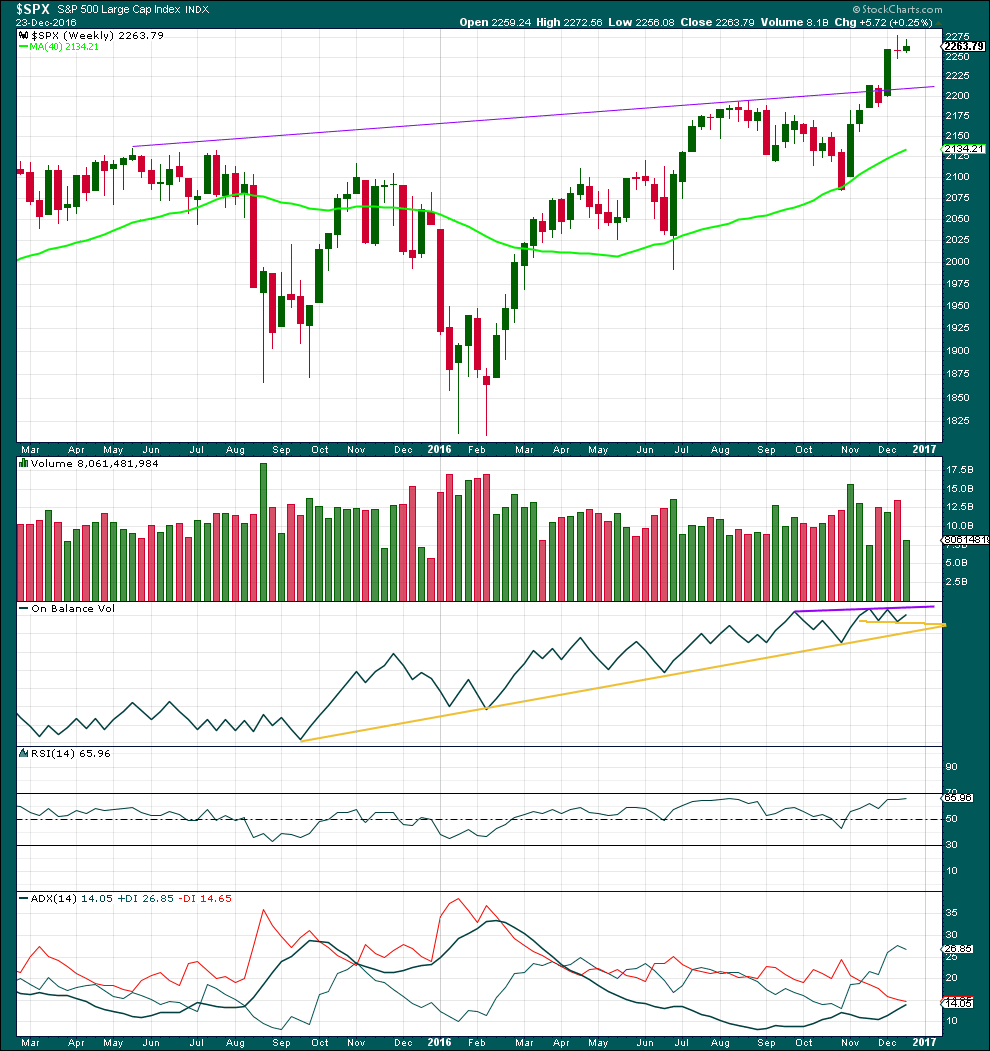
A small inside week moves price overall higher. Volume for this week is light indicating price was probably consolidating.
If price moves lower for a correction, it should find strong support at the purple trend line drawn across two prior all time highs.
On Balance Volume is still constrained. Watch this carefully over the next two weeks. If OBV breaks above the purple trend line, it would offer a bullish signal but not a strong one. The line is too short and infrequently tested to offer good technical significance.
RSI is not overbought. There is room still for price to rise.
ADX is rising and is below both the +DX and -DX lines. An upwards trend may be in its early stages. At this time frame, the trend is only beginning and is not at all extreme.
DAILY CHART
Click chart to enlarge. Chart courtesy of StockCharts.com.
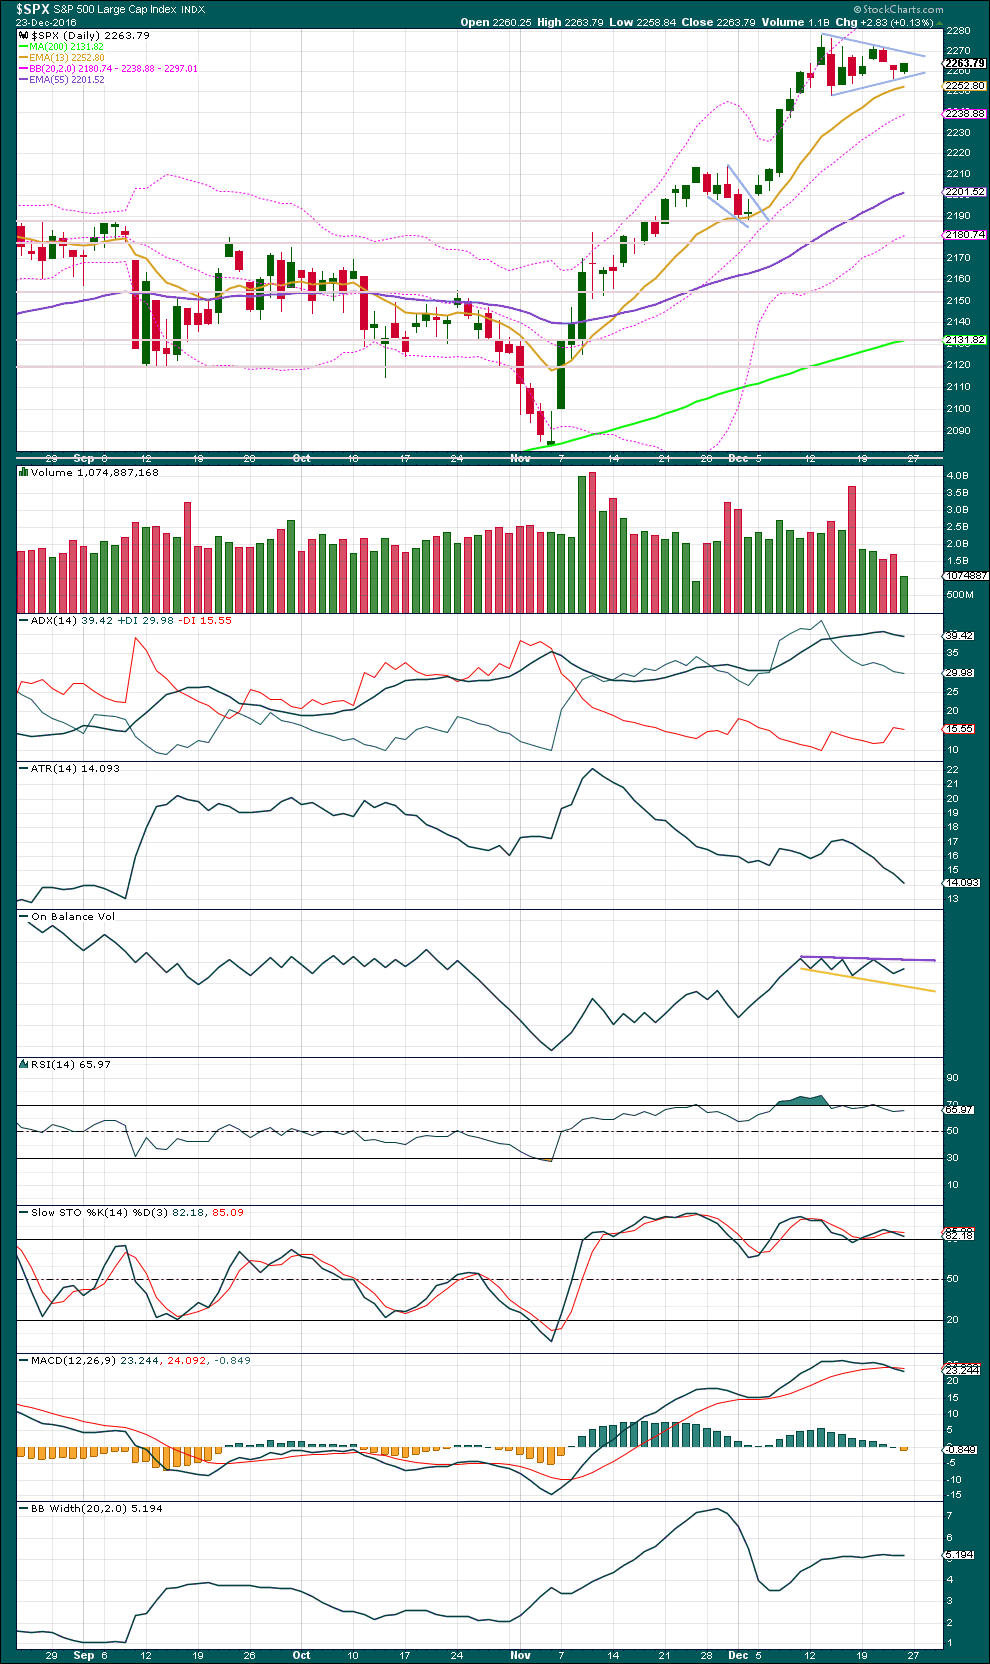
A pennant pattern is still unfolding. This one is supported by overall declining volume as price moves sideways. The target using the measured rule is about 2,359.
ADX is comfortably extreme above 35. It has reached above 40 and is now turning down. This would normally be an indication of an extreme trend coming to an end.
I have spent some time going back over the bull market on the daily chart to March 2009. During this time ADX has reached above 35 nine times:
– In May 2010 during a downwards wave.
– In January 2011 (just above 35). This was followed by a drop of 1.9% over two days.
– In August 2011 during a downwards wave.
– In February 2012: on 8th February ADX reached above 35 then slightly above 40 on 21st February, but price did not find a high until the 29th of February. Price then dropped 2.8% over four days.
– In June 2012 at the end of a downwards wave.
– In August 2012. This was followed by a drop of 3.9% over two days.
– In February 2013: on the 5th of February ADX reached above 35 and continued higher with price to find a high on 19th February when ADX reached almost to 39. Price then dropped 3% over five days.
– In May 2013: on the 22nd of May ADX was almost 40. Price then dropped 7.5% over 23 days.
– In January 2016 during a downwards wave.
Conclusion: A reading of over 35 for ADX is extreme, and a reading over 40 is unusually extreme. However, this is not necessarily useful in pinpointing a trend change nor does it provide useful information on how far price may drop. In other words, it cannot tell us when price will turn nor how far it may fall.
ADX at the daily chart level is sounding a note of caution here. At the weekly chart level though it is not; at that time frame ADX it is bullish.
ATR is declining as price has consolidated for the last eight sessions. Bollinger Bands are flat.
Stochastics is still overbought, but this oscillator may remain extreme for reasonable periods of time during a trending market. RSI is now returning from overbought.
On Balance Volume should be watched closely. It has found resistance at the purple trend line. A breakout by OBV may indicate the next direction for price.
The trend is up. All three moving averages are pointing upwards and price is above all three. The small pennant has brought price away from the upper Bollinger Band extreme. There is again room for price to rise.
VOLATILITY – INVERTED VIX CHART
Click chart to enlarge. Chart courtesy of StockCharts.com.
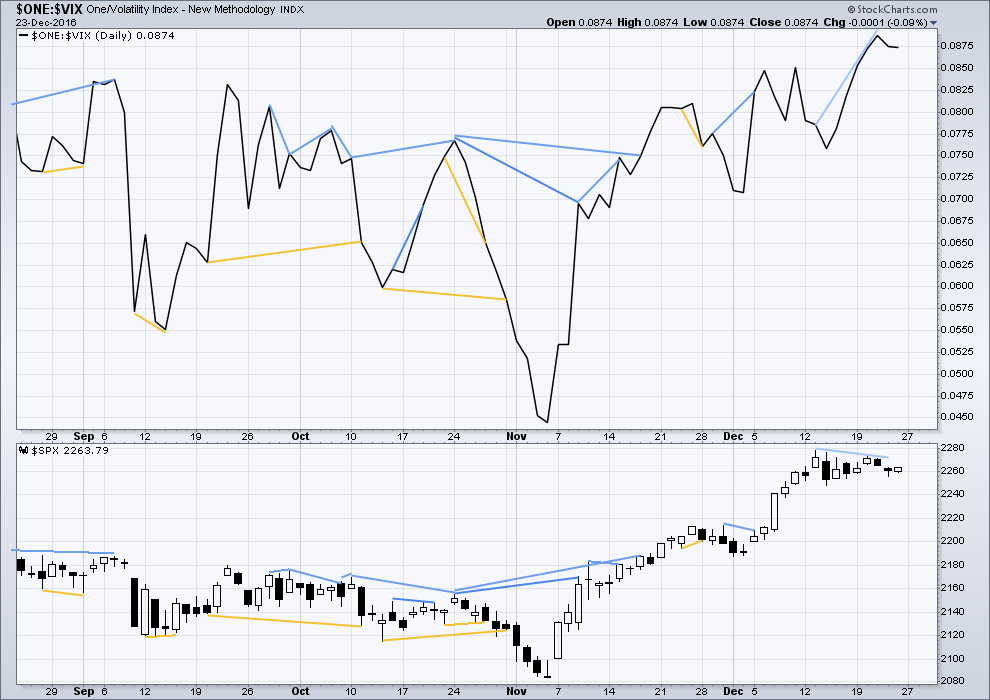
There are a few instances of multi day divergence between price and inverted VIX noted here. Bearish divergence is blue. Bullish divergence is yellow. It appears so far that divergence between inverted VIX and price is mostly working to indicate short term movements spanning one or two days. While this seems to be working more often than not, it is not always working. As with everything in technical analysis, there is nothing that is certain. This is an exercise in probability.
No new reasonable divergence is noted short term.
BREADTH – AD LINE
Click chart to enlarge. Chart courtesy of StockCharts.com.
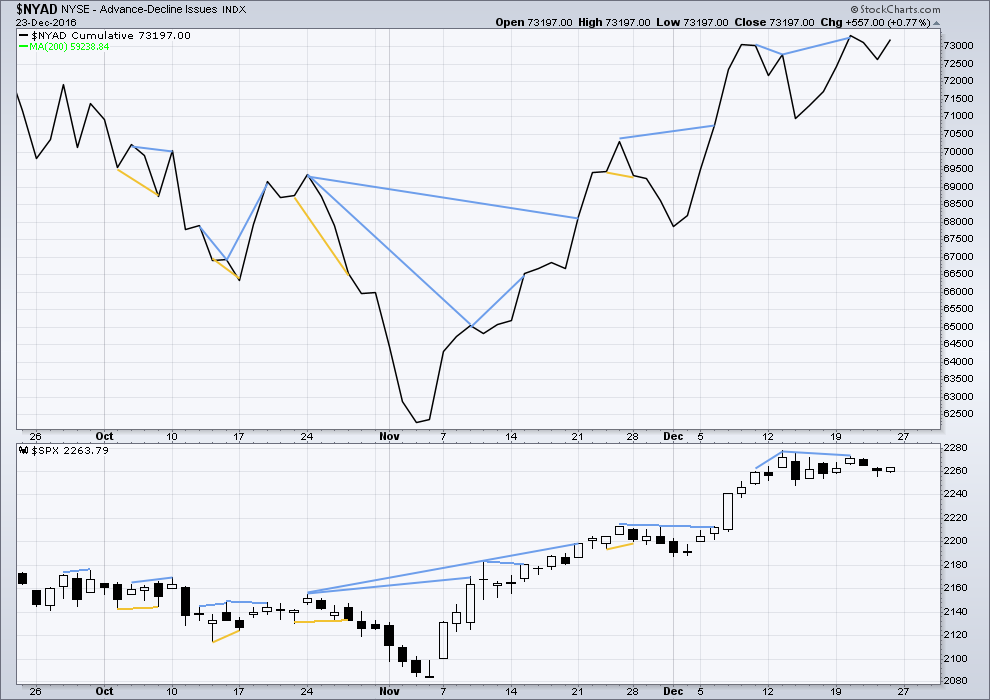
Short term bullish and bearish divergence is again working between price and the AD line to show the direction for the following one or two days.
There is longer term divergence between price and the AD line, but like inverted VIX this has proven reasonably recently to be unreliable. It will be given no weight here.
There is now new divergence today between price and the AD line.
DOW THEORY
The DJIA, DJT, S&P500 and Nasdaq have made new all time highs in December of 2016. This confirms a bull market continues.
This analysis is published @ 08:27 p.m. EST.
Hi, I’m wondering when the daily updates will resume? The last one I have is this one, December 23.
Hi Peter,
Lara has been on holiday the past two weeks. She has checked in several times with comments / updates. I think the daily analysis will begin again tomorrow.
Have a great day.
Thank you Rodney.
Peter, he’s spot on. Tomorrow after NY closes will be a full update with video.
I did not have a holiday for six years. After last year it became apparent that if I didn’t take one that I would have to close the website.
It’s in the FAQ and in the welcome email to all members that this website takes a holiday over the Christmas / New Year period. I chose this period because the markets are usually more quiet and NY is closed for at least two days.
I do own though that although I emailed the membership this year with dates, I should have posted it right at the top of the website. Next year that is how I will manage this.
Dear Lara,
I was not aware of last year’s situation you have described. You do not say what the issue was for you. But I suspect exhaustion or something like that. I am so glad you have taken this holiday and hope it has been helpful for you.
Certainly those who subscribe to your services are counting on you. But your family needs you way more. As a long term subscriber (5 years now), I continue to urge you to take care of yourself. Back in 2011 I had to take a long sabbatical because I allowed myself to burnout. I was exhausted, deeply depressed, suffered short term memory loss and more. I needed a five month sabbatical to recover. I did recover and have been able to continue in my career. The last five years have been some of the best in my life. Now I joyfully look forward to retirement in three years.
So please do take care of yourself. We care for you and your family needs you.
Best wishes for 2017!
Rodney
Wow, Rodney, I’m glad that you took care of yourself. Well done.
Lara, I am a new subscriber. I saw your notice of taking a break and I did not begrudge you that break. I know that’s necessary.
I was surprised, pleasantly, that you took the time to comment on SPX during your break. I appreciated it. And I hope that your time with your father and family was fantastic.
My Dad is 98. We are separated by hundreds of miles. I had not called him for many days but yesterday, I got him on the phone. I talked with him at about 1:00 pm and he was very happy. He had talked with my brother earlier that day. He had talked with me. He had just had lunch with his girlfriend. He was very happy.
Later in the day, at about 3:30, he had a stroke. He’s now in the hospital, stable but uncertain.
If yesterday was his last sentient day … that’s not a bad thing, in the greater scheme of things.
I am compelled to share that with you because it seems appropriate.
Take the time you need for yourself and your family and never apologize for it.
Thank you Lance. I am sorry your father has suffered a stroke. But I am really happy you had some time with him. I did not mention I am in the ‘people helping / caring’ field. I help many people in the dying process and am with them when they die. Your father has been blessed with a very long life and to have a girlfriend at 98! What more can a man ask? Take care.
By the way, I came home from the mountains a bit early in the middle of a ‘white out’. The snow was over my head in depth. It was really cold and I froze my little tush off. I hiked in over 7 miles with a pack and pulling a sled. The temps were below zero Fahrenheit. I am getting too old for such endeavors. I think from now on I will stay home unless it is a bit warmer. Ha Ha!
It looks like minor B has one final fifth wave up to complete it’s structure.
If I’m wrong then we shall know when the best fit channel here is breached. Clear downwards movement below the lower edge would see me label minor B as over.
I’ll be expecting minor C to move below the end of A at 2,233.62 to avoid a truncation and a rare running flat. Minor C is likely to be 1.618 X minor A in length.
This makes for a very interesting 11 days. I do not try to interpret the waves as you all do. I just read.
Lara expects minor C to get down to 2233. But I think that the irrational exuberance of the markets to continue leading up to Trump’s inauguration … so I’m keeping open the SPX short puts of Jan 18 2240 and Jan 31 2250.
but I do have buy stop orders in place, just in case.
FWIW, Peter Temple continues to label this move up in SPX as an ED. This would make this wave up the final C wave of an ABC zig zag for primary three. The implications are significant as the move down for a primary fourth as opposed to a minute C wave to complete intermediate four are not trivial. The fourth wave for an ED would have to revisit wave one territory which is quite a bit lower than just getting pass the end of the wave A of the primary three flat.
After much cogitation, I am going to make an important change to my approach to trading SPX. One important aspect of Lara’s analysis that I do not think I have been using effectively is her price targets. Looking back over the last several months this is one aspect of the analysis that one could easily overlook, especially those of us trading in short time windows. In addition to staying with the trend, and being disciplined with stop losses, letting profits run toward an anticipated price target is I think a very critical component of consistently profitable trades. I had overlooked that aspect lately because of how erratic the market has been of late and simply got tired of seeing profitable trades slip away when the market unexpectedly whipsawed a position, only to turn around and continue with the main trend. I think we have been seeing lots of flats and zig zags in the markets lately and I am starting to think that it may be more effective to enter trades with a bit larger time horizon in mind. This is the approach I know Rodney has recently taken and I think it is the best way to approach the current market environment.
With this in mind, I will be paying very close attention to any possible corrective wave C in Lara’s next analysis, and particularly when it would be expected to terminate.
That’s exciting Verne. I’ll be watching closely.
I too much prefer to trade over a longer time frame, but recently I’ve been taking profits more quickly.
It turns out that I’m okay at finding an entry, but exit is my weak point. Too often I’ve held onto a winning trade only to see it turn into a loser. I got sick of that and have recently been holding my trades for only one to a few days.
Thanks for sharing that. I’m new to this so I share my approach of using Lara’s targets with a little hesitation.
My approach is to use put credit spreads and iron condors with a 10 to 21 day window. I prefer shorter duration since options offer the best payout at expiration. I like getting 11 to 12% return in that time frame.
I use Lara’s price targets as the basis for choosing the option strikes. I’ll establish the short option well away from Lara’s expectation of the SPX level.
For example, Lara wrote on 12/23/16, when SPX closed at 2263, that she expected the SPX pennant pattern to complete on 12/30/16 and then go up. On the hourly chart, she indicated invalidation at 2256.
On December 27, the first day of trading after the holiday, SPX was at 2271, and I opened a Put credit spread of January 11 2017 that was long the 2215 and short the 2240, well below her invalidation number. The maximum Return on Risk, if SPX closed above 2240, was 15%.
On 12/30/16, when SPX touched opened at 2251, and touched 2233, I was nervous. But did not act. Because Lara expected a dip and a bounce. And there was bounce. On 1/3/17, SPX gapped up and has stayed up.
I closed that spread on January 6 when SPX was at 2275, realized a 13% Return on Risk.
That’s how I’m using Lara’s targets.
Still looking at IWM and very interesting that it failed to join the other indices in making new highs. Any thoughts?
Quick question for Lara. If we are seeing an expanded flat for wave four, does the C wave have to go past the end of the A wave? I think that is the case but I am not certain. Can we also expect a fib ratio for A and C?
Yes, C should move past A. Otherwise it’s a running flat, and they’re very rare.
When B is over then I’ll calculate a target for C. It will be 1.618 X A.
My short term update from my EWI subscription ends this month and they have an alternate count that sees this current move up as an ongoing b wave of an incomplete flat for wave four. If that is the case a final c wave down to complete this fourth wave should be next.
if anyone’s interested…
I closed two of the SPX put credit spreads
I modified two SPX PUT credit spreads by adding CALL credit spreads to create Iron Condors. All actions are based on my interpretation of Lara’s targets. Frankly, I added the Call spreads because of everyone’s expectation of a decline … wanted to cushion any blow to the put spreads. But I expect the market to go up so I established the Short calls above the higher target range.
Jan 18 Condor:
Long the 2230 Put; Short the 2240 Put; Short the 2300 Call; Long the 2310 Call
Jan 31 Condor (I usually don’t go out this far but it has a good risk/reward)
Long the 2225 Put; Short the 2250 Put; Short the 2300 Call; Long the 2310 Call
Nice call on the puts. When they go in the money I like to close out the short side of the put spread and keep the long side when we are so close to an expected top and reversal. Its nice to get paid to make a trade! 🙂
SVXY penetrating its upper BB for the third day in a row. RTM trades have not been kind to traders of late but the Jan 20 expiration 104 puts at 3.30 appear to be a good reward/risk ratio. SVXY should move down to around 95 after descending below the upper BB making those puts worth at least 9.00
Got filled on order. Looks like we head toward higher target of 2294.22…
Getting close to minimum target of 2273.34
Opened STC order on small contingent of SPY Jan week 2 calls picked up yesterday for 0.78. Trying to sell for a buck even.
This works with the new daily wave count. It’s published as alternate below in comments, but it’s going to be the main wave count.
A little more up for minor B. Then down for minor C.
Minor C to find support at the purple trend line on the daily chart. That is the most important bit of TA on that chart. If price comes down to touch it then we have a gift from Mr Market.
Here’s the daily chart:
Note the purple trend line. Keep drawing that on all daily charts. When minor C is underway I’ll copy it over to the hourly chart.
That’s weird. My daily chart comment was in moderation.
It’s my website. I’m admin. What on earth is that all about? Moderating my own comments now LOL
Just a note to mention – this count meshes perfectly with the longer term Hurst cycles – which predicts the downturn to arrive around the 6th-8th January.
I am curious if any one has looked at the chart of IWM. It also had a clear five waves down and what looks like a second wave bounce so there may be some divergence with SPX in terms of the wave count….
I’m looking at IWM on StockCharts, hourly.
It’s a mess. All I can see is a big sideways move that began back on 9th December.
Thanks for the update Lara. I had no idea what to make of the long slow move up off what I had pegged a C wave down, at minor degree instead of a minute C of A. I am so glad we have an expert in house! 🙂
Perhaps a double ZZ for a second wave?
Maybe an impulse down is already over. This move up looking a bit out of proportion for a minuette four.
Looks like we are tracing out a five wave impulse down on the 15 minute chart.
We may be just starting the fourth wave and then we should have a fifth wave down. Considering how far we are from the purple line and how complacent everyone is this could be just minute one down.
Despite our misgivings about Mr Market’s magnanimity, it does look as if he will indeed give us a magnificent opportunity to go long at the end of this C wave down. Lara is quite right. He is generally very stingy in this regard. The current move down will serve to dislodge a few of the over-eager bulls and relieve some of the extraordinary market complacency we have been seeing. Look for support at Lara purple trend line.
Continuing my “out of the box” musings.
Everyone is bullish. I mean everyone. There are no exceptions.
There is universal acceptance of the fact that DJI will inevitably pierce 20,000.00, and perhaps even 21,000.00
Heck, even I believe it.
Take another look at this long term chart of SVXY. That is an important trend-line and we are smack right up agin’ it as it were.
Notice what eventuated the last two times we were in such rarefied air.
I cannot help but wonder with all this bubbling bullishness we are experiencing…what if the wave up is one degree higher and we end up with a truncated fifth wave…??!!
I know…it is quite far fetched and nothing about the wave structure suggests that any such thing is afoot. Nevertheless…all this bullishness and stunning complacency, historic in its extremes, does make one wonder…. 🙂
My Dad is visiting for 3 nights as of tomorrow and I have not seen him in 2 years. Once that’s done I’m going to spend some good time on the S&P charts.
I agree Verne. Something may be afoot. And I don’t want to be caught out. I’m going to sit outside in my garden with the birds and ponder as many “what if’s” as I can. Starting with blank charts and seeing what happens from there.
But the other thing I have learned over the years is that bubbles and bullishness can continue for much longer than anyone ever expects, in fact they do tend to continue for much longer. They extend, expand and infuriate.
I’ll also update here in comments my summary of Lowry’s weekly update. I find them really helpful in my analysis.
Lara,
I wish you and your dad a most enjoyable visit. Make fond memories that will bring joy to your heart in years to come.
Will you take him surfing?
Ha ha ha ha ha My dad on a surfboard, now that’s hilarious 🙂
No, I don’t think so. The ocean is flat now here anyway.
We will take him bush walking, there is some beautiful forest and a pretty waterfall.
Verne, I’m trying to replicate that trend line. I’m assuming this is the S&P500, but the candlesticks don’t look the same as my weekly chart and it doesn’t look like daily… what exactly is this chart please?
Sorry about not labeling that one Lara. It is actually a chart of SVXY, the Pro-Shares VIX short term futures. It is saying that absolutely no one expects the market to be lower anytime in the near future.
Okay, no worries 🙂
Thanks for the chart and thoughts Vern.
AAII has the current weekly bullish sentiment at 46%, bearish at 25% with 29% neutral. November 24 was 50% bulls and 22% bears.
While it is certainly possible we have a black swan event that starts off a bear market, we cannot predict such an event. It is in the definition of a black swan event that it comes out of nowhere and no one expects it. So barring such an event we are stuck with what we can foresee.
In his YouTube videos, Chris Ciovacco has shown over the past several weeks, when we’ve had technical patterns and situations in the past that are similar to today, good things have happened in the markets. That does not mean the result will be the same. It does mean we have favorable conditions.
Your caution is good (for all of us). I have repeatedly learned that overconfidence and greed can kill an account (like early summer 2016 did to me!). But equally fear can create inaction. We must be on guard for both.
Right now, I am going to let my positions ride looking at the markets from a daily to weekly perspective rather than short term trading. I have plenty of dry powder should the SPX visit that purple trendline now around 2215.
Tomorrow morning I leave for a snowshoe camping trip in the mountains and deep snow. This morning the low temp was -25* F (-32* C). Tomorrow should be a bit warmer with temps rising through the weekend. I’ll be back early next week hopefully with all my fingers and toes!
Blessings to all.
I forgot to mention, I will not see any bears! They are fast asleep in their winter dens covered by five feet of snow. Seems to me, it is the same for the bears on Wall Street.
Crikey, that’s ridiculously cold Rodney!
Enjoy 🙂
Here is another reason to be cautious. A few weeks ago I posted a long term chart of SVXY and a line connecting the previous two major tops suggested a move to around 100. We hit that today with another upper BB penetration.
I know it seems as if reversion to the mean is a concept of a by-gone era but this is at least noteworthy.
okay, here are the positions that I’ve put in place recently. By the way, I’m rather conservative and don’t try to hit home runs. I’d rather hit a bunch of singles and doubles, trying to earn between 10% and 20% return on risk (i.e. gain divided by maximum possible loss) in one to two weeks. And I’d rather receive money up front rather than wait for a payoff.
I primarily do Put Option Credit Spreads on the SPX. I’ll provide below the option expiration date, index level when position opened, the Long Put Strike Price, the Short Put Strike Price, # of contracts, the credit received and the maximum Return on Risk (ROR). And if the spread was closed, the result.
I”m figuring out how to interpret Lara’s analysis and integrate it into my strategy.I have had some losers. Lost on a call debit spread on the SPX. and lost $1,400 on a put credit spread on SPX as well. But I’m winning more often than not.
I do not pretend to be an expert but I do work on this a lot. I’m happy to share ideas. And to receive them as well.
recently expired or closed:
December 21 option (opened december 15)
SPX at 2262 when opened
2225-2235 Put spread
20 contracts
credit of $2,200
max potential loss of $17,800
ROR of 12% in 1 week
expired with SPX out of the money, realized full profit
December 28 option (opened december 19)
SPX at 2263 when opened
2225-2235 Put spread
20 contracts
credit of $2,000
max potential loss of $18,000
ROR of 11% in 10 days
expired with SPX out of the money, realized full profit
January 4, 2017 option (opened december 20)
SPX at 2270 when opened
2225-2235 Put spread
20 contracts
credit of $2,200
max potential loss of $17,800
ROR of 12% in two weeks
expired with SPX out of the money, realized full profit
still open:
January 11, 2017 option (opened december 27)
SPX at 2277 when opened
2215-2240 Put spread
credit spread of $3.30
maximum possible ROR of 15% in two weeks
January 18, 2017 option (opened january 4)
SPX at 2271 when opened
2230-2240 Put spread
credit spread of $1.55
maximum possible ROR of 15% in 2 weeks
January 31, 2017 option (opened december 27)
SPX at 2272 when opened
2225-2250 Put spread
credit spread of $6.05
maximum possible ROR of 32% in 5 weeks
If no one is interested in this, I won’t post this type of stuff anymore.
By way of suggestion Lance, I think a briefer summary of type of trade, entry price, and if you choose trade size would be a bit easier to digest. For example when I post my spread trades I would say Jan week 2 SPY 220/225 bull credit spread @ 1.10 per contract -25 contracts and folk would get it.
I generally post at the time of entry and also when I close the trade out.
Well, after seeing Lara count with which every instinct and fibre of my trading being agrees with, I went ahead and sold an equal number of SPY 227 calls against my long position. She posted that just in time to boost my faltering, lingering bearish musings. Thanks Lara!
Now if we get a sharp C wave down to complete wave four that would be the absolutely biggest fattest slowest pitch over the plate that I have seen in a long time!
Much happier holding that spread, thank you very much. 🙂
just wanted to give Lara credit. At the top of her technical analysis, dated December 23 (above), she said this:
“Summary: A small pennant pattern may be completing and may end on the 30th of December. The breakout should be upwards…”
After Christmas, SPX opened at 2266. On Friday, Dec 30, the market touched 2233 and closed at 2238.
On Jan 3, SPX opened at 2251 and now it’s at 2270.
Nice analysis, Lara!
I offer that as a preface to this question to Lara: does your analysis lead you to expect a drop to the purple line (which looks to me to be at 2220 or so) ? And is that expected to be within the next few trading days?
Thank you 🙂
I’m changing the wave count to the new one I published below here in comments. So I’m expecting now this correction to last longer, and yes, to get down to the purple trend line.
I am joining Rodney on the long side via SPY 227.50 calls. Looking for the ETF to make an intra-day high of at least 229 this week. Have a great evening everybody!
If this is a correction continuing (this is my new wave count at the daily chart level, and I do prefer it) then upwards movement today and yesterday was wave B.
Wave B will be 0.9 X wave A at 2,273.34. So tomorrow may open with just a little more upwards movement to at least 2,273.34. It may even make a new ATH.
If intermediate (4) is a flat correction then the normal range for minor B is 1 to 1.38 X minor A: 2,277.53 – 2,294.22.
When minor B is complete then minor C down may end when price touches the purple trend line.
That would be my expectation of how price may behave in the next few trading days.
Intermediate (2) was a double zigzag lasting 58 days, 3 more than a Fibonacci 55.
Intermediate (4) would most likely be a flat, combination or triangle. A Fibonacci 34 or 55 days seems reasonable, so my labelling of minor A as complete may be premature. It may still be unfolding as a flat correction.
For now the little more up followed by down to the purple trend line will be the expectation. If price does touch that trend line then it would offer a very good low risk, high reward set up to go long. It would be a gift.
Which means Mr Market probably won’t give it to us 🙂
Yikes! That is exactly what I was thinking but I went long a few minutes ago. Let’s hope if that count is right that we get a move up tomorrow before wave C down commences.
I am SO glad I only did one half full position.
I fully expect the bull to buck me off tomorrow! LOL! 🙂
Do the users of this site want to discuss trading that’s being done based on Lara’s research?
I won’t inundate you with details if this not of interest.
I’ll just offer that I’ve been doing Put Credit Spreads on the SPX for the last few weeks, with more success than failure. And I have four Put Credit Spreads opened for January.
I think that’s a wonderful idea. Verne already does a lot, and more members sharing their trading ideas can only benefit everyone.
Thank you for your generosity in sharing Lance.
Lance I have tried very hard to get other members to do just that but it got a little lonely out there! 🙂
There is tremendous value in being a part of a trading community as multiple orders being placed simultaneously gives participating traders a distinct advantage over the MMs and reduces the chances of getting ambushed. I was absolutely amazed at what a big difference this makes when I was trading with a Chicago trader and his posse a few years ago. Absolutely amazing. Go for it!
Move up today eliminates a 1,2 count but not a B wave correction. Did not quite hit 2272.56 but came close…can SPX do it?
I don’t think we should completely discount the possibility of a continuing fourth wave with a B wave now in progress. Bull markets generally do not make it easy to just sit comfortably while the bull is running and I am still expecting a buck or two before the top of this move. 🙂
My thoughts exactly. Yesterday’s downward price action following the morning high looks like a clear five on a five-minute chart. Makes me wary about going long today.
EWW just broke critical support. With all the nationalistic rhetoric coming out of the president elect I think Mexico is going to be in a world of hurt when it comes to the American manufacturing foot-print in the country. I suspect things are going to get worse. After all, when geo-political winds start to blow, it is inevitable that some economic feathers are going to get ruffled.
Following up on a Lara reply on 1/3/17 at 12:42 am to a Verne comment:
“Thanks for giving a great clue, Vern. Like you said, if we do print a green VIX today [meaning Tuesday January 3], then the correction may not be over. I am guessing we will not print a green VIX.”
Did we ‘print a green VIX’ yesterday, January 3? I don’t know how to find that on my software.
If we did not print a green VIX yesterday, then is the correction deemed to be over, especially with the behavior today of SPX being up 8 pts to 2266 as of 10:54 am ?
Thanks.
I think it was Rodney that correctly opined that VIX would not print a green candle and indeed it did not. I does look like the fourth wave correction is over and the fifth wave of primary three is underway. I am scalping the upward move with SPY 225.50 calls and sold initial batch this morning. I am looking for a good entry price for the 226 calls expiring in two weeks currently bid at 1.89/1.90 We should hit SPY 230 before this fifth wave up completes.
A new SPX swing high above yesterday’s high of 2263.88 is another point of confidence that the 12 day correction starting mid-December is over.
It looks like a few minutes into the opening we have the new swing high. 2278 is next for full confidence.
We might even already have had a trend change – and this is a 1-2-1-2.
The problem I have with this count is the end of primary 1.
Intermediate (4) effected less than a one point retracement of intermediate (3) and it looks a bit odd.
Intermediate (5) is extremely short.
All rules are met, it’s a valid count. Much of the subdivisions are the same for both counts, it is up in the end of primary 1 (on this chart) that there are material differences.
The purple trend line is the most important piece of TA on both charts.
You are supposed to be relaxing and surfing!
I do appreciate your updates, however.
LOL
Don’t worry, I am doing plenty of surfing. Not so much the relaxing.
Surfed every day so far this week, milking a dying ground swell for all it’s worth.
Now off for a second session…. 🙂 🙂 🙂
When I zoom out I keep wanting to label cycle V like this.
I will either publish this as an alternate or it may be the new wave count. It resolves some problems I had with the wave count published in this analysis above. Specifically a strange looking triangle for a fourth wave and a remarkably short fifth wave at intermediate degree.
It makes no difference to the final target. Will publish a zoomed out chart for the main count next so you can all see the difference.
If this count is right then intermediate (4) could reasonably continue for another couple of weeks and come down to the purple trend line.
So now these counts differ. The main count would expect the correction must be over, as Rodney notes it’s long in the tooth already.
But this new idea can see it continue for longer, and indeed that would give better proportion.
For this new count I’d move everything within the correction down one degree, a zigzag down would be only wave A or W of a flat, combination or triangle.
Now a couple of days of upwards movement for wave B or X.
Difficult for me to figure out what is going on with today’s move. It does not at look like the start of an impulse wave up. The move down really is quite deep for a second wave in an impulse higher. Volume has picked up a bit so maybe it is just slow getting started….
I think this second chart with primary one ending earlier has a really good look. It does allow some more room for intermediate to develop as a combination of some kind.
Yeah, I agree Verne. It does look better than the current count.
If VIX prints a green candle today, I will be looking for another zig zag to the downside to deepen this correction. It would be very typical of a continuing bull run to shake loose a few over zealous bulls prior to the next wave up. I am not sure what EW rules say about the mandatory zig zags in EDs and whether or not doubles are permitted but I am also keeping that possibility in mind.
Certainly a double zig-zag or combination is possible. But this intermediate (4) is long in the tooth especially when compared to intermediate (2). I think a double ZZ would make (4) out of any reasonable proportion to (2) giving us something that does not have the ‘right look’.
Thanks for giving a great clue Vern. Like you said, if we do print a green VIX today, then the correction may not over. I am guessing we will not print a green VIX.
It sure would be nice to get some clear direction. On the matter of proportion, if we were seeing and ending diagonal and moved the label up one degree then wave four should go back into wave one territory. I think you are right and the market is just gathering up a head of steam for the run higher. Let’s see how things look at the close.
This market continues to be remarkably unpredictable. I too was convinced the correction was over and had a limit buy order at the open that did not get filled as we gapped up. We are now giving back most of this morning’s gains and I am starting to wonder if we are seeing a double ZZ in process with another ABC leg down to deepen the correction. Anyone going long at the open is already underwater and even for those pre-positioned we are now well off the day’s highs so if profits were not quickly taken they have evaporated in a jiffy. This continues to be a schizoid market it seems….
At the open, the yellow channel line (mentioned in Lara’s update below) and the 2253 level have both been decisively broken. This gives some confidence the correction, whatever it was and whatever degree it should be labeled, is over. This is confidence not confirmation. The confirmation comes on a new ATH, 2278+.
The extreme overbought conditions have been relieved somewhat by the most recent correction. An example is the daily MACD. We now have plenty of room for a move to the upside. Even ADX has moved down. VIX should move down away from the upper BB.
All that being said, I am still keeping some powder dry in my long term account.
Have a great day everyone.
Thanks for the updates Lara and a Happy New Year to you!
Can I ask a question please? To save trying to pick tops and bottoms I try to wait for confirming price action e.g. a five wave move followed by a three wave correction, before entering. My question is at what timescale should one do this – 5 min or 1 hour? I guess the higher the time frame the more confidence is to be had?
Hourly at minimum.
And even then it could be a 5-3 of A-B-C.
Updated daily chart:
This correction looks now to be too deep and time consuming to be intermediate (4). For this reason I have an alternate I’ll publish next.
I’m zooming out to show more detail so members can compare this main wave count with the new alternate.
If intermediate (4) continues lower expect very strong support at the purple trend line. If price again touches that line I will enter long, and I’ll enter a large position. For now I am not confident that this correction is over, and I am aware that this wave count for the S&P expects upwards movement as does my wave count for Gold.
These markets are not always inversely correlated. Sometimes they move together. But they have been inversely correlated in recent months, so at this stage we should really expect that to continue, until it doesn’t.
I have more confidence in my Gold wave count at this time than I do in this S&P wave count. I am suspicious that price is going to continue down for the S&P to the purple trend line, while Gold moves upwards.
Updated hourly chart:
It is possible that the correction could be over, but equally as likely that minor C is not over, hence the big question mark.
A little confidence in a trend change may be had above 2,253.58; at that stage upwards movement could not be a second wave correction within a final fifth wave down.
A little confidence in a trend change may also be had if price can break above the gold channel. Expect some resistance at the lower edge of the blue channel. If price can break above that line then more confidence in a trend change can be had.
At this stage I do not have any confidence that downwards movement is over. I will be waiting and watching to see if it continues down to the purple trend line. That line is probably the most important of all trend lines: draw it from prior all time highs of the 20th May 2015 at 2,134 to the 23rd August 2016 at 2,193. On a semi log scale on the daily chart, extend it outwards.
That purple line is paramount. Some other indices have already broken similar support level (NQ’s). If that level does not hold we may about to see big zig zag down per the ED idea for SPX. I think 2210 is critical to any immediate bullish potential.
The last time we saw VIX pinned to its upper BB was back in October 28 to the November 4 low. This resulted in a roughly thirty point decline in SPX. If VIX stays pinned to its upper BB on Tuesday we could see SPX go down to 2210 or thereabouts to complete this fourth wave. If the decline is just about done we should see a red VIX candle on Tuesday followed by one more upper BB penetration on Wednesday to signal the end of the current correction.
Another quick note. John Carter pointed out that the last three years we have had a strong run-up in the market at the end of the year and the first few weeks of the new year sees quite a bit of reversion to the mean price action. There are a number of other signs in the market that suggest to me also that we may see some additional weakness (failed break-out in the Qs for example). If you are already long in anticipation of a fifth wave up for P3 you may have to exercise a bit of patience for this fourth wave correction to complete but may get stopped out. If we break 2210 we may have to consider that a fourth wave one higher degree is already unfolding. VIX should give some good indication next trading session as it is already kissing the upper BB and should re ready to reverse. A continued penetration of that upper BB and we could be looking at developing price extreme opposite to what we saw during the recent wave up.
Someone recently asked me about John Carter and he will be giving a free seminar on what to expect in the markets for 2017. For those interested here is a link to sign up.
I don’t know if he will offer any of his courses at the end but they are definitely not hard sell guys and he is one of the best in the business in my opinion. These free ones fill up very quickly so don’t delay if you want to attend.
https://simplertrading.clickfunnels.com/webinar-registration11325969?utm_source=email&utm_medium=link5&utm_campaign=webinar_shift
Here is wishing all EWSM members a healthy, happy and prosperous 2017!!
VIX moving above upper BB today. It should ordinarily signal an impending reversal, but there is an undeniable wrinkle to be considered. The theme of late has been a continuity of extremes of price action. I think I earlier mentioned that this kind of distortion could easily obtain for market moves in BOTH directions. The destruction of price discovery can also make reversals at the end of down-trends depart from normal behaviour.
Cannot help thinking we are in the wrong degree here. I think we could possibly be starting Primary 5 now and not Primary 3. Especially as the FTSE looks pretty tired and looks to be in an ending diagonal.
This would imply a much deeper move for the current correction. It did occur to me that if we were starting a new bull run the market would first buck off a few riders. This is what genuine bull markets do and why I maintained my long volatility positions.
2245 SPX target essentially reached. I purchased 1/2 of my long position in small to mid cap equities.
I continue to respect the predictive power of round number price action. I lightened my long volatility positions on the recent move down but I will not be going long until I see a close above DJI 20K on high volume.
I shouldn’t be working, I should be surfing. But I want an entry to go long here.
I think my analysis of minor A must be wrong. It must have been a five, not a three.
At the target minor C = minor A. As soon as minor C moves below A then it’s no longer truncated.
Minor 4 has overshot the channel. When it’s over redraw the channel: first line from 2 to 4, then a copy on 3.
Thank you and I hope you do plenty of surfing.
I too am eyeing the price around 2245 for an entry on my long term account (non leveraged by design to reduce risk). My mental stop will be around 2210. At least that is my thinking now.
Thanks again Lara. I am about a week and a half from my winter mountain excursion. The place I am going has about 5 feet of snow on the ground. Snowshoes required!
UVXY made yet another 52 week low today and reversed strongly off that bottom. This is generally quite bullish for volatility short term and we may see a quick run to at least 10 or thereabouts before the fifth wave up gets going. It printed a bullish engulfing candle today.
Surfed 1.5 hrs yesterday (but to be fair I had a virus) and just over 2 hours today. Forecast is looking good for mid next week….
Surfing my little heart out 🙂 🙂 🙂
So jealous! Winter weather here in Illinois. It is time for a trip to my beloved BVI methinks! 🙂
I’m jealous, we had some chest high a frames with strong offshores here in FLA, gotta quick lunch break sesh. Looks like South Island will have couple back to back swells near term.
The SI here in NZ has had swell… not sure you meant SI of NZ Chris
My sister lives there in Dunedin. Cesar will surf there, but I won’t so far. Too darn cold!
Am enjoying small waves on my 1960’s retro Dunlop 9’9″. The thing’s a tank; catches everything but can be lethal 🙂 I’m up for the job!
But on a more serious note…. tomorrow (my time) the day before market opens Cesar and I will go over charts together and I’ll post any opportunities we see here. Want to make some money next week, as I’m sure we all do.
May you all be having a lovely New Year
Yep. This is the move down that I have been waiting for and I do think it is a C wave. Now a fifth up to complete P3.
For the main count, the slight overshoot of the B-D line can be accepted, but not the drop below the Minor C point at 2256.08. This means the main hourly is invalidated and the alternate hourly is in play.
In this scenario, the strategy will be to go long at 2248.78 for Intermediate 5 followed by one more play for Primary 5, to end at 2500.
Alan, as per Lara’s intraday chart yesterday (12/28), her preferred or main hourly count is that we are completing Minor C of Intermediate (4) with a target 2245. It looks to me that the alternate hourly count is no longer in play.
Like you noted, this would be followed by Intermediate (5) of Primary 3 with a target of 2473. If correct, this is a projected upside move of 230 SPX points or just over 10%!
The move to 2473 would be followed by a Primary 4 correction then the final move of Primary 5 and Cycle V to top out at SPX 2500+. This entire scenario has been in play since we crossed 2134 several months ago when no one could believe it. Great work Lara.
think we might have just finished the triangle?
good question. I’m a newbie.
SPX touched 2254 which is below Lara’s “invalidation 2,256”.
In that case, what does one expect now?
Does crossing the invalidation mean that the hourly chart should be discarded and the alternate hourly should be picked up and trade accordingly?
Is the invalidation number a support level or a ‘run for the hills’ number?
thanks.
Lance