
Upwards movement was expected for Tuesday’s session.
Summary: There is an upwards trend in place, but it is becoming extreme. Use the narrow channel on the hourly chart; while price remains in the channel, the target for intermediate wave (3) to end is at 2,280 – 2,282. If price breaches the lower edge of the channel with downwards (not sideways) movement, expect a brief shallow pullback has begun. Corrections are an opportunity to join the trend.
Last monthly chart is here.
New updates to this analysis are in bold.
WEEKLY CHART
Click chart to enlarge.
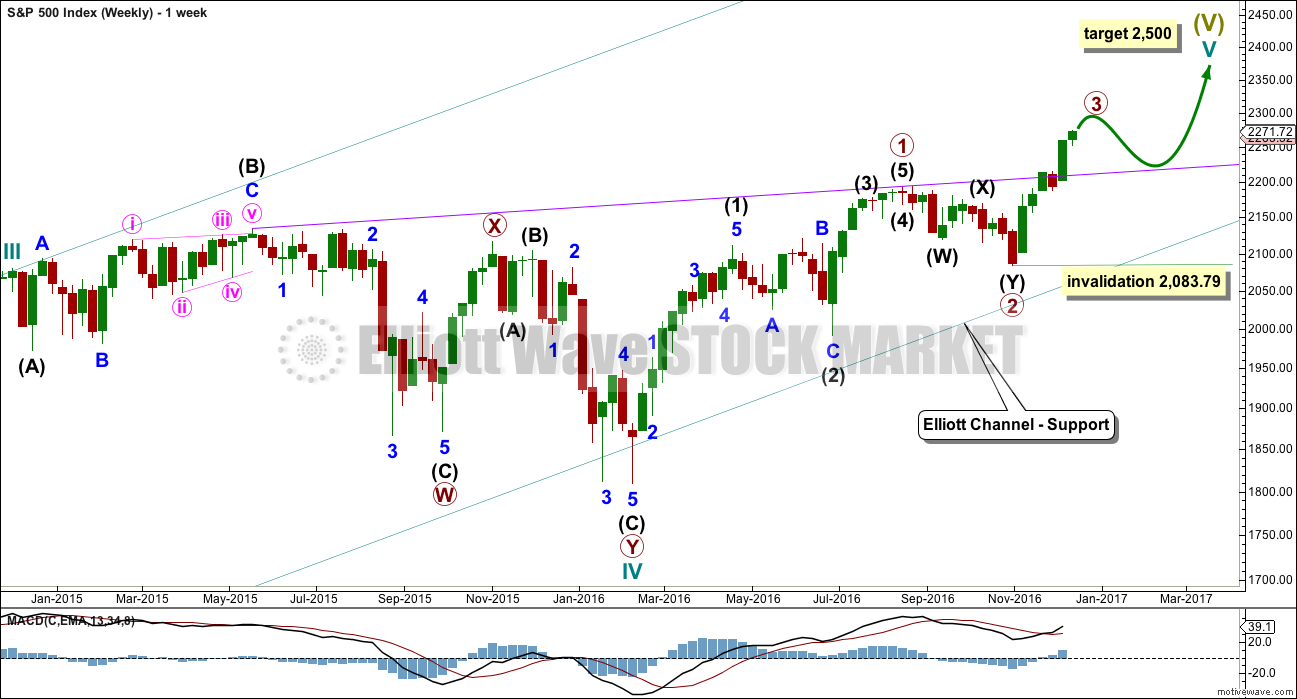
It is time to update the commentary for the weekly chart and take a step back to look at the bigger picture.
The teal channel is copied over from the monthly chart. If price gets down that low and if primary 4 is a time consuming sideways movement, then it may find support finally there.
A new trend line is added in purple. This trend line across prior all time highs has last week been breached. When primary wave 3 is over, then primary wave 4 may come down for a back test of support at this line. This line will be copied over from now to the daily chart.
At 2,500 cycle wave V would reach equality with cycle wave I.
Within primary wave 3, no second wave correction may move beyond its start below 2,083.79.
DAILY CHART
Click chart to enlarge.
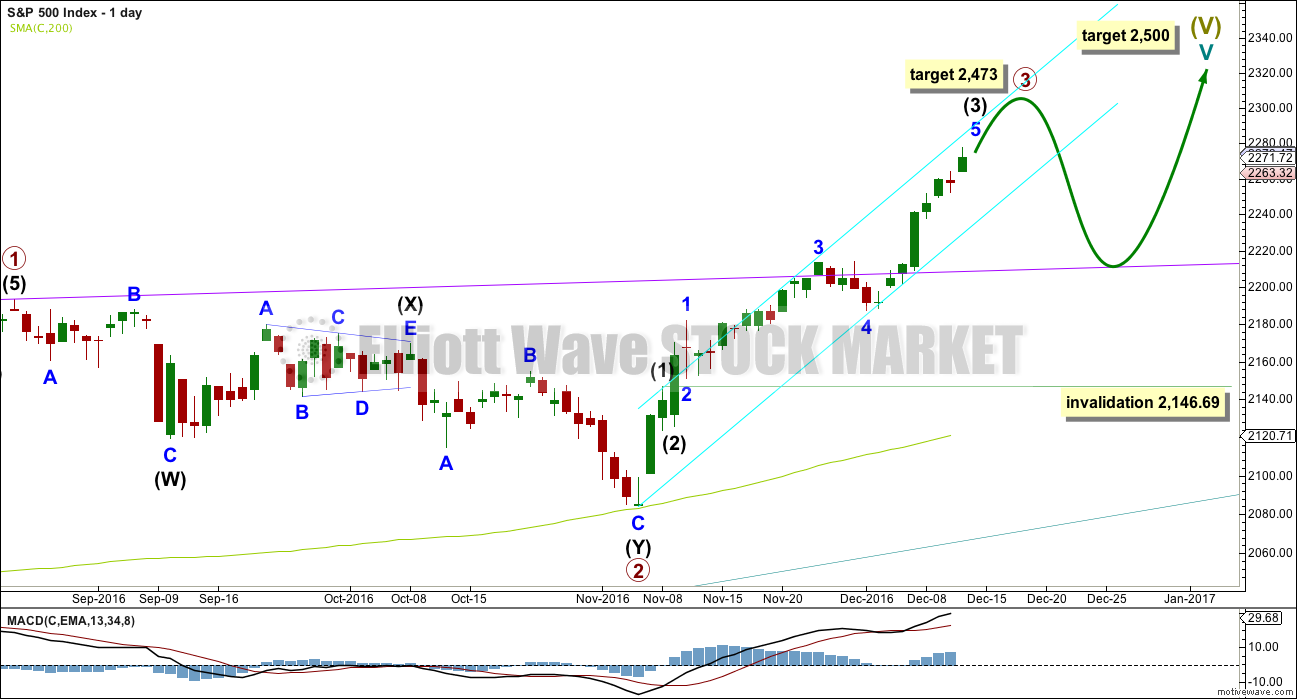
Cycle wave V must subdivide as a five wave structure. At 2,500 it would reach equality in length with cycle wave I. This is the most common Fibonacci ratio for a fifth wave for this market, so this target should have a reasonable probability.
Cycle wave V within Super Cycle wave (V) should exhibit internal weakness. At its end, it should exhibit strong multiple divergence at highs.
Within cycle wave V, primary waves 1 and 2 are complete. Primary wave 3 may be over halfway through and is now exhibiting stronger momentum than primary wave 1. It is possible primary wave 3 may fall short of the target and not reach equality in length with primary wave 1.
Within primary wave 3, the upcoming correction for intermediate wave (4) should be relatively brief and shallow. Intermediate wave (1) was over very quickly within one day. Intermediate wave (4) may last a little longer, perhaps two or three days, and may not move into intermediate wave (1) price territory below 2,146.69.
At 2,473 primary wave 3 would reach equality in length with primary wave 1. This Fibonacci ratio is chosen for this target calculation because it fits with the higher target at 2,500.
When primary wave 3 is complete, then the following correction for primary wave 4 may last about one to three months and should be a very shallow correction remaining above primary wave 1 price territory. Although primary wave 3 has now moved above the end of primary wave 1, it looks like primary wave 3 needs to move higher to allow enough room for primary wave 4 to unfold. For this reason, if a pullback begins here, I would not yet expect it to be primary wave 4.
At this stage, I am removing the base channel as it does not appear to be adding any value to this analysis. I will instead use the new purple trend line for support.
HOURLY CHART
Click chart to enlarge.
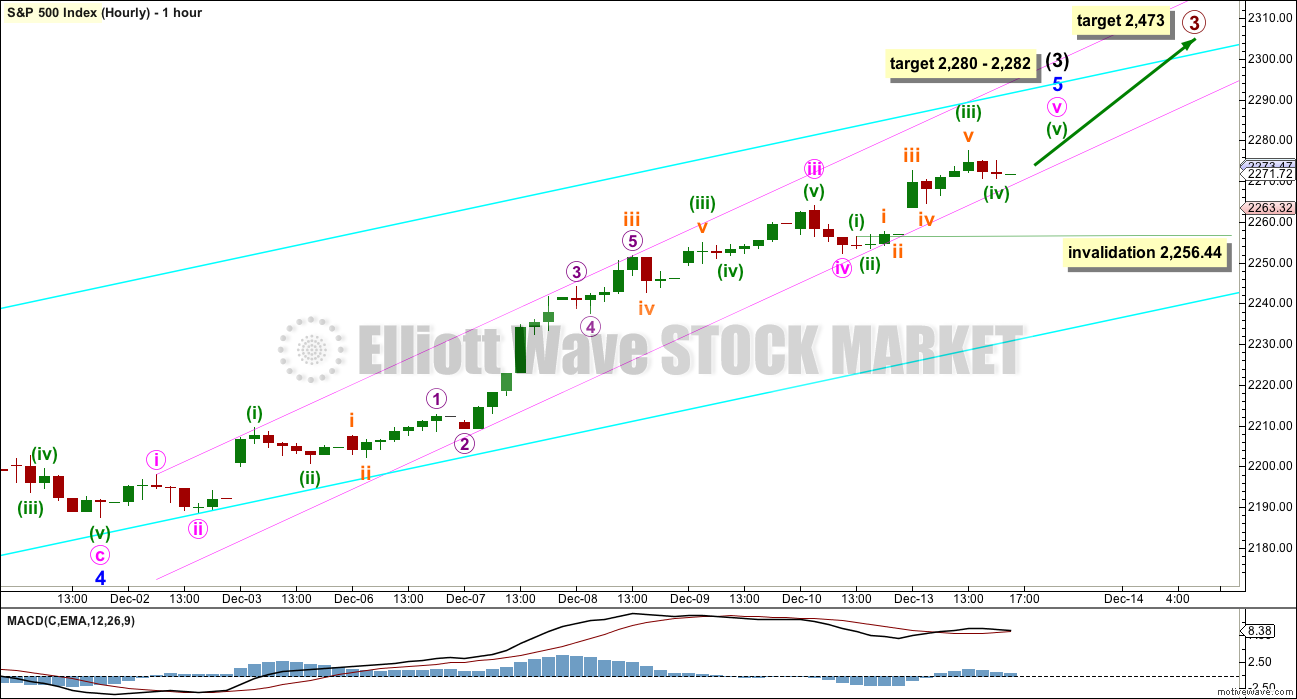
Intermediate wave (3) may still be incomplete. Use the narrow pink channel about minor wave 5 to indicate when it is over. It will be an indication intermediate wave (3) might be over when this channel is breached by downwards (not sideways) movement.
Price continues to find support at the lower edge of this channel. While it does that, expect upwards movement to continue.
At 2,280 minor wave 5 would reach 1.618 the length of minor wave 1. Minor wave 5 has passed equality in length with minor wave 1, so this is the next Fibonacci ratio in the sequence.
At 2,282 minute wave v would reach 0.618 the length of minute wave iii. This gives a two point target zone calculated at two degrees.
When the channel is breached, then intermediate wave (4) may have begun.
If minute wave iii was over at Monday’s high, then it would be 3.62 points longer than 6.854 the length of minute wave i.
Ratios within minute wave iii are: minuette wave (iii) is 0.91 points short of 2.618 the length of minuette wave (i), and minuette wave (v) is just 0.65 points short of 0.618 the length of minuette wave (i).
Ratios within minuette wave (iii) are: subminuette wave iii is 3.63 points longer than 6.854 the length of subminuette wave i, and subminuette wave v is 0.61 points longer than 0.236 the length of subminuette wave iii.
Minute wave v may require only the very last fifth wave up to complete it, so it may end tomorrow. Within minute wave v, the small correction for minuette wave (iv) may not move into minuette wave (i) price territory below 2,256.44.
ALTERNATE HOURLY CHART
Click chart to enlarge.
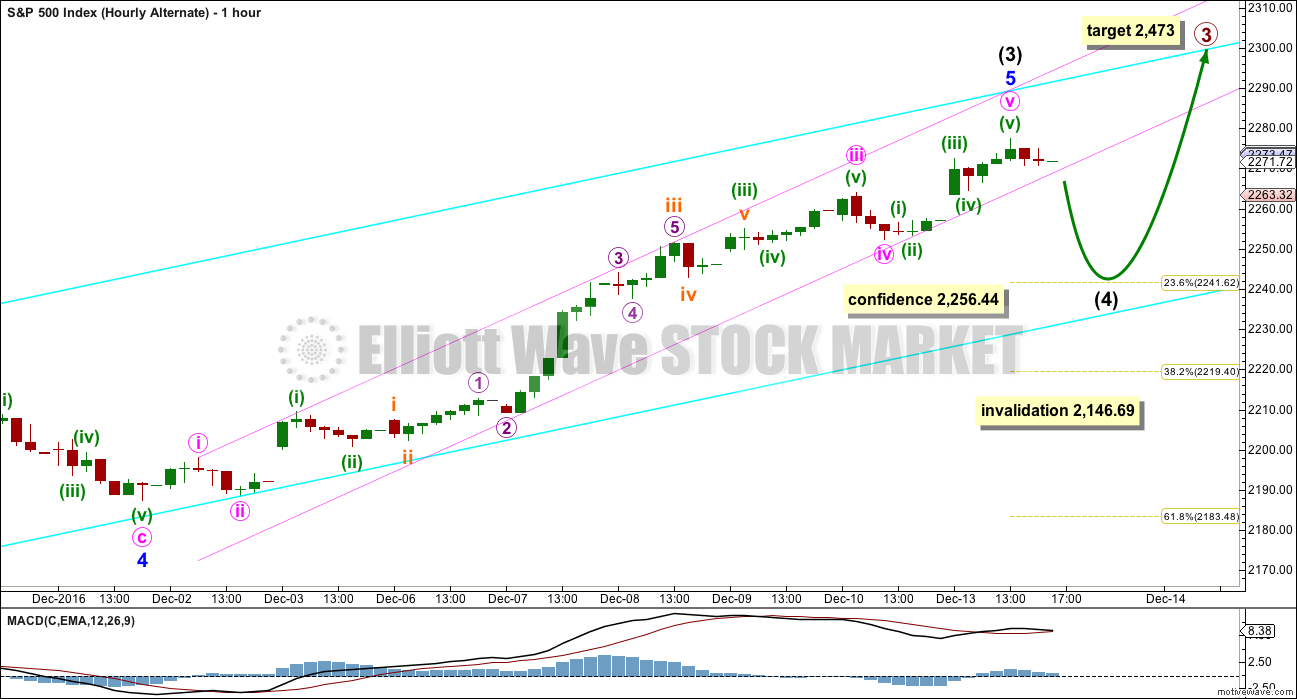
Again, what if intermediate wave (3) is over at today’s high? The subdivisions within this alternate today are changed to be identical to the main hourly wave count up to the low labelled minute wave iv. Only here minute wave v may possibly be over. The problems of poorer Fibonacci ratios for yesterday’s alternate are resolved.
Intermediate wave (4) may not move into intermediate wave (1) price territory below 2,146.69.
In the short term, a breach of the pink channel by downwards (not sideways) movement would be an early indication of a possible trend change. Thereafter, a new low below 2,256.44 would add some confidence.
Intermediate wave (4) should be expected to be a relatively shallow flat, combination or triangle, lasting about three days. Targets for it would be the 0.236 and 0.382 Fibonacci ratios of intermediate wave (3) at 2,242 and 2,219.
Assume the trend remains the same until proven otherwise. Use the main Elliott wave count until the channel is breached, then consider this alternate.
TECHNICAL ANALYSIS
WEEKLY CHART
Click chart to enlarge. Chart courtesy of StockCharts.com.
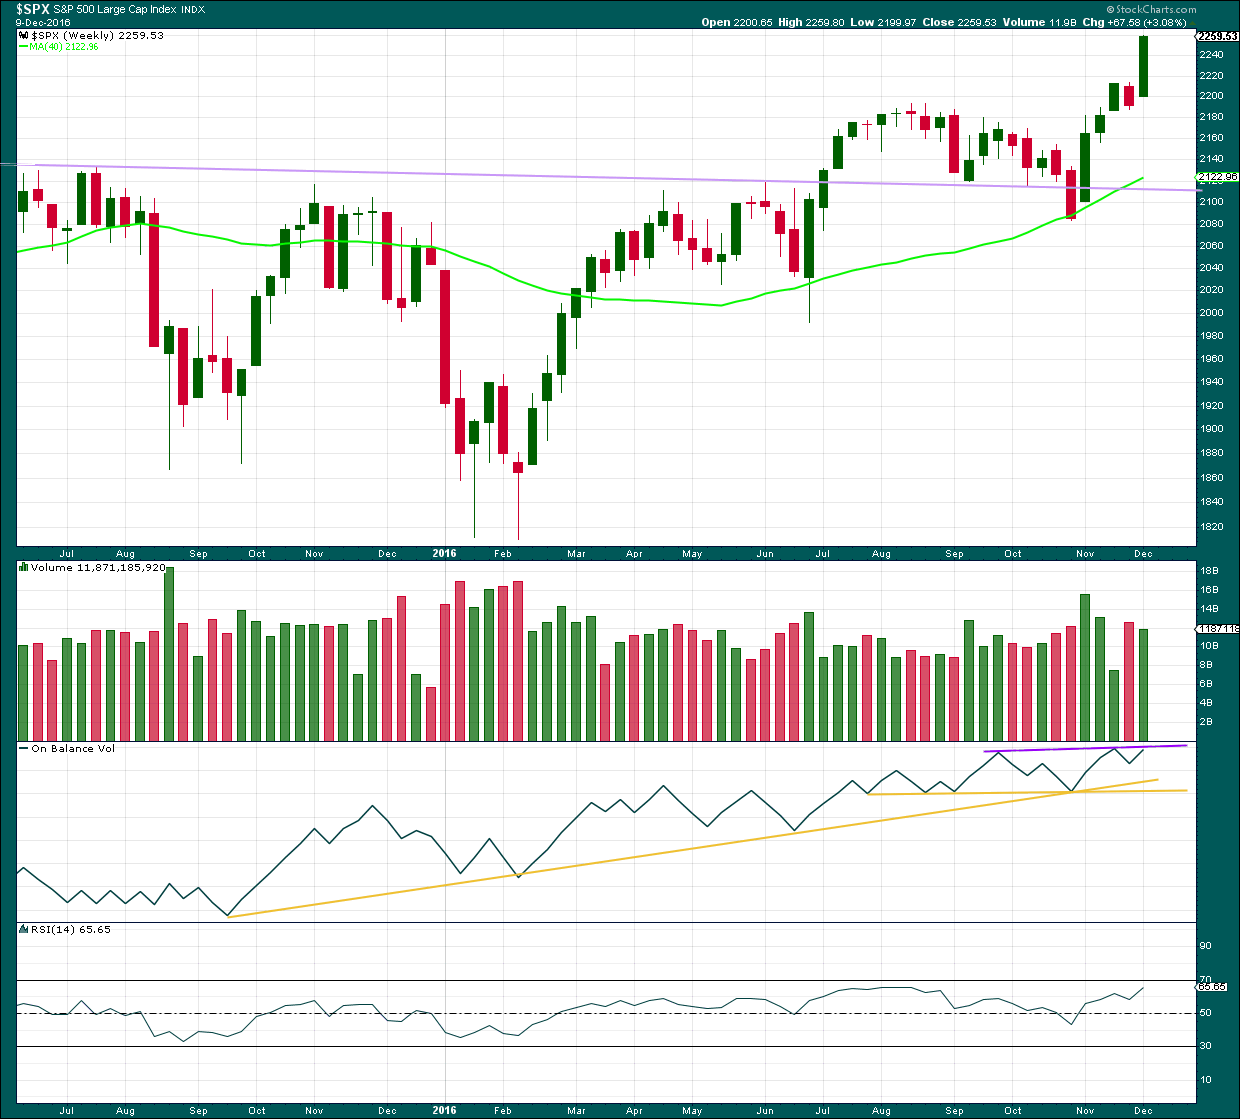
Another strong upwards week comes with a slight decline in volume, but volume is still relatively high.
On Balance Volume may find resistance at the purple line and this may force intermediate wave (4) to arrive earlier than expected. If OBV breaks above this line next week, that would be a fairly bullish signal.
RSI is not yet extreme. There is room for price to rise.
DAILY CHART
Click chart to enlarge. Chart courtesy of StockCharts.com.
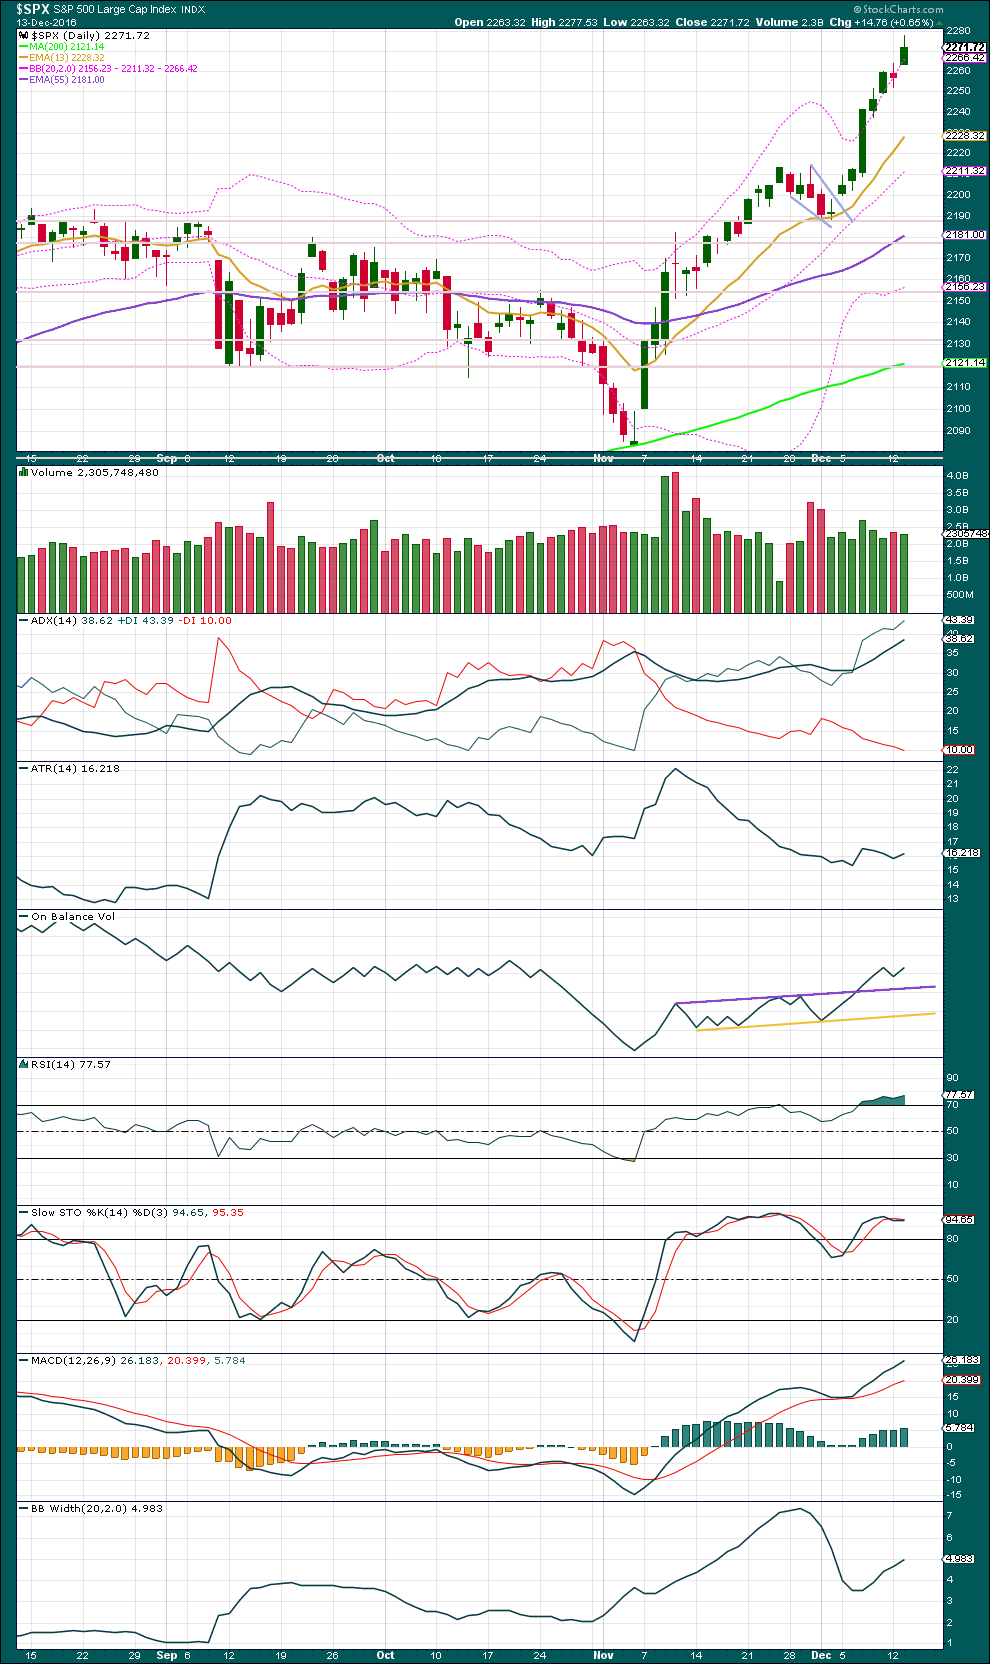
The target using the measured rule from the pennant pattern is 2,318.
An upwards day with a small decline in volume and a long upper wick is bearish. But not really very bearish. Price could still rise further.
Price has closed at or above the upper range of Bollinger Bands now for five days in a row. Normally, this would indicate a pullback, a reversion to the mean.
ADX is now comfortably above 35; it is extreme. This trend is nearing its end.
ATR is essentially flat. Each day bulls push price higher they are not able to increase the range they can push it up by, so they are tiring. But ATR is not declining anymore, so they have slightly strengthened.
Bollinger Bands are widening as some volatility returns to the market. This is more normal for a trend than the prior contraction. Bulls have been more active in the last four days.
A pullback about here may be limited by the new purple support line on the daily and weekly Elliott wave charts, by the 13 day moving average, by the mid line of Bollinger Bands, and by On Balance Volume finding support at the purple trend line. All of these will be watched carefully for support when a pullback develops.
RSI is extreme, but it still does not exhibit any divergence with price at recent highs to indicate weakness in bulls.
The only weakness seen here is from ATR, so allow that price may continue to rise further towards targets.
Stochastics is extreme and exhibits divergence, which is now double. This offers slightly more confidence that the trend is very close to an end.
VOLATILITY – INVERTED VIX CHART
Click chart to enlarge. Chart courtesy of StockCharts.com.
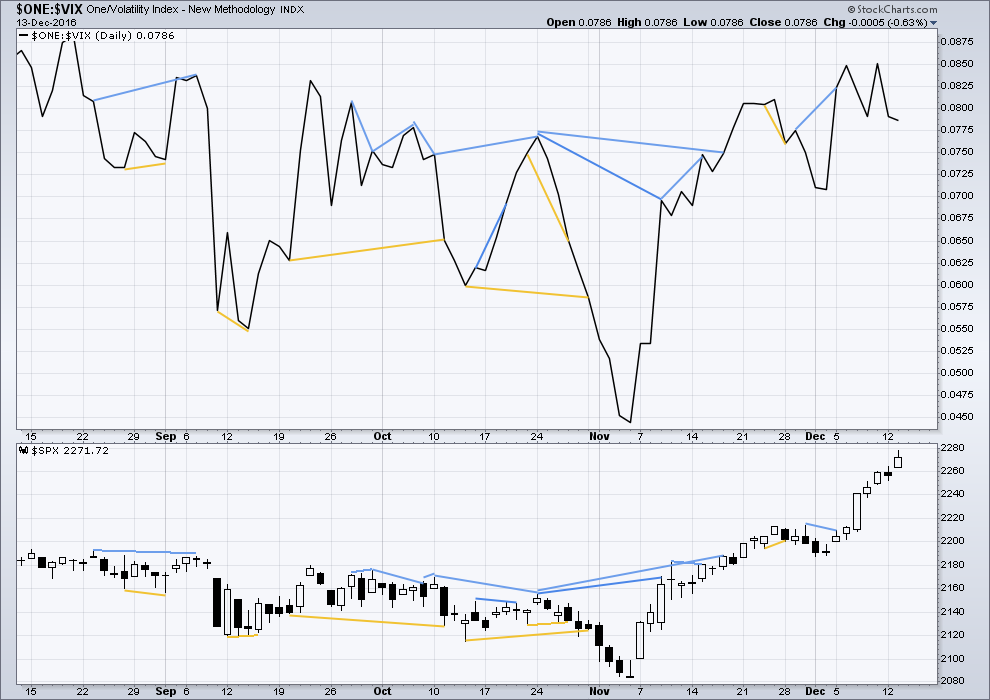
There are a few instances of multi day divergence between price and inverted VIX noted here. Bearish divergence is blue. Bullish divergence is yellow. It appears so far that divergence between inverted VIX and price is again working to indicate short term movements spanning one or two days. While this seems to be working more often than not, it is not always working. As with everything in technical analysis, there is nothing that is certain. This is an exercise in probability.
Again, price moved higher today to new all time highs and VIX also moved higher (inverted VIX moved lower), but this is not normal. Normally, volatility declines as price rises but here price is rising and volatility has increased.
The last two times this happened very recently it was not followed immediately by a pullback. So it will be not expected to be immediately followed by a pullback here.
But this is indicting highly unusual behaviour. It looks like strong bearish divergence, but it is yet to be seen if it is followed by strong downwards movement from price. Members are warned that if holding long positions stops are absolutely essential at this time, and careful attention is required to all positions. This behaviour from inverted VIX may portend a strong downwards movement from price.
BREADTH – AD LINE
Click chart to enlarge. Chart courtesy of StockCharts.com.
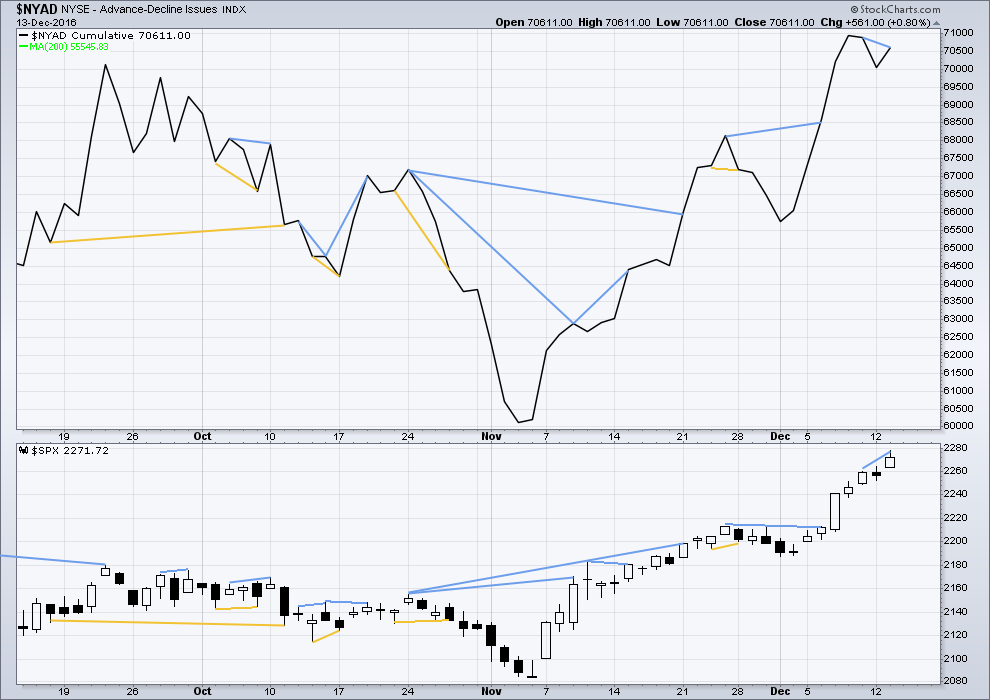
Short term bullish and bearish divergence is again working between price and the AD line to show the direction for the following one or two days.
There is longer term divergence between price and the AD line, but like inverted VIX this has proven reasonably recently to be unreliable. It will be given no weight here.
Short term bearish divergence is noted between price and the AD line from the high of the 9th of December to the new high today. As price has made new highs for the last two sessions, this has not been supported by an increase in market breadth. This may be followed by one or two days of downwards movement.
DOW THEORY
Major lows within the old bull market:
DJIA: 15,855.12 (15th October, 2014) – closed below on 25th August, 2015.
DJT: 7,700.49 (12th October, 2014) – closed below on 24th August, 2015.
S&P500: 1,821.61 (15th October, 2014) – has not closed below this point yet.
Nasdaq: 4,117.84 (15th October, 2014) – has not closed below this point yet.
Major highs within the bear market from November 2014:
DJIA: 17,977.85 (4th November, 2015) – closed above on 18th April, 2016.
DJT: 8,358.20 (20th November, 2015) – closed above this point on the 9th of November, 2016.
S&P500: 2,116.48 (3rd November, 2015) – closed above this point on 8th June, 2016.
Nasdaq: 5,176.77 (2nd December, 2015) – closed above this point on 1st August, 2016.
Dow Theory Conclusion: The transportations indicate an end to the prior bear market. The transportation index confirms a bull market.
This analysis is published @ 10:52 p.m. EST.
Intermediate (4) is here. At its end this should offer another opportunity to join the trend.
For now I don’t think it’s over yet. Targets either the 0.236 or 0.382 Fibonacci ratios at 2,242 or 2,219.
Yellen… “We have discussed how and under what conditions to start the balance sheet run off.”
Now that is one thing that will pop equity prices!
The business media staying a mile away from that quote.
Yellen, in her news conference… Spewing the Obama Economic Fiction over the last 8 years!
If it was all so great, why didn’t you start to normalize Rates 3 Years ago???
Coz, bears had to be punished for the doom and gloom they kept spewing for 3+ years.
Now that we have GOP control, let rates rise, eventually bring markets down and blame recession and correction on them. Plus any other conspiracy theory you can tag to it.
However, fact remains, Obama years may go down in history as one of the best for bulls. And yes he did have help from central banks.
But NOT for the economy… or for the average American.
Bulls or the Market is NOT the Economy… Certainly NOT since 2009! This was a managed fictional market… NOT a free market economy or market!
Depends where that “average American” lived. Most people did benefit (still had jobs, 401K- which were cut in half -came back and house prices improved).
Obama and Yellen… created the most part time – low paying jobs in USA’s history!
You have millions of College Grads that can’t get jobs paying enough to meet the payments for their Student Loans and/or live on their own.
That is NOT the way it was during a real economic boom in the 1980’s that created millions of High Paying Jobs… where you were able to participate even if you didn’t have a College Degree. It was opportunity for all who wanted to work for it! That was real growth!
The part time jobs were left for the Teen Agers!
To be fair, technology has played a bigger role in whatever shifts the labor markets have seen. As a small business owner who at one point had over 100 employees, I can say that sincerely. Anyhow, markets selling some (profit taking or “hawkish” comments). Vix hardly moving so far.
Lara,
I am wondering if is possible that Primary 1 and 2 actually ended where you have Intermediate 1 and 2 of Primary 1 labeled. It may not change much in the immediate term, but it would allow for more room for Primary 4 to develop once Primary 3 has ended.
Thanks,
Peter
Yes, that’s possible. It would see something like this….
It would still need a third wave to finish far enough above 2,193.81 to allow a fourth wave to unfold, and the fourth wave would still need to be somewhat proportional to the last correction now labelled intermediate (2) so that the wave count would have the right look.
Verne, it appears the overweight to short gamma is now pushing the VIX down, somehow producing a positive correlation to the SPX.
Excellent analysis! Would it be possibl to count this advance as all of 5 once we have a 4 and 5 sequence? Reasoning would be massive accumulation in VIX and commercials are huge short, and those positions likely don’t get resolved by a 2-3 percent pullback.
Yes, the hourly alternate could see intermediate (4) unfolding now, then only one final high required for intermediate (5) to end primary 3.
My problem there though remains that primary 3 hasn’t moved far enough above the end of primary 1 to allow for primary 4 to have room to move and remain above primary 1 price territory.