
A green daily candlestick has unfolded exactly as expected for Thursday’s session.
Summary: A consolidation has begun and is likely to continue for a few more days with choppy overlapping sideways movement. Tomorrow may begin with some upwards movement to end within a range of 2,277.53 to 2,288.58. Thereafter, downwards movement should unfold again. In the first instance, the lower edge of the cyan channel on daily and hourly charts will be expected to provide support.
Last monthly chart is here.
Last weekly chart is here.
New updates to this analysis are in bold.
DAILY CHART
Click chart to enlarge.
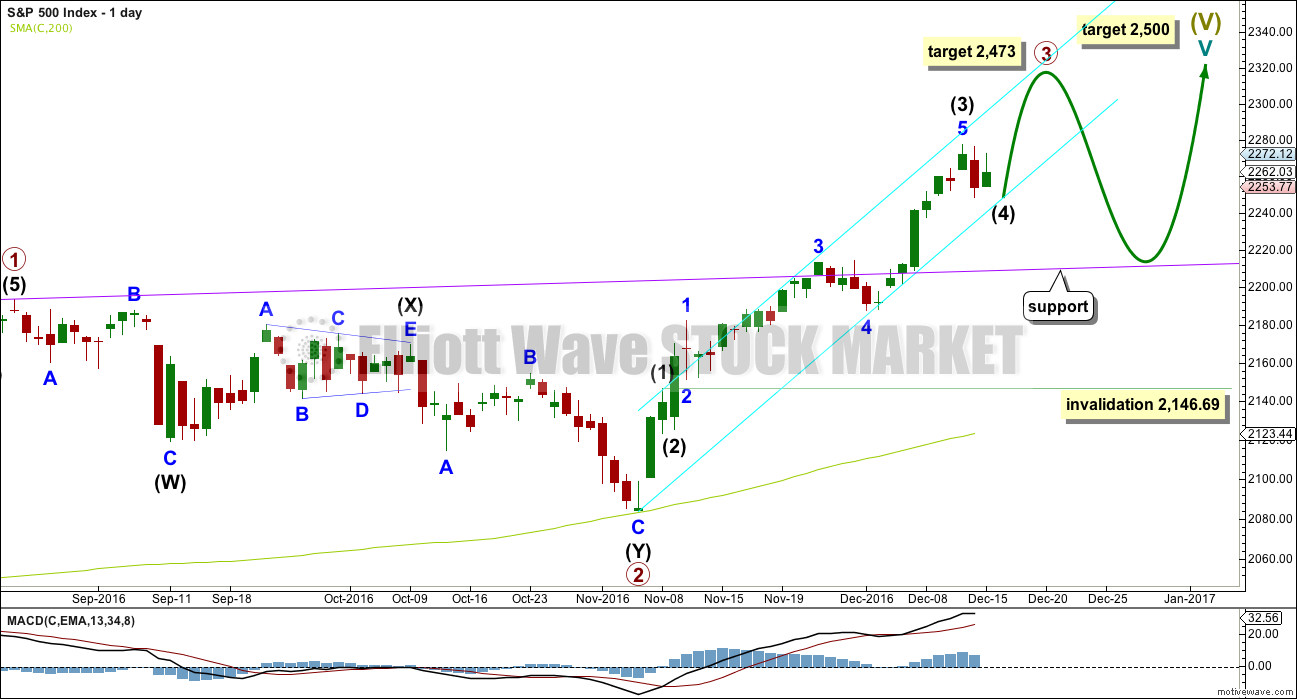
Cycle wave V must subdivide as a five wave structure. At 2,500 it would reach equality in length with cycle wave I. This is the most common Fibonacci ratio for a fifth wave for this market, so this target should have a reasonable probability.
Cycle wave V within Super Cycle wave (V) should exhibit internal weakness. At its end, it should exhibit strong multiple divergence at highs.
Within cycle wave V, primary waves 1 and 2 are complete. Primary wave 3 may be over halfway through and is now exhibiting stronger momentum than primary wave 1. It is possible primary wave 3 may fall short of the target and not reach equality in length with primary wave 1.
Within primary wave 3, the correction for intermediate wave (4) should be relatively brief and shallow. Intermediate wave (2) was over very quickly within one day. Intermediate wave (4) may last a little longer, perhaps two or three days, and may not move into intermediate wave (1) price territory below 2,146.69.
At 2,473 primary wave 3 would reach equality in length with primary wave 1. This Fibonacci ratio is chosen for this target calculation because it fits with the higher target at 2,500.
When primary wave 3 is complete, then the following correction for primary wave 4 may last about one to three months and should be a very shallow correction remaining above primary wave 1 price territory. Although primary wave 3 has now moved above the end of primary wave 1, it looks like primary wave 3 needs to move higher to allow enough room for primary wave 4 to unfold. For this reason, if a pullback begins here, I would not yet expect it to be primary wave 4.
HOURLY CHART
Click chart to enlarge.
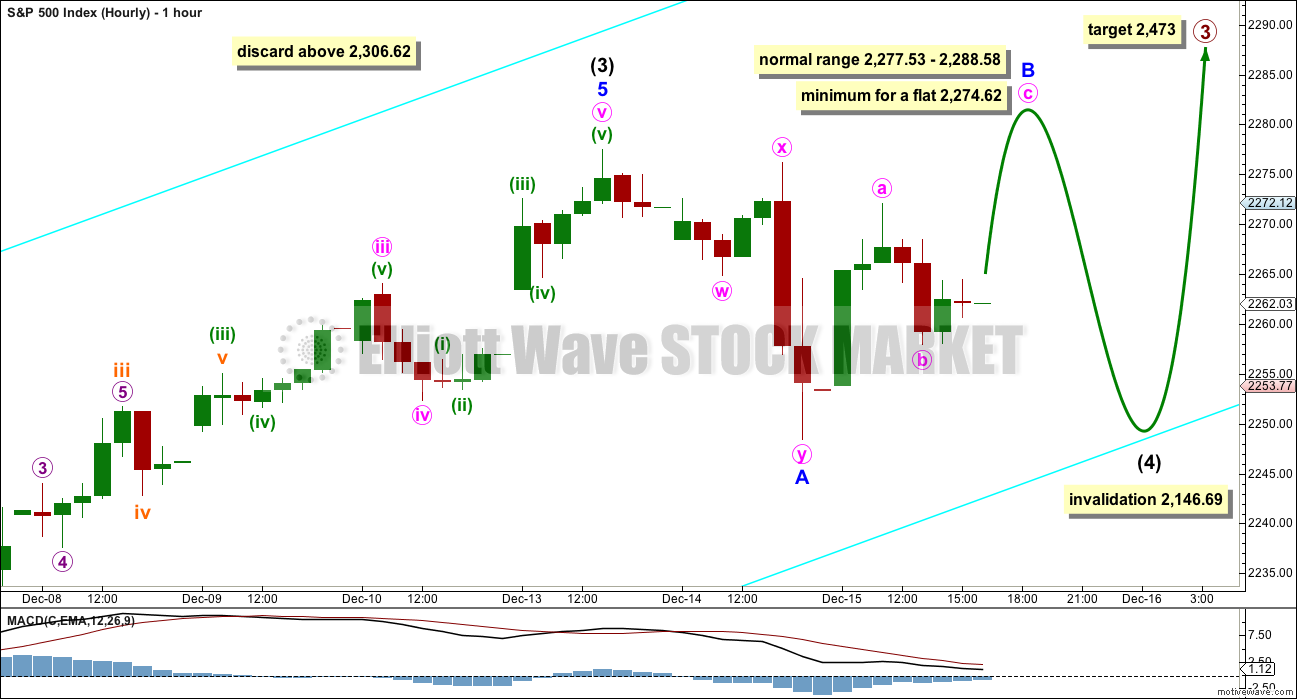
At this stage, it looks more likely that intermediate wave (4) is incomplete.
If intermediate wave (4) is a flat correction, then within it minor wave B must retrace a minimum 0.9 length of minor wave A at 2,274.62. The normal range for minor wave B within a flat correction would be 1 to 1.38 the length of minor wave A at 2,277.53 to 2,288.58.
If intermediate wave (4) is a triangle, then minor wave B may be complete at today’s high. It is also possible that minor wave B may move higher, and it may make a new high above 2,277.53 as in a running triangle.
A combination may be eliminated for minor wave 4 because a multiple has unfolded lower. This cannot be relabelled as a double zigzag for minor wave W. The maximum number of corrective structures in a multiple is three, and to label multiples within W, Y or Z increases the maximum beyond three violating the rule.
When minor wave B is complete, then a target may be calculated for minor wave C downwards. That cannot be done yet. At this stage, it is expected that minor wave C may find support at the lower edge of the best fit cyan trend channel copied over here from the daily chart.
ALTERNATE HOURLY CHART
Click chart to enlarge.
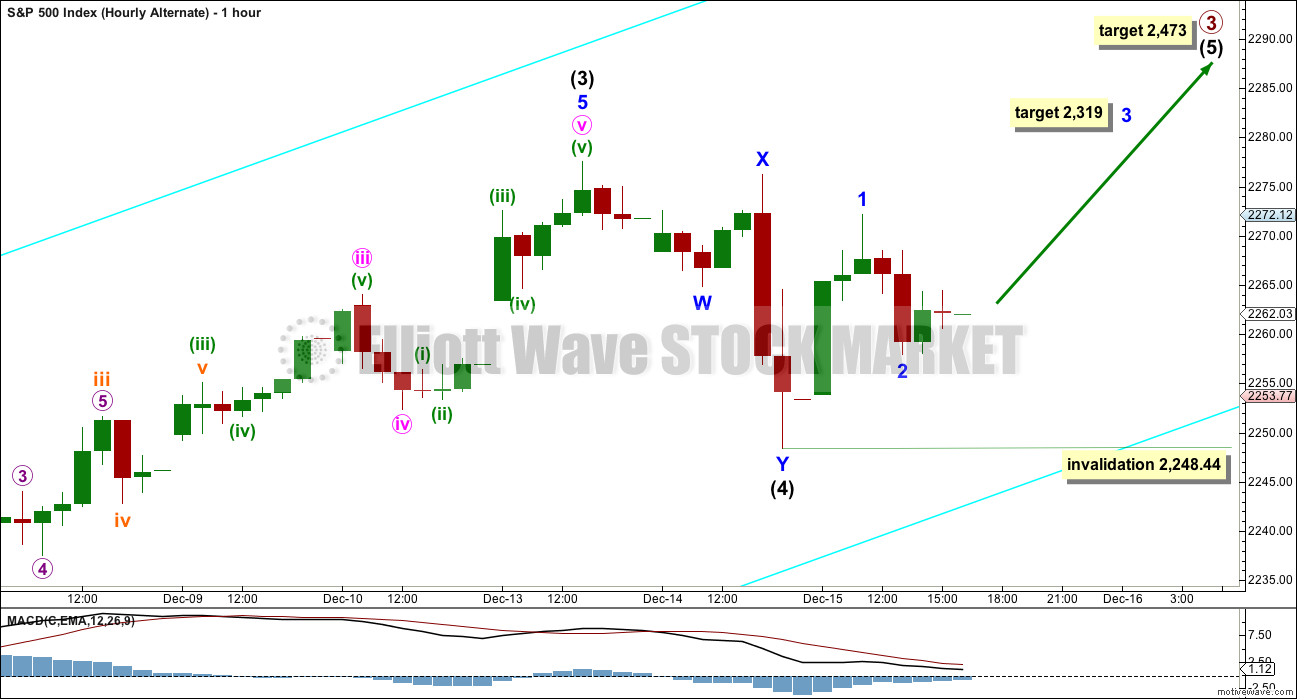
Intermediate wave (4) will fit neatly as a double zigzag on the one minute chart. It may be over here. There is a very little alternation between the single shallow 0.34 zigzag of intermediate wave (2), which lasted 5 hours, and the more shallow 0.19 double zigzag of intermediate wave (4). Alternation is a guideline and not a rule, and the S&P does not always exhibit it perfectly.
Intermediate wave (3) is 12.49 points short of 2.618 the length of intermediate wave (1). This is less than a 10% variation on the length of intermediate wave (3), so it may be considered an adequate Fibonacci ratio, just. If it is accepted that intermediate wave (3) exhibits a Fibonacci ratio to intermediate wave (1), then intermediate wave (5) may be expected to not exhibit a Fibonacci ratio to either of intermediate waves (1) or (3). The target calculation will be left at only primary degree at this stage.
Ratios within intermediate wave (3) are: minor wave 3 is 5.23 points longer than equality in length with minor wave 1, and minor wave 5 is 2.02 points short of 1.618 the length of minor wave 1.
Ratios within minor wave 5 are: minute wave iii is 3.62 points longer than 6.854 the length of minute wave i, and minute wave v 2.35 points short of 2.618 the length of minute wave i.
Intermediate wave (5) would have to be a long extension, longer than equality with intermediate wave (3) to reach the target at 2,473. If this target is wrong, it may be too high.
Within intermediate wave (5), minor wave 2 may not move beyond the start of minor wave 1 below 2,248.44.
TECHNICAL ANALYSIS
WEEKLY CHART
Click chart to enlarge. Chart courtesy of StockCharts.com.
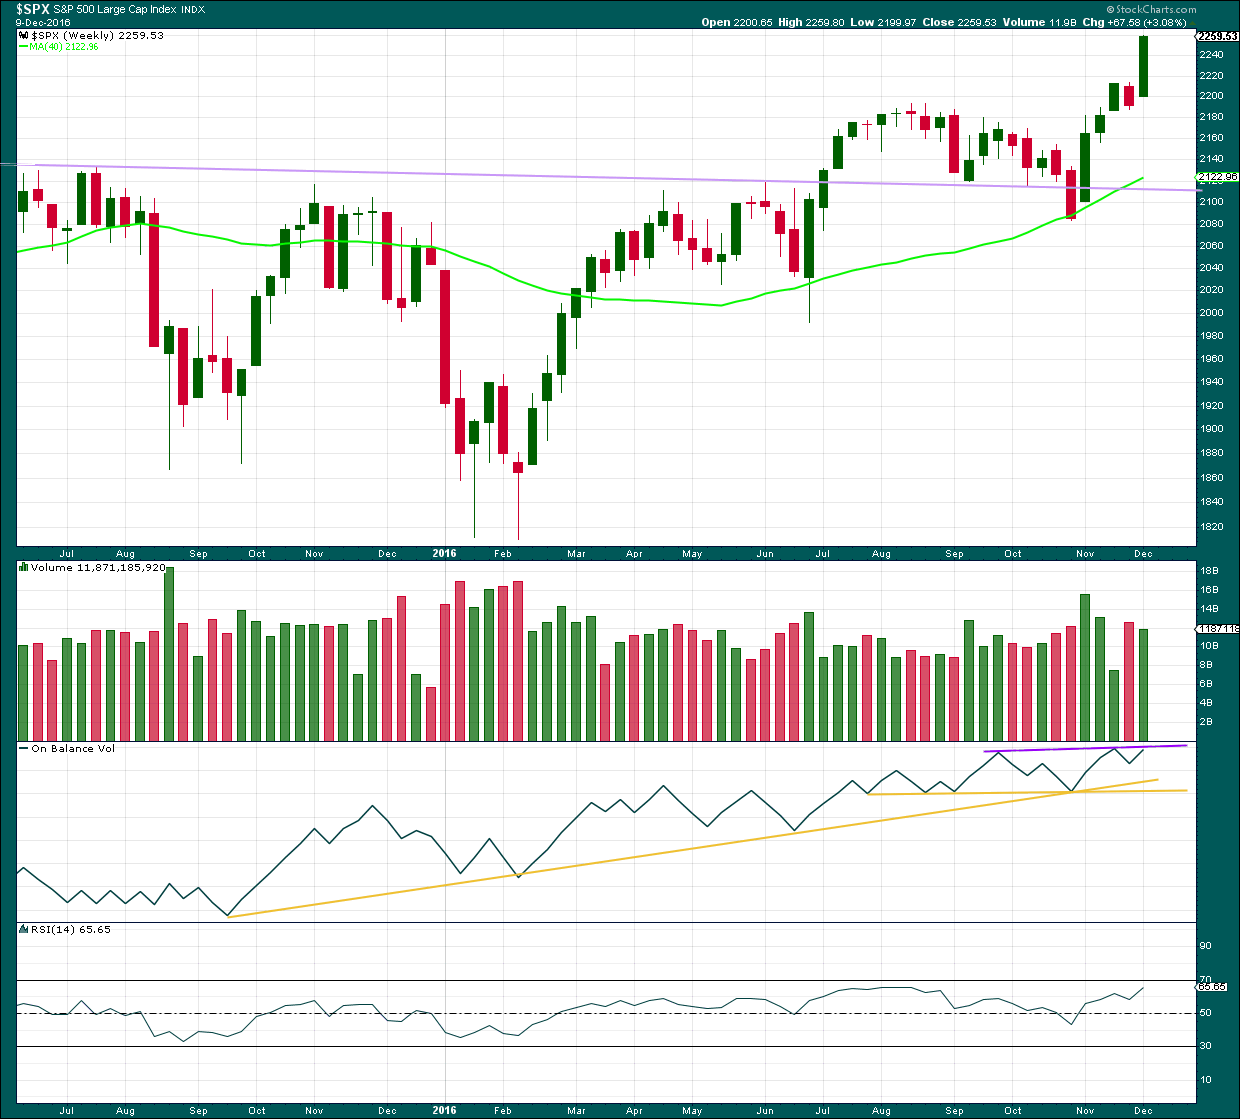
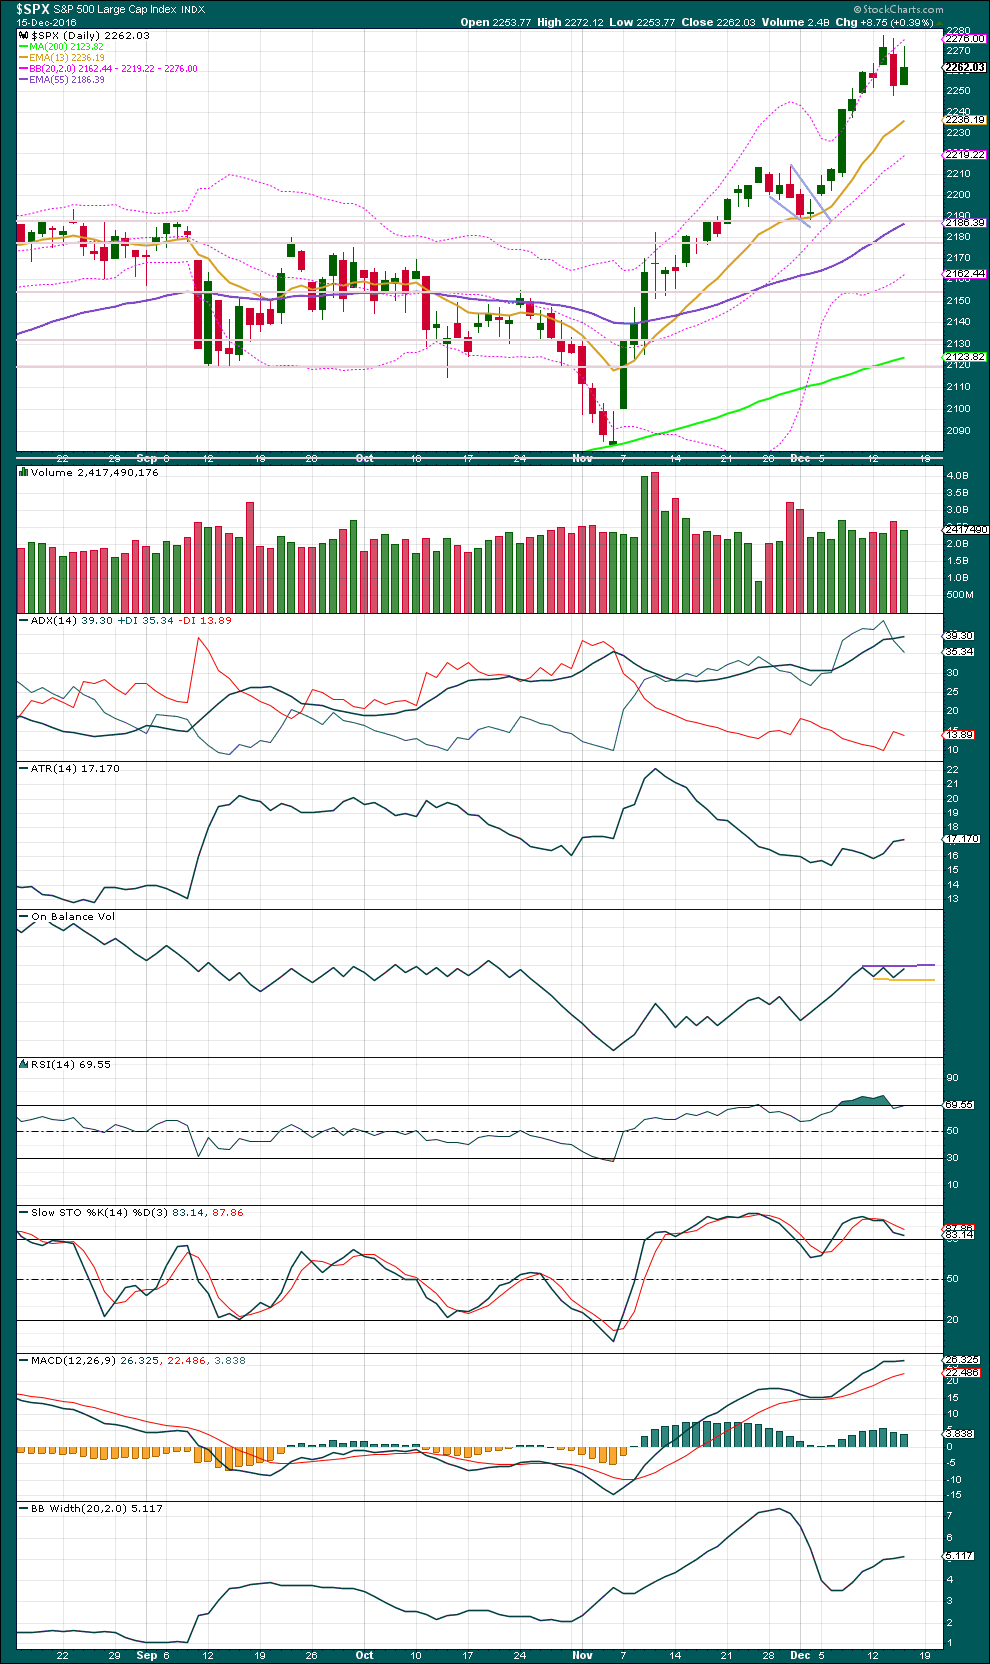
Another strong upwards week comes with a slight decline in volume, but volume is still relatively high.
On Balance Volume may find resistance at the purple line and this may force intermediate wave (4) to arrive earlier than expected. If OBV breaks above this line next week, that would be a fairly bullish signal.
RSI is not yet extreme. There is room for price to rise.
DAILY CHART
Click chart to enlarge. Chart courtesy of StockCharts.com.
The target using the measured rule from the pennant pattern is 2,318. In the first instance, this target should be used. If price keeps rising above it, then use the Elliott wave target at 2,473.
An inside day closes green, with the balance of volume today upwards. The decline in volume for this session is bearish; the rise in price today was not supported by volume, so it is suspicious. This favours the main hourly Elliott wave count over the alternate.
Expect price to find support about the short term Fibonacci 13 day moving average.
ADX today showed some further increase. It is now well above 35, which is extreme.
ATR is still slightly increasing. Ballinger Bands are still widening. There is an upwards trend in place, but it is extreme. Some consolidation may be expected as an interruption to the trend here.
Trend lines on On Balance Volume are today redrawn about the new small consolidation. This may force price to move in a shallow range prior to a breakout.
RSI does not exhibit any divergence short term with price at the last high, but Stochastics does. This indicates some weakness for bulls here.
VOLATILITY – INVERTED VIX CHART
Click chart to enlarge. Chart courtesy of StockCharts.com.
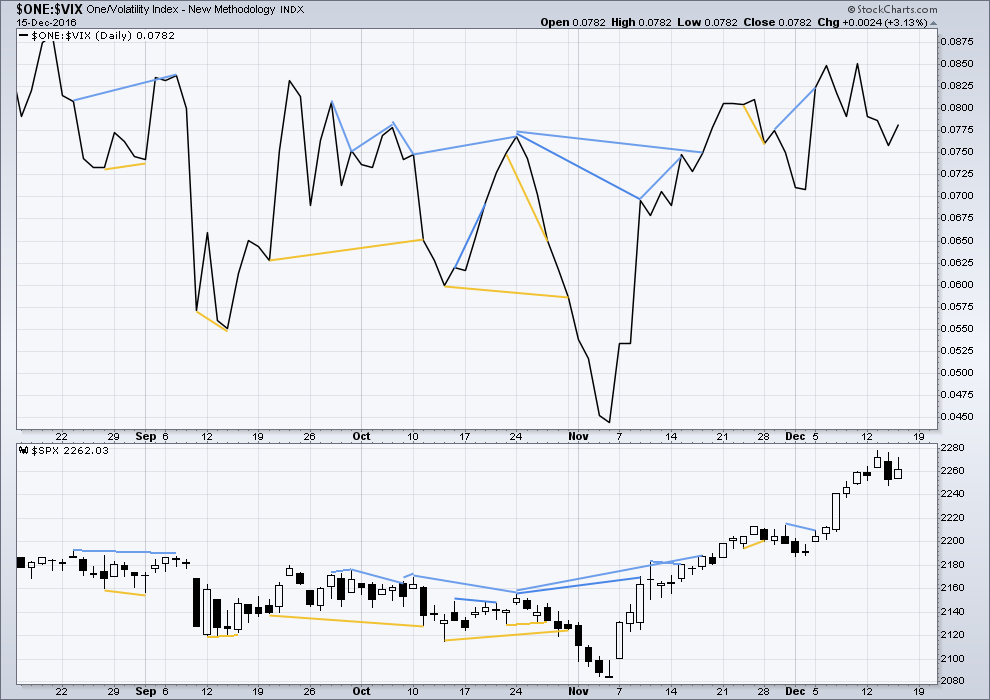
There are a few instances of multi day divergence between price and inverted VIX noted here. Bearish divergence is blue. Bullish divergence is yellow. It appears so far that divergence between inverted VIX and price is again working to indicate short term movements spanning one or two days. While this seems to be working more often than not, it is not always working. As with everything in technical analysis, there is nothing that is certain. This is an exercise in probability.
No new divergence is noted today between price and inverted VIX. Last divergence noted may now be resolved.
BREADTH – AD LINE
Click chart to enlarge. Chart courtesy of StockCharts.com.
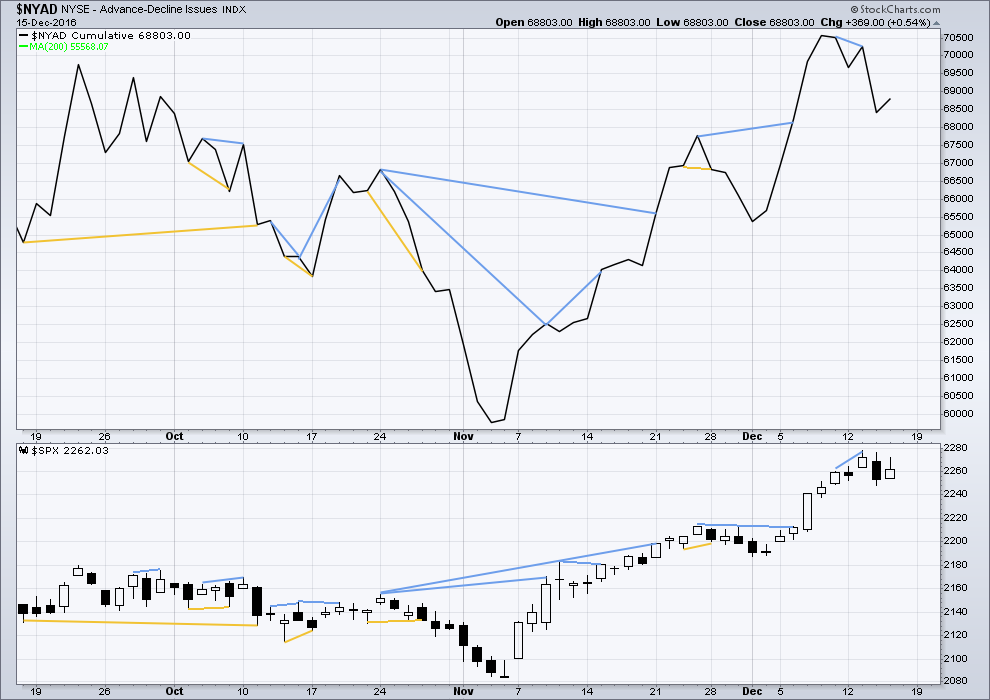
Short term bullish and bearish divergence is again working between price and the AD line to show the direction for the following one or two days.
There is longer term divergence between price and the AD line, but like inverted VIX this has proven reasonably recently to be unreliable. It will be given no weight here.
Last bearish divergence may have been resolved by one day of downwards movement. No new divergence is noted today.
DOW THEORY
Major lows within the old bull market:
DJIA: 15,855.12 (15th October, 2014) – closed below on 25th August, 2015.
DJT: 7,700.49 (12th October, 2014) – closed below on 24th August, 2015.
S&P500: 1,821.61 (15th October, 2014) – has not closed below this point yet.
Nasdaq: 4,117.84 (15th October, 2014) – has not closed below this point yet.
Major highs within the bear market from November 2014:
DJIA: 17,977.85 (4th November, 2015) – closed above on 18th April, 2016.
DJT: 8,358.20 (20th November, 2015) – closed above this point on the 9th of November, 2016.
S&P500: 2,116.48 (3rd November, 2015) – closed above this point on 8th June, 2016.
Nasdaq: 5,176.77 (2nd December, 2015) – closed above this point on 1st August, 2016.
Dow Theory Conclusion: The transportations indicate an end to the prior bear market. The transportation index confirms a bull market.
This analysis is published @ 09:12 p.m. EST.
I’ve just read Lowry’s weekly report.
This market is supported very well by internal strength. The OCO AD line is making new highs along with price, and all segments of the S&P (small, mid and large) show internal strength.
This supports an Elliott wave count which sees a third wave up underway.
And it gives me confidence that corrections at this stage should be relatively brief and shallow, an opportunity to join the trend.
So if any members are still bearish, you may want to consider following what the market is doing. I know that switching from how bearish we were up to the middle of this year to afterwards being so bullish has been hard, very hard. But if we want to make some money we have to follow what price is doing and go with the trend.
And it’s not over yet folks.
The target at 2,500 for now looks reasonable.
I agree Lara. The trend is clearly up, and your count is right on the money as what we just witnessed was without doubt third wave. I have to say the Steve Hochberg has me really worried. He is now giving a host of reasons why the current conditions do NOT suggest a market top is at hand! 🙂 🙂 🙂
Well Joe my friend, I think I am ready to join you in wishing Prechter and company a fond and final farewell. I used to read quite a few of their publications including the Global and European reports awhile back but have over the years dropped everything except the short-term updates and monthly EW Theorist and Financial Forecast offerings. This is literally the fourth time I have opened up the new publication and did not even bother to read the first paragraph. Prechter has now taken to using the EWT monthly publication as a forum for endless excerpts and re-hashings of previous work. He now seems to think that just in case I did not go out and purchase his new book on Socionomics, he is going to make sure I spend the next few years reading chapter and verse in EWT. I used to really enjoy that work, even when he was wrong on his predictions. It used to be thoughtfully and well written. I don’t know what has happened to Bob the last years or so but I have had enough. I am calling to cancel today. So sad! 🙁
I agree… I just scanned it to see if there was any mention of the S&P or DOW, Nothing. The last few issues were nonsense!
I cancelled but have access through the 1st week in Jan..
Maybe I will listen to the audio of the last few issues before I am locked out… but will not read them.
I can’t stand when he goes off on that socioeconomic crap or the election year crap.
Yep. They also told me I was locked in through the Month of January. I really should have insisted on a refund as I do not think I have been getting what I paid for. 🙂
Intermediate (4) could be unfolding sideways as a triangle.
The triangle will remain valid if price remains above 2,254.96.
It is possible also that minor B of the triangle is incomplete, and it could make a new high above 2,277.53, so there’s no upper invalidation point for the triangle.
It is also still possible that intermediate (4) is a flat correction. If the minimum at 2,274.62 is met then a flat will again be charted.
I just wanted to show members what a triangle would look like this morning.
Whether it be a flat or a triangle it is still not over.
I’ll be expecting more sideways movement next week to complete it.
Then a resumption of the upwards trend.
could this be a 1,2 – 1,2 in a reversal?
Yes, that’s possible. There would be three now.