
Price remained within the small green channel, so upwards movement was expected to continue. The short term targets were woefully inadequate, but longer term targets remain the same.
Summary: Use the narrow green channel on the hourly chart and expect upwards movement to continue while price remains within it. The first Elliott wave target is at 2,244, the next Elliott wave target is at 2,290, and the next target using the measured rule is at 2,318. Expect a sharp deep pullback to about 2,202 when the channel is breached.
Last monthly chart for the main wave count is here.
Last weekly chart is here.
New updates to this analysis are in bold.
MAIN WAVE COUNT
DAILY CHART
Click chart to enlarge.
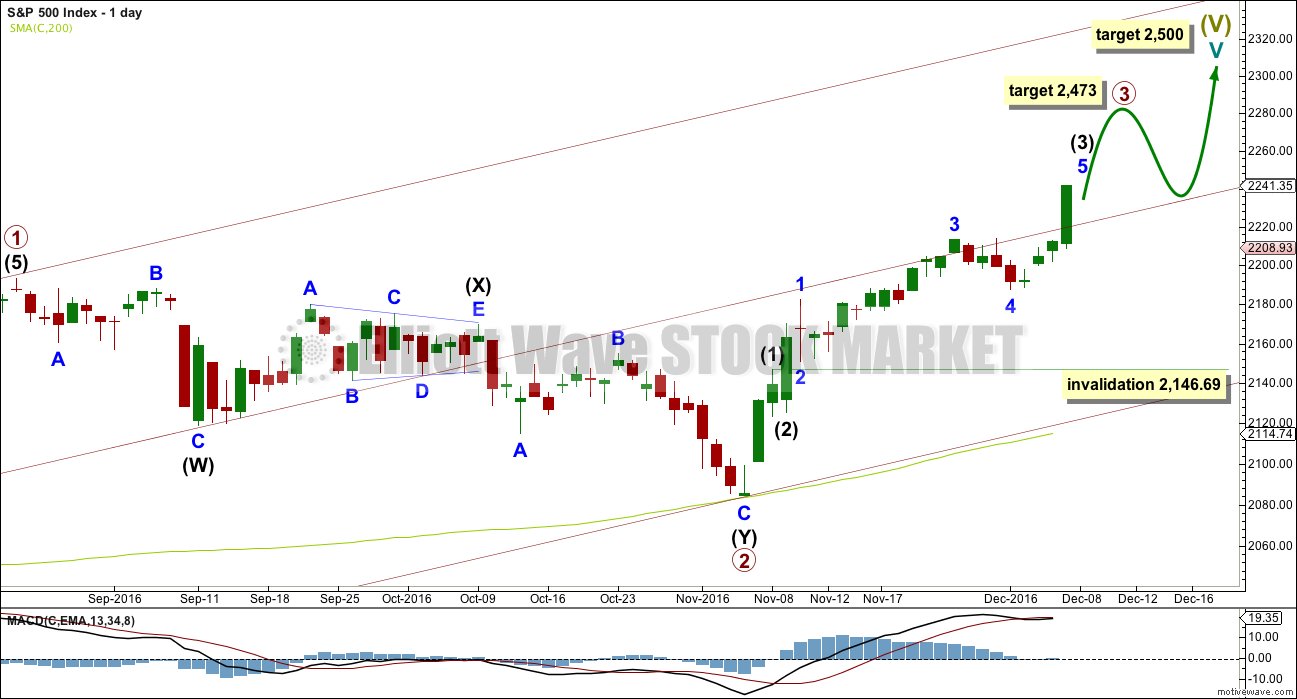
Cycle wave V must subdivide as a five wave structure. At 2,500 it would reach equality in length with cycle wave I. This is the most common Fibonacci ratio for a fifth wave for this market, so this target should have a reasonable probability.
Cycle wave V within Super Cycle wave (V) should exhibit internal weakness. At its end, it should exhibit strong multiple divergence at highs.
Within cycle wave V, primary waves 1 and 2 may be complete. Primary wave 3 may be over halfway through and is so far exhibiting weaker momentum than primary wave 1, which fits with the larger picture of expected weakness for this fifth wave at cycle degree. It is possible primary wave 3 may fall short of the target and not reach equality in length with primary wave 1.
Within primary wave 3, the upcoming correction for intermediate wave (4) should be relatively brief and shallow. Intermediate wave (1) was over very quickly within one day. Intermediate wave (4) may last a little longer, perhaps two or three days, and may not move into intermediate wave (1) price territory below 2,146.69.
At 2,473 primary wave 3 would reach equality in length with primary wave 1. This Fibonacci ratio is chosen for this target calculation because it fits with the higher target at 2,500.
When primary wave 3 is complete, then the following correction for primary wave 4 may last about one to three months and should be a very shallow correction remaining above primary wave 1 price territory.
The maroon channel is redrawn as a base channel about primary waves 1 and 2. Draw the first trend line from the start of primary wave 1 at the low of 1,810.10 on the 11th of February, 2016, then place a parallel copy on the high of primary wave 1. Add a mid line, which has shown about where price has been finding support and resistance.
HOURLY CHART
Click chart to enlarge.
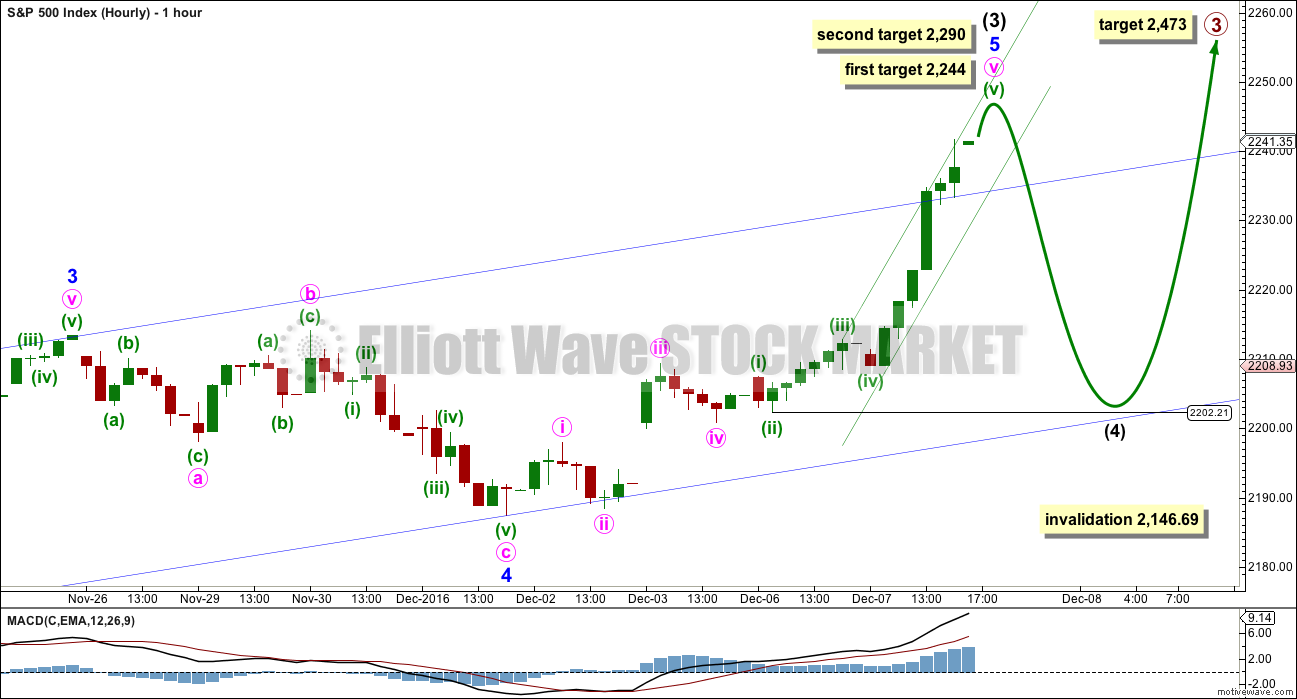
It looks like the S&P has behaved like a commodity today by moving higher in a strong, extended fifth wave.
At 2,244 minor wave 5 would reach equality with minor wave 1. This is the most common ratio for the S&P, for its fifth waves, so this target should have the highest probability.
If price keeps going up through this first target, then the next target would be at 2,290 where intermediate wave (3) would reach 2.618 the length of intermediate wave (1). Intermediate wave (3) has passed 1.618 the length of intermediate wave (1), so this would be the next in the sequence if it exhibits a Fibonacci ratio.
The ensuing correction following a fifth wave extension is usually sharp and will find support at the end of the second wave within the extension. In this instance, intermediate wave (4) may be sharp and may end about 2,202.21, the end of the second wave of minuette wave (ii) within the extended fifth wave of minute wave v.
Use the narrow green channel to indicate when minute wave v may be over. So far price is contained within this channel. When the channel is breached by clear downwards (not sideways) movement, then it may indicate a trend change.
In this instance, because the upwards movement for today’s session was very much like commodity behaviour, I would expect this channel to be more likely than usual to work for the S&P.
Expect price to continue upwards while price remains within the channel. The trend is up.
Intermediate wave (4) may not move into intermediate wave (1) price territory below 2,146.69.
Note: About the alternate wave count, the idea for DJIA is now invalidated. The corresponding idea for the S&P remains technically valid but will be discarded based upon a very low probability.
TECHNICAL ANALYSIS
WEEKLY CHART
Click chart to enlarge. Chart courtesy of StockCharts.com.
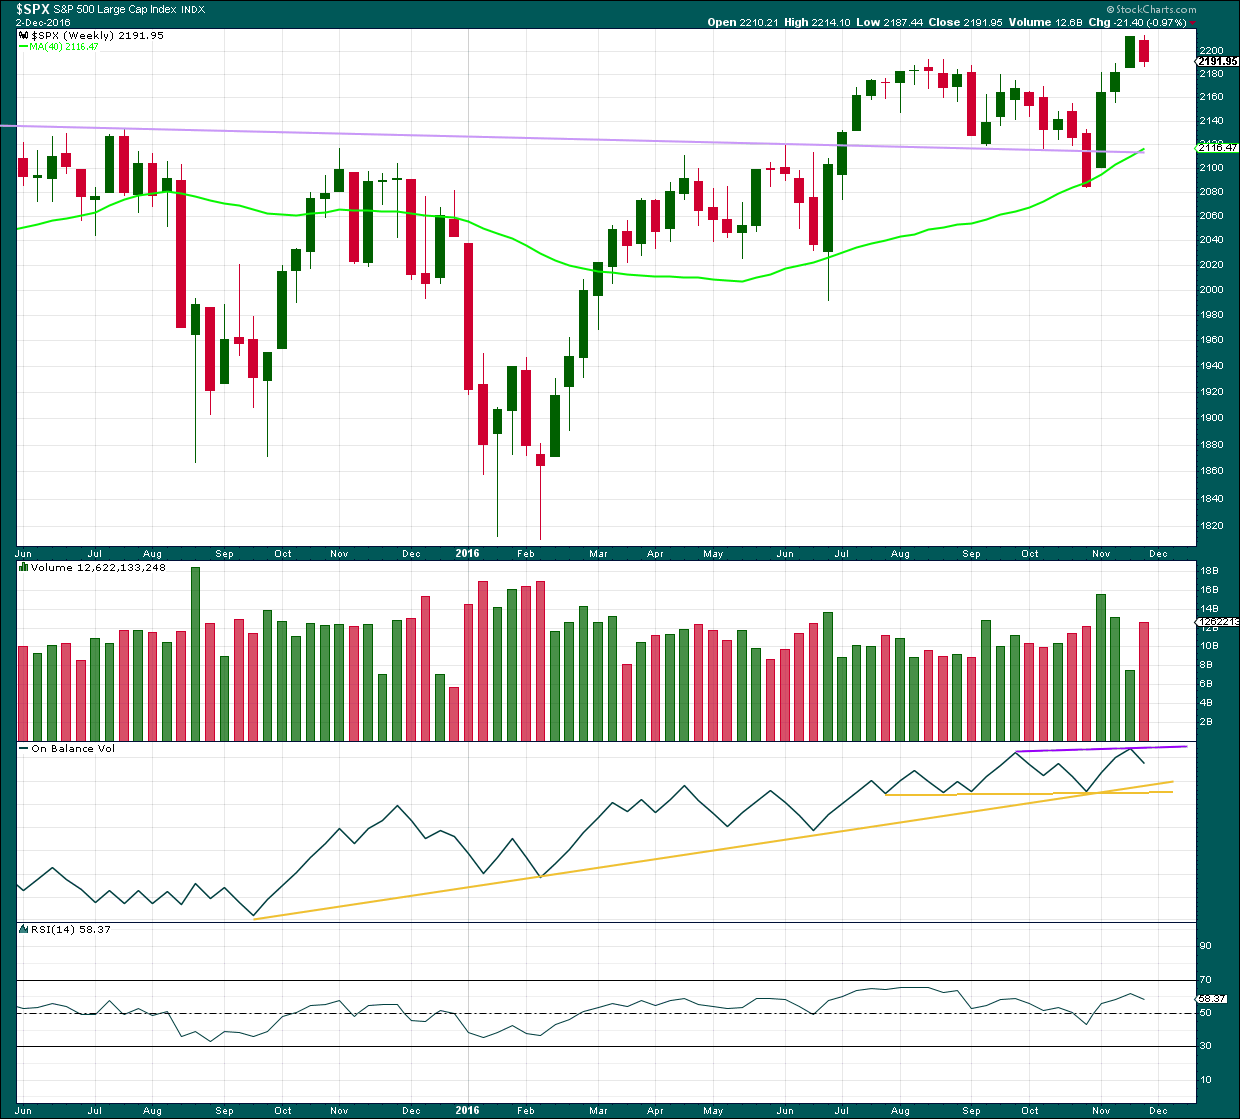
Price moved overall upwards last week with a higher high (slightly) and a higher low. But the week closed with a red candlestick.
On Balance Volume last week moved lower. With stronger volume lastweek, the balance of it was downwards. The fall in price this week was supported by volume.
If price falls further this week, then the support lines for OBV may assist to hold the fall, at least temporarily.
If OBV breaks above the purple resistance line, that would offer a weak bullish signal.
RSI is not extreme. There is room for price to rise. There is mid term divergence with price and RSI for the new high last week and the high in August. This indicates weakness, but this is expected from the Elliott wave count.
DAILY CHART
Click chart to enlarge. Chart courtesy of StockCharts.com.
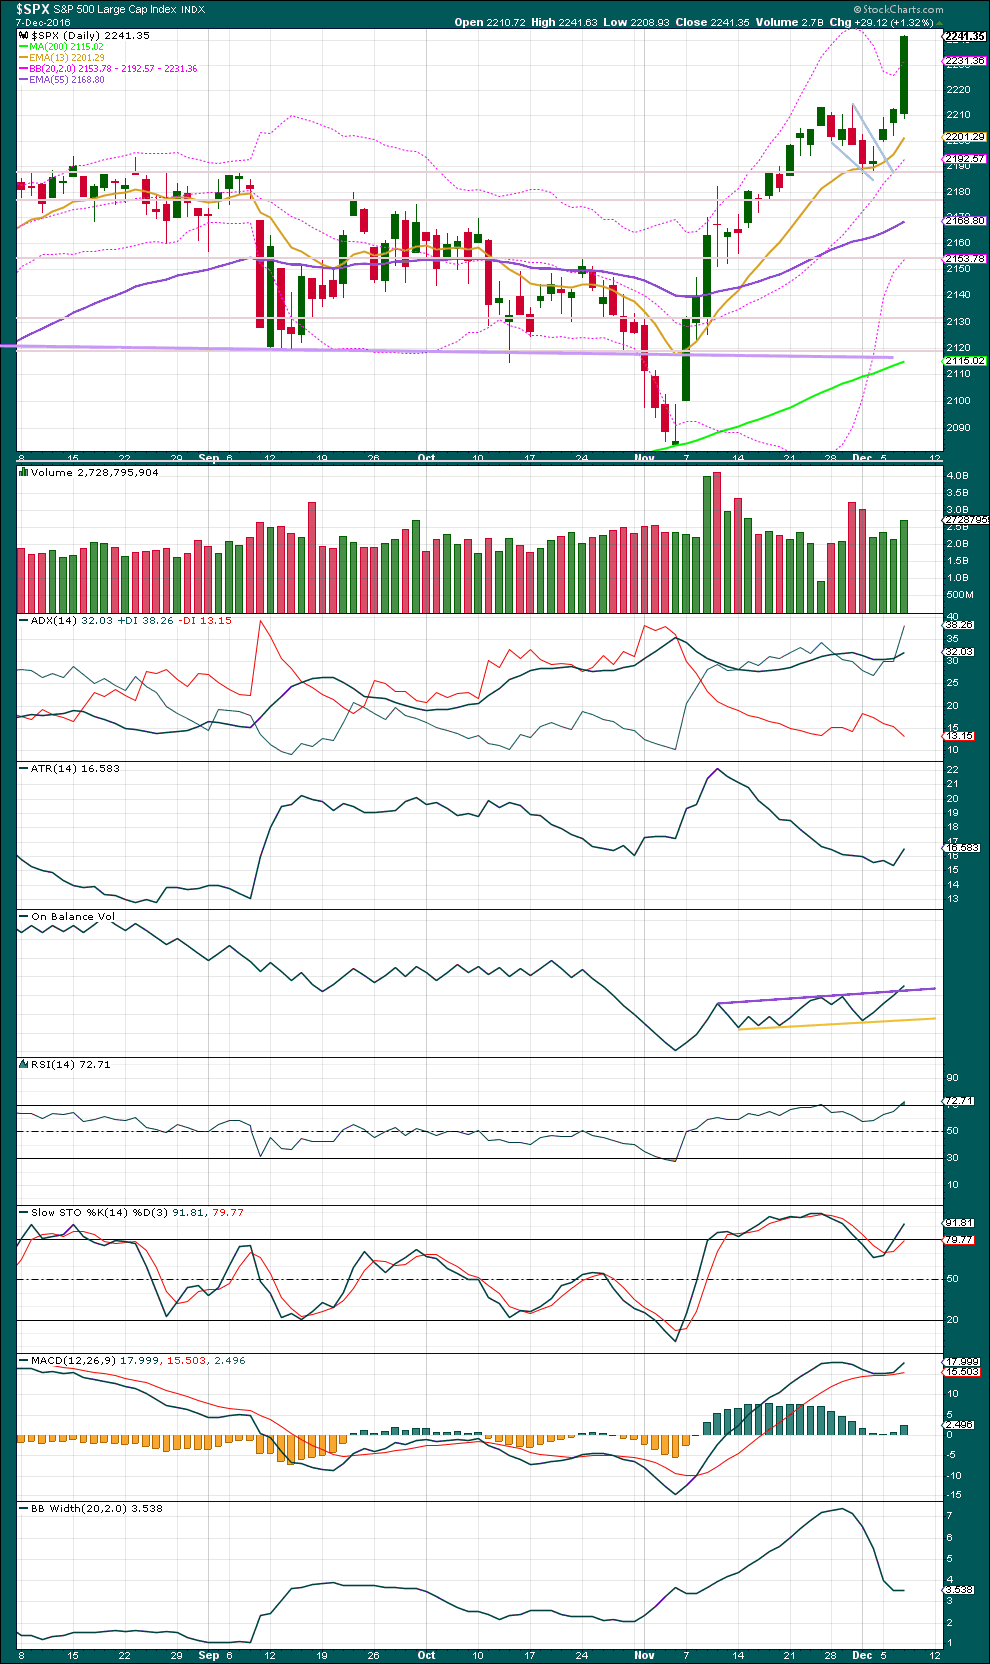
The small pennant pattern looks to be correct. The gap looks to be a breakaway gap, and these are not usually filled.
Using the measured rule, a target for the next movement up would be 2,318.
Upwards movement today has good support from volume.
Although price closed above the upper edge of Bollinger Bands, that does not mean it must reverse here. Price may remain outside of the Bollinger Bands for a few days yet.
ADX indicates an upwards trend is in place. It is nearing extreme, almost at 35. There is room for this trend to continue to the target.
ATR today agrees and Bollinger Bands may be beginning to widen. The trend today looks more healthy than it has recently.
Stochastics is now overbought, but this oscillator may remain extreme for reasonable periods of time during a trending market. Stochastics does exhibit some divergence today with price at an extreme, so this indicates weakness to upwards movement. Caution is advised with this trend as it looks to be nearing its end as it becomes overextended. A pullback may be expected soon.
RSI is only just entering overbought. When RSI has been extreme for another one to few days and then exhibits some divergence with price, then it would indicate an end to the upwards trend. That is not the case yet.
On Balance Volume today gives a good bullish signal with a break above resistance at the purple line. This supports the Elliott wave count and the targets.
MACD remains bullish.
VOLATILITY – INVERTED VIX CHART
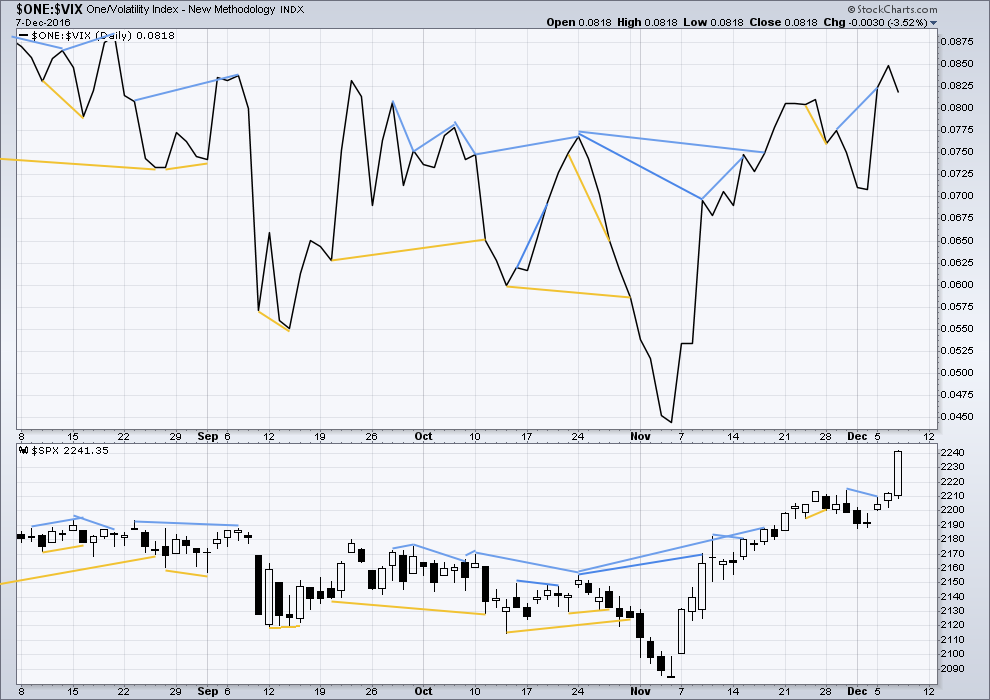
Click chart to enlarge. Chart courtesy of StockCharts.com.
There are a few instances of multi day divergence between price and inverted VIX noted here. Bearish divergence is blue. Bullish divergence is yellow. It appears so far that divergence between inverted VIX and price is again working to indicate short term movements spanning one or two days. While this seems to be working more often than not, it is not always working. As with everything in technical analysis, there is nothing that is certain. This is an exercise in probability.
There is some strong divergence today with price moving strongly higher and inverted VIX moving lower. As price moved higher today with support from volume, volatility increased. This is absolutely not normal for a healthy upwards trend. This divergence must be interpreted as bearish, but recently it has been noted that divergence between price and inverted VIX is not always a reliable signal. It will be noted here as a warning. This trend may end sooner than expected; it looks overextended.
BREADTH – AD LINE
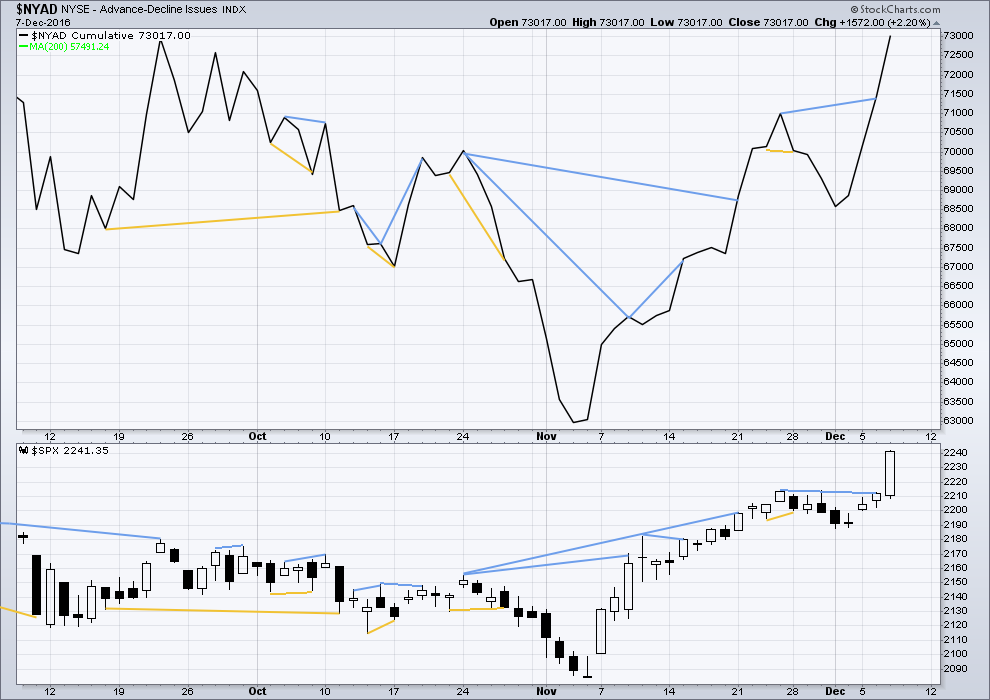
Click chart to enlarge. Chart courtesy of StockCharts.com.
Short term bullish and bearish divergence is again working between price and the AD line to show the direction for the following one or two days.
There is longer term divergence between price and the AD line, but like inverted VIX this has proven reasonably recently to be unreliable. It will be given no weight here.
Bearish divergence between price and the AD line noted yesterday has failed. There is no divergence today. The AD line moved higher with price, and this upwards movement has support from market breadth.
DOW THEORY
Major lows within the old bull market:
DJIA: 15,855.12 (15th October, 2014) – closed below on 25th August, 2015.
DJT: 7,700.49 (12th October, 2014) – closed below on 24th August, 2015.
S&P500: 1,821.61 (15th October, 2014) – has not closed below this point yet.
Nasdaq: 4,117.84 (15th October, 2014) – has not closed below this point yet.
Major highs within the bear market from November 2014:
DJIA: 17,977.85 (4th November, 2015) – closed above on 18th April, 2016.
DJT: 8,358.20 (20th November, 2015) – closed above this point on the 9th of November, 2016.
S&P500: 2,116.48 (3rd November, 2015) – closed above this point on 8th June, 2016.
Nasdaq: 5,176.77 (2nd December, 2015) – closed above this point on 1st August, 2016.
Dow Theory Conclusion: The transportations indicate an end to the prior bear market. The transportation index confirms a bull market.
This analysis is published @ 11:00 p.m. EST.
I don’t know if Joe has already cancelled his EWI subscription but at the very least they are great contrary indicators! Every time Prechter sends out an interim report it turns out that he is either wrong or early. Hulbert’s Digest consistently ranks EWI at the bottom when it comes to forecasting market direction, despite the impressive charts and fancy math. I was struck by Steve’s latest update in which he points out all the technical reasons for why they did not expect the market to go higher, then proceeds to point out all the technical reasons for why they now think it will! It really is TOO funny.
Their bullish talk is making me very nervous! 🙂
But semi-seriously, you do have to wonder how long the banksters can overcome the headwinds of population demographics, declining market volume, and lagging market breadth. This will truly be a top for the ages!
In typical bankster fashion, they used the irrelevant blather of Drahghi this morning to ambush traders in long Euro positions. No doubt quite a few stops were run ahead of the Euro’s resumption of its already started counter-trend rally. I am waiting for price to re-trace today’s smack-down to add to my long trade.
Well, it looks like the Santa Claus rally I called for is in fact upon us. Unfortunately for me I exited my longs some time ago. But profits taken is always a good thing. So I am not upset. I thought we would have a significant pull back to the 2050-2040 area. I was going to go long RUT/IWM at that point. It did not materialize.
Now I look for the next decent correction to reposition long. I prefer sooner than later. But I will not chase this market.
I am planning on a winter expedition in deep snow. I will be on top of at least 4 feet on New Year’s Day far into the wilderness. I already know the bears are hibernating. Seems to me the Wall Street bears are hibernating as well!
Price has passed the first target. Now for the second. Can it get there?
I’ve slightly redrawn the green channel. The S&P is back to it’s old trick of breaking a channel then continuing in the old direction.
When the channel is broken it must be by a reasonable amount of clearly downwards movement, not sideways. That’s the key I think. That would indicate intermediate (3) most likely over and intermediate (4) beginning.
A word about the degree of the next pullback: it may not be intermediate (4), it may be primary 4. Because intermediate (2) barely shows on the daily chart and so intermediate (4) may not show up either. It may be reasonably quick.
The next sizeable pullback in terms of duration is expected to be primary 4.
I think we are close (very close for a pull back)
I have around 1390 to 1400 on the Russell and 2250 to 2270 on the S&P
I am guessing it will be the FED for the infamous blow off. If it keeps rallying to those levels pre meeting then it sells off quickly. IF it stays here its got one last umph around the day of the meeting and then sells off. Either way 1% away if not now
Curioser and curioser!
DJI is on a tear. VIX is on a tear.
Somebody’s bluff is gonna get called. Big time!
SVXY puts behaving as expected, so far…. 🙂
That’s truly bizarre.
Something’s gotta give… soon….
While things could certainly change by the close, it is looking like double dojis above the upper BB in both SPX snd DJI. Until very recently, that used to be a very reliable set-up for an impending reversal, with a trigger coming after the second close back below the upper BB. Frankly, I have seen several instances recently where, despite that usually reliable signal, price continued skyward. Anomaly? Or new reality of bankster driven markets?
I recently mentioned that I am seeing more extremes in the markets than I have ever seen in all the years I have been trading. I am looking particularly at the way price has been trading at statistical extremities from the norm (by way of standard deviations) and doing so with a persistence that is nothing short of remarkable. This kind of price action does strange things to people. I completely understand the angst that drove Joe’s call for DOW 40,000.00. Interestingly enough, another keen market observer is also citing extremity of another sort (although they are clearly related) and that is trader sentiment. When it comes to that metric Jason Goepfert is the gold standard. He is reporting that 45% of his core indicators are showing extreme optimism; I repeat, extreme. That is a word that Jason does not throw around lightly. On the other hand, ZERO, of his indicators are showing pessimism. I know over the years we have all wrestled with the question of how CB interventions distorts markets and wrecks indicators, making them less useful when it come to executing profitable trades. There is no question in my mind that many of these indicators are being affected. The real question is how long can that continue. I do not believe the answer is indefinitely.
I am today doing something I have not done in awhile with regard to position sizing and am actually over 100% positioned long volatility. I added a block of SVXY puts to my current position (90.50 strikes). I could be proven wrong, but I simply do not believe the principle of reversion to the mean has been permanently abrogated. A move above 92 says the distortion will continue and I will at that point concede. 🙂
The COT update from tuesday shows large increases in commercial short positions in both the DJIA, and RUSSELL, and since that positioning is by the very banks that process orders from the FED, the logical conclusion is at least some sort of a decent correction is around the corner. Also, to your point Verne, this is as “blow-off toppy” as I could imagine.
That descriptor (blow-off) did indeed come to mind! 🙂