
Upwards movement was expected, but this is not what happened.
The main Elliott wave count was invalidated below 2,111.05 and the alternate Elliott wave count was confirmed. At that stage, only the alternate wave count remained. The target for that wave count remains the same.
Summary: Downwards movement is expected to continue to about 2,089. If this target is wrong, it may be a little too high. A new very bearish wave count is provided as a “what if?” but it requires confirmation below 1,810.10.
Last monthly chart for the main wave count is here.
New updates to this analysis are in bold.
MAIN WAVE COUNT
WEEKLY CHART
Click chart to enlarge.
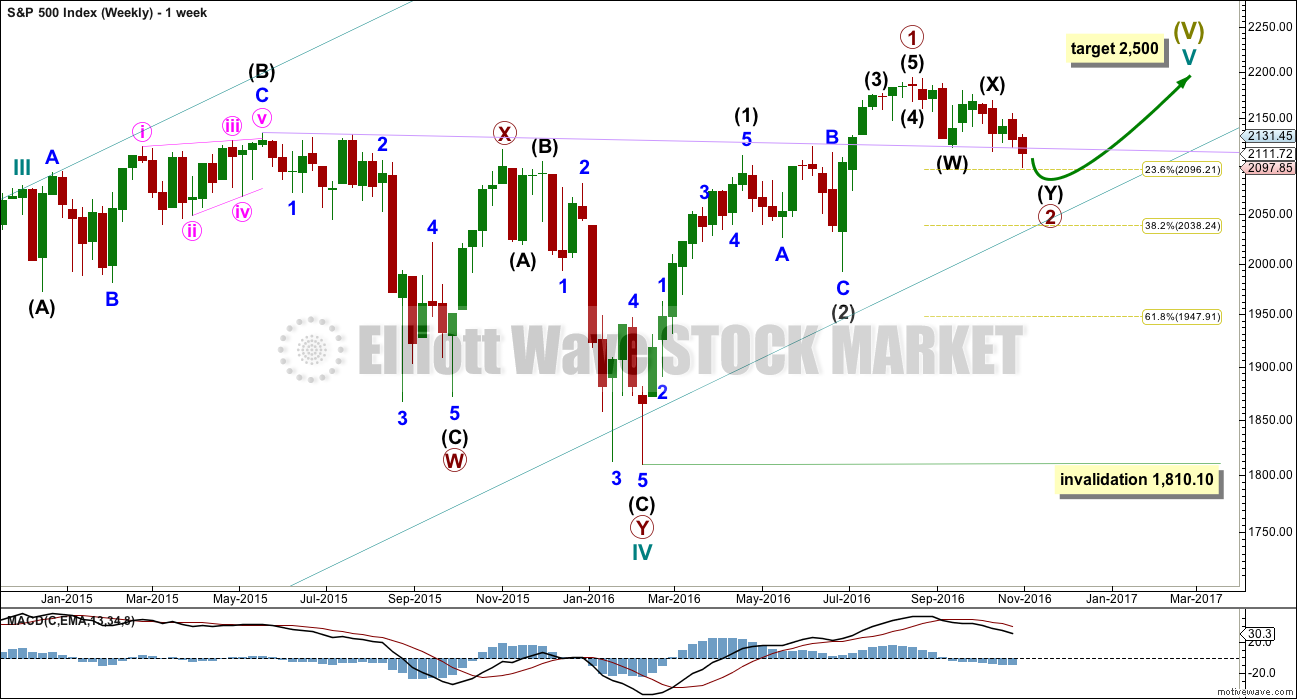
What if an impulse upwards is complete? The implications are important. If this is possible, then primary wave 1 within cycle wave V may be complete.
With downwards movement from the high of primary wave 1 now clearly a three and not a five, the possibility that cycle wave V and Super Cycle wave (V) are over has substantially reduced. This possibility would be eliminated if price can make a new all time high above 2,193.81.
If an impulse upwards is complete, then a second wave correction may be unfolding for primary wave 2.
Primary wave 2 may not move beyond the start of primary wave 1 below 1,810.10.
DAILY CHART

Click chart to enlarge.
Intermediate wave (1) was an impulse lasting 47 days. Intermediate wave (2) was an expanded flat lasting 47 days. Intermediate wave (3) fits as an impulse lasting 16 days, and it is 2.04 points short of 0.618 the length of intermediate wave (1).
Intermediate wave (4) may have been a running contracting triangle lasting 22 days and very shallow at only 0.0027 the depth of intermediate wave (3). At its end it effected only a 0.5 point retracement. There is perfect alternation between the deeper expanded flat of intermediate wave (2) and the very shallow triangle of intermediate wave (4). All subdivisions fit and the proportion is good.
Intermediate wave (5) would be very brief at only 18.29 points. Intermediate wave (5) is 1.43 points longer than 0.056 the length of intermediate wave (1).
At this stage, primary wave 2 now has a completed zigzag downwards that did not reach the 0.236 Fibonacci ratio. It is very unlikely for this wave count that primary wave 2 is over there; the correction is too brief and shallow. Upwards movement labelled intermediate wave (X) is so far less than 0.9 the length of the prior wave down labelled intermediate wave (W). The minimum for a flat correction has not been met. Primary wave 2 may continue lower as a double zigzag. A second zigzag in the double may be required to deepen the correction closer to the 0.382 Fibonacci ratio.
Intermediate wave (W) lasted a Fibonacci 13 sessions. Intermediate wave (X) is a complete triangle. X waves may subdivide as any corrective structure (including multiples), and a triangle is possible here.
So far intermediate wave (Y) has lasted 17 sessions. If it exhibits a Fibonacci duration, then it may end in another three sessions to total a Fibonacci 21, or another 17 sessions to total a Fibonacci 34.
Primary wave 2 may not move beyond the start of primary wave 1 below 1,810.10. A new low below this point would see the degree of labelling within cycle wave V moved up one degree. At that stage, a trend change at Super Cycle degree would be expected and a new bear market to span several years would be confirmed. A new alternate wave count below outlines this possibility.
HOURLY CHART
Click chart to enlarge.
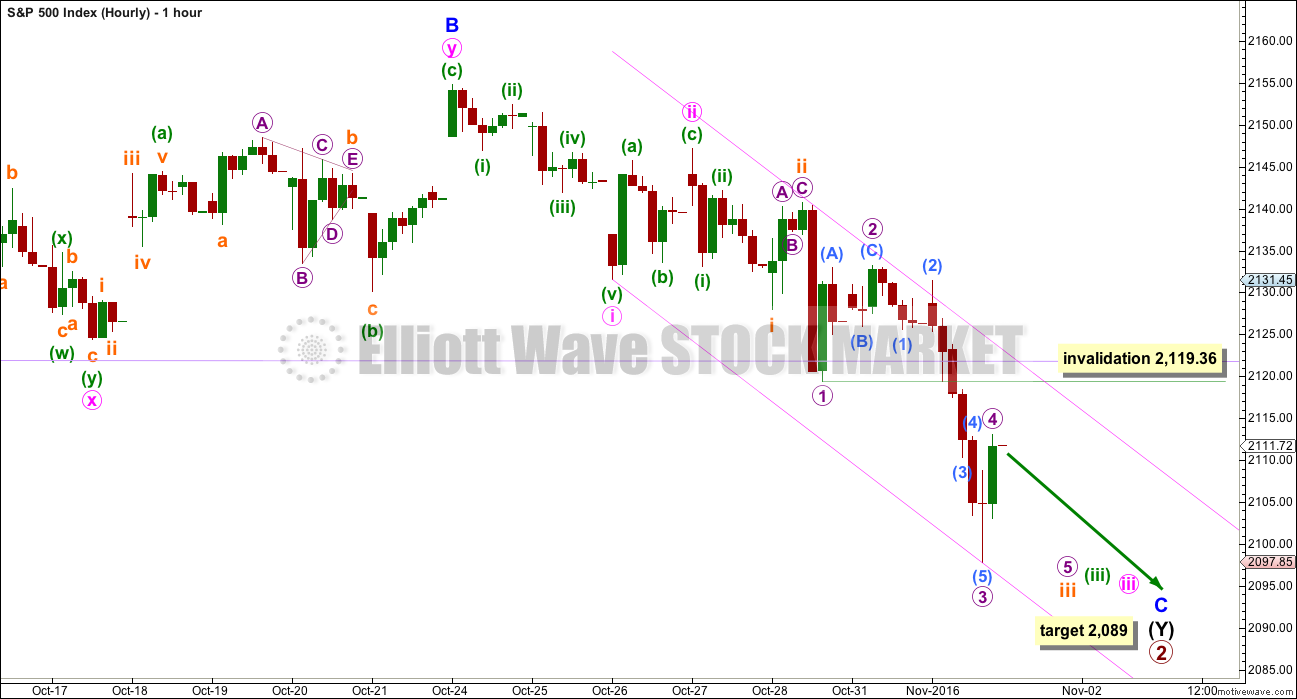
At 2,089 minor wave C would reach 1.618 the length of minor wave A. This would take intermediate wave (Y) somewhat below the end of intermediate wave (W), achieving its purpose of deepening the correction.
This wave count has now been confirmed with a new low below 2,111.05.
Within minor wave C, there may now be a series of four overlapping first and second waves.
The strong downwards movement for Tuesday’s session fits as the middle of a third wave. Price may now move through a series of small fourth wave corrections and fifth waves down to complete the whole structure of minor wave C.
Micro wave 3 is just 0.83 points longer than 1.618 the length of micro wave 1.
Micro wave 4 may not move into micro wave 1 price territory above 2,119.36.
When micro waves 4 and 5 are complete, then the invalidation point must move up to the end of subminuette wave i at 2,127.97. Subminuette wave iv may not move up into subminuette wave i price territory.
Now that the lilac trend line has been clearly and strongly breached by downwards movement, it would be typical behaviour of price to see a bounce to test resistance at the underside of this line. If this is how price behaves, it would offer a good low risk high reward entry point for a short position.
ALTERNATE WAVE COUNT
DAILY CHART
Click chart to enlarge.
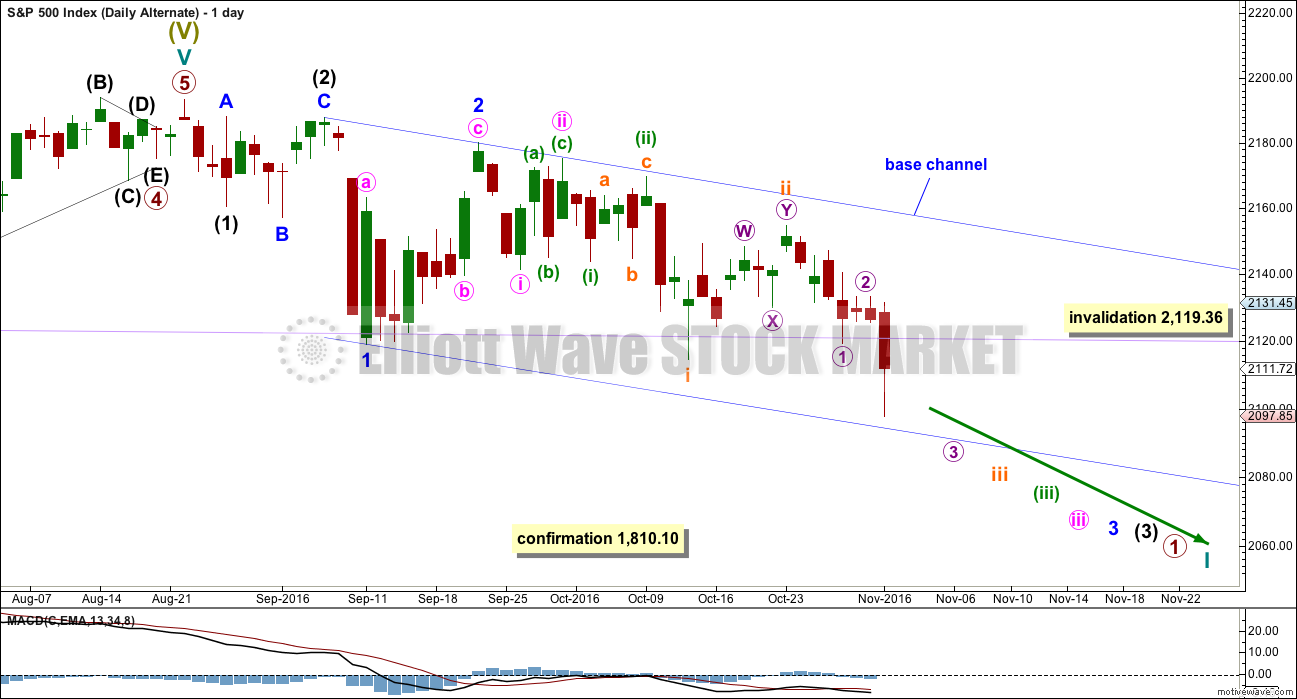
This wave count is new.
At this stage, a deeper pullback has been indicated by price for the main wave count. What if this downwards movement is the start of something even bigger?
This wave count expects that a new bear market to span several years and take price substantially below 666.76 has begun. For such a huge call it absolutely requires price confirmation below 1,810.10.
If a new bear market has begun, then the degree of labelling within the last impulse upwards is simply moved up one degree.
Downwards movement from the all time high may be a series of overlapping first and second waves. What looks like an obvious triangle must be ignored for this wave count. This is problematic, and it reduces the probability of this wave count. But this is a viable wave count.
The dark blue channel is a base channel about minor waves 1 and 2. Minor wave 3 should have the power to break through the lower edge of the base channel. The middle of minor wave 3 would not yet have passed for this wave count because price remains within the base channel.
Within the middle of the third wave, micro wave 4 may not move into micro wave 1 price territory above 2,119.36.
TECHNICAL ANALYSIS
WEEKLY CHART
Click chart to enlarge. Chart courtesy of StockCharts.com.
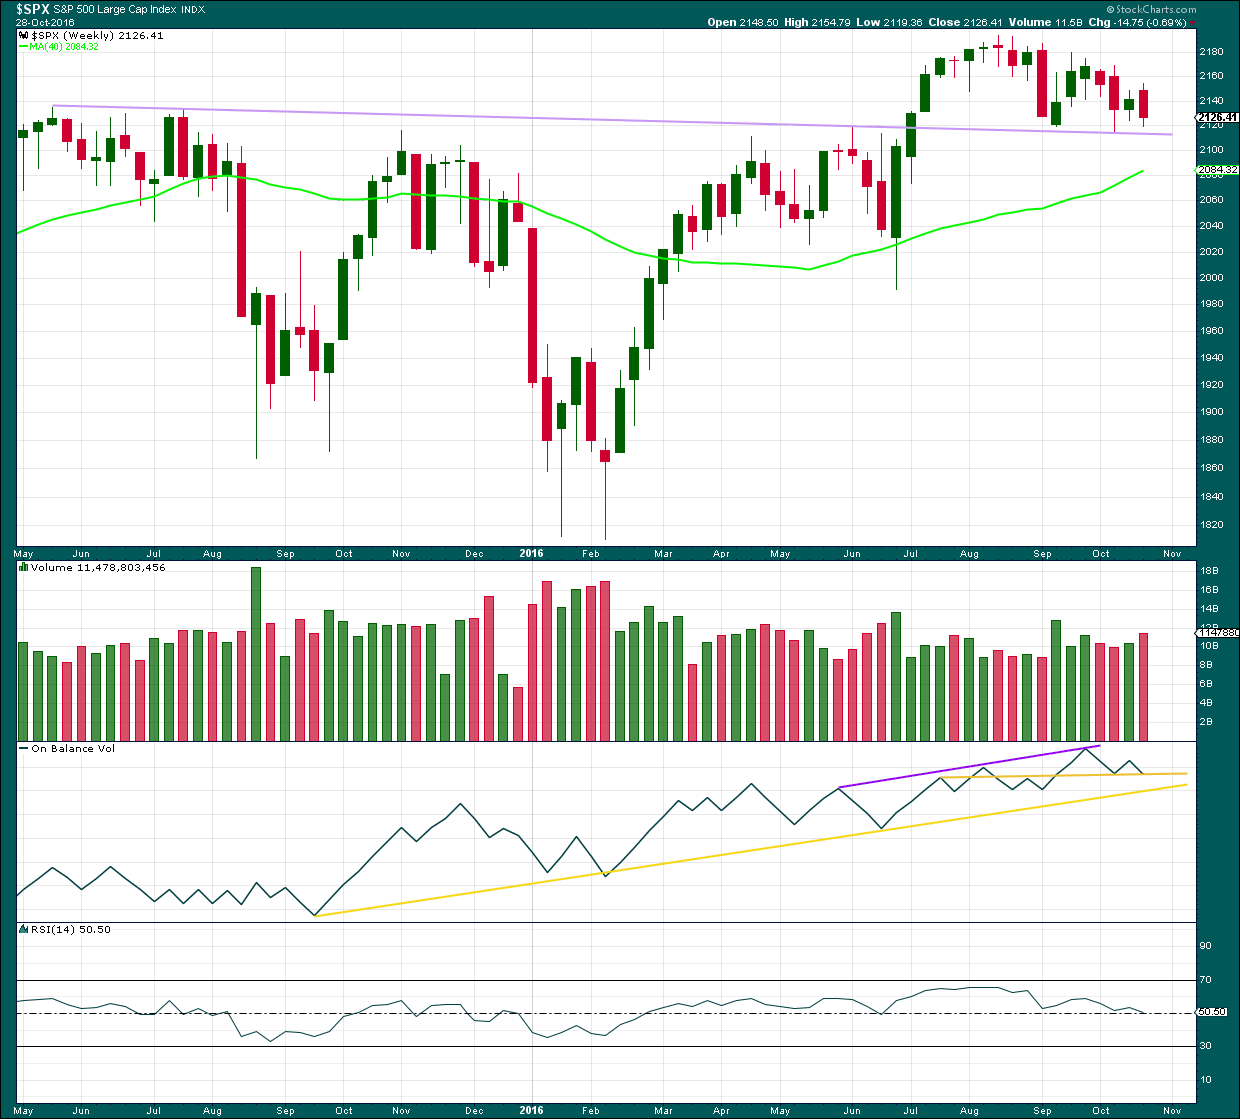
The lilac trend line has strong technical significance. Price broke through resistance, turned down to test support for the first time, and then moved up and away from this line. It was reasonable to conclude that a new all time high is a likely consequence of this typical behaviour.
Now price has come back down for a third test of the lilac trend line. A break below this line today is a highly significant bearish signal.
Last downwards week closes red and has support from volume. Increased volume last week is bearish.
At the weekly chart level, On Balance Volume may find support here at the horizontal yellow trend line, which may halt a further fall in price. This support line on OBV in conjunction with the lilac support line for price are strong indicators that downwards movement is very likely to be over.
RSI is still close to neutral. There is plenty of room for price to rise further.
DAILY CHART
Click chart to enlarge. Chart courtesy of StockCharts.com.
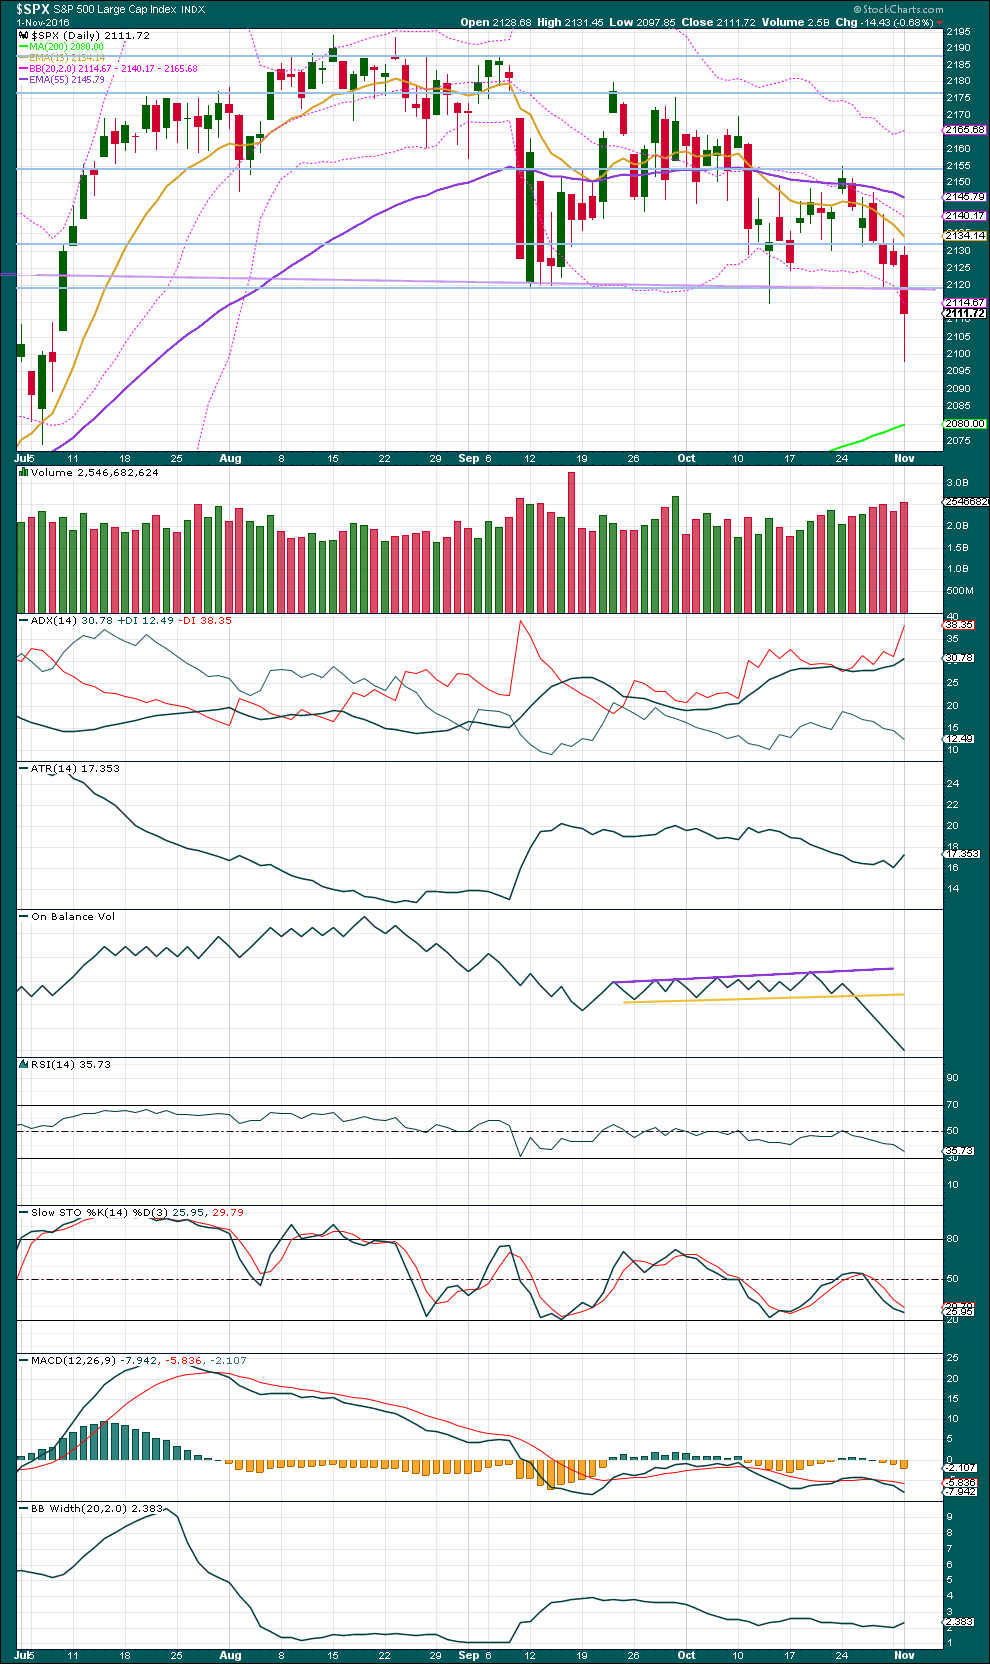
Price has moved for four days in a row overall downwards on increasing volume. The fall in price is supported by volume.
The breach of the lilac trend line (now drawn on this chart as well) is the strongest piece of technical analysis on all of the charts published today. This is a very strong bearish signal.
The warning given by On Balance Volume breaking below its support line was not given enough weight in last analysis. This too supports the main wave count.
The long lower wick on today’s red candlestick offers some bullishness. The bulls were able to rally at the end of the session to push price well up from the lows of the day. This is not a reversal signal, but it does indicate some caution about this downwards trend.
ADX is increasing, indicating a downwards trend is in place.
ATR shows some increase in range today, but one day of increase is not enough for confidence in a change.
Bollinger Bands show some widening today, but again one day is not enough for confidence that volatility has returned to this market for a reasonable period of time.
On Balance Volume remains very bearish.
RSI and Stochastics are not extreme. There is room for price to fall further. Next support is about 2,075.
VOLATILITY – INVERTED VIX CHART
Click chart to enlarge. Chart courtesy of StockCharts.com.
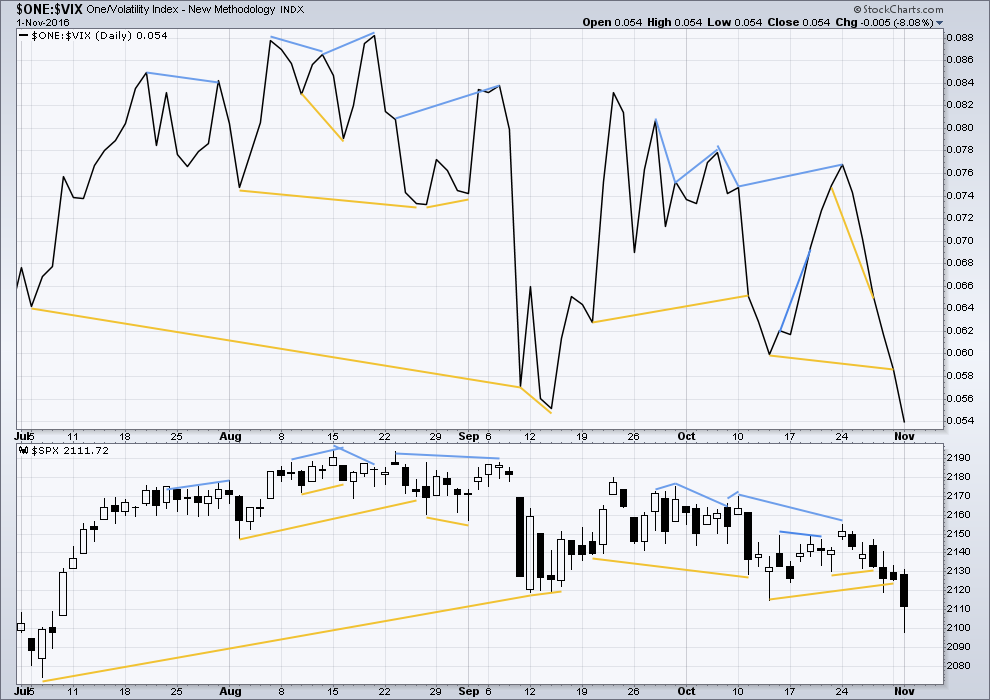
There are a few instances of multi day divergence between price and inverted VIX noted here. Bearish divergence is blue. Bullish divergence is yellow. It appears so far that divergence between inverted VIX and price is again working to indicate short term movements spanning one or two days.
Bullish divergence noted in yesterday’s analysis did not result in any upwards movement. While this divergence has been proven to be reasonably reliable over the last few months, it does not always work.
No new divergence is noted today.
BREADTH – AD LINE
Click chart to enlarge. Chart courtesy of StockCharts.com.
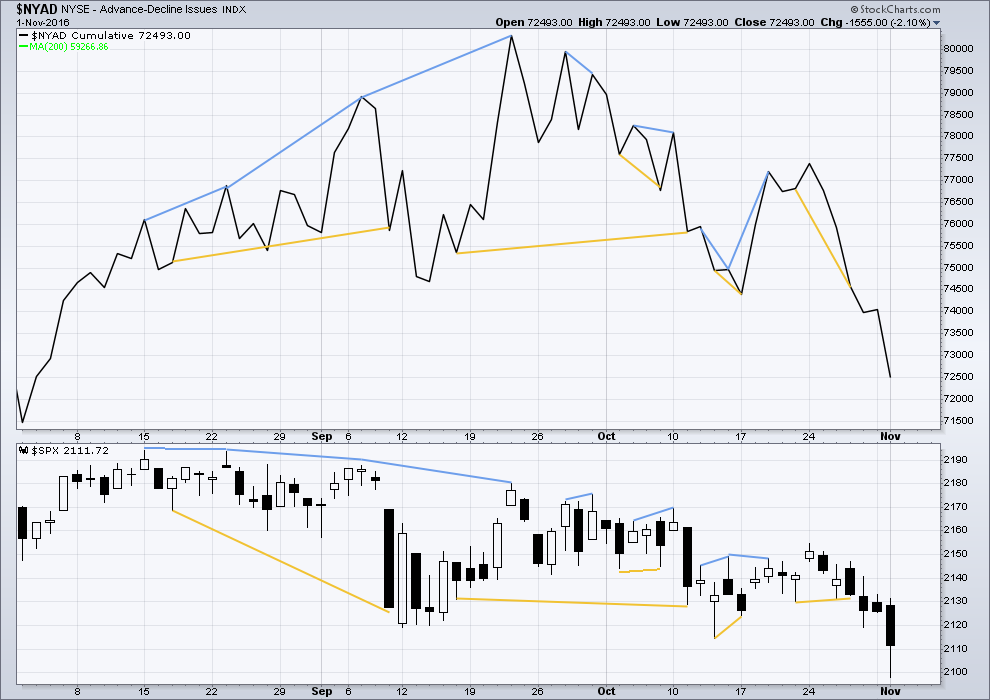
Short term bullish and bearish divergence is again working between price and the AD line to show the direction for the following one or two days.
The single day divergence noted yesterday did not result in any upwards movement, so it did not work. No new short term divergence is noted today between price and the AD line.
DOW THEORY
Major lows within the old bull market:
DJIA: 15,855.12 (15th October, 2014) – closed below on 25th August, 2015.
DJT: 7,700.49 (12th October, 2014) – closed below on 24th August, 2015.
S&P500: 1,821.61 (15th October, 2014) – has not closed below this point yet.
Nasdaq: 4,117.84 (15th October, 2014) – has not closed below this point yet.
Major highs within the bear market from November 2014:
DJIA: 17,977.85 (4th November, 2015) – closed above on 18th April, 2016.
DJT: 8,358.20 (20th November, 2015) – has not closed above this point yet.
S&P500: 2,116.48 (3rd November, 2015) – closed above this point on 8th June, 2016.
Nasdaq: 5,176.77 (2nd December, 2015) – closed above this point on 1st August, 2016.
Dow Theory Conclusion: Original Dow Theory still sees price in a bear market because the transportations have failed to confirm an end to that bear market. Modified Dow Theory (adding S&P and Nasdaq) has failed still to confirm an end to the old bull market, modified Dow Theory sees price still in a bull market.
This analysis is published @ 08:33 p.m. EST.
Oh Yeah. I forgot to mention, Go Cubbies. You know my old stomping ground was Chicagoland.
Well I mad my trip to the big city doc and got all good news. No need for surgery at this time. We will do “watchful waiting” with the next examination in a year. If anything changes with my voice then I go sooner. Great news for me.
For the market it is a mixed bag. We are reaching very oversold conditions. Fear vs Greed is still extreme fear. The put / call ratio is matching this past June / July period and almost as oversold as in January 2016. We may have reached a short term bottom or we may have a couple more days of downward pressure. But I am thinking the end of this correction is near,
Have a great day. I know I am and will tomorrow as well!
good news Rodney,, that rubber hose up your nose wasn’t so bad was it. watch out though,, next thing they will want to explore the other end,,
Indeed! They well might think exploring the other end would be the best way to get to the bottom of the matter and put the entire thing behind them…. 🙂 🙂 🙂
Boy wouldn’t that would be a bummer!!
That’s awesome to hear Rodney! Thank you for letting us know.
I’ll leave the bad taste jokes to Doc and Verne, they have that covered very well indeed 🙂
I am rolling on the floor laughing so hard I think I am going to pass out. I just noticed the insignia on the e-mail I got from Gingrich and went back to see if Rove’s similar attempted shake-down had the same one. The letters were identical in layout and yep; you’ll never guess how these clowns are representing themselves… ready?
THE NATIONAL TEA PARTY! 😀 😀 😀
Are members of the voting public really this stupid???!!! Say it ain’t so….!
You’re not going to believe it folks. Now I am getting spammed by Newt Gingrich!
What the…..!!!!!!! 🙂
Finally! Gadzooks!
Those were some sticky pivots.
Reloaded my shorts at the close. We should get a whole lot of red in futures overnight and go sailing away from those pivots with some gusto tomorrow. The bulls expended a phenomenal amount of capital trying to defend them but the bears were able to take them out finally. VIX should revisit the top of the BBs tomorrow in what should be the final climatic wave down to complete the correction. Have a great evening everybody! Stay Frosty! 🙂
Does the SPX Daily chart make any sense? If yes, then we will go to complete the right shoulder.
Unbelievable developments in the Weinergate story. The FBI did not only take the laptop but also a desktop AND the router. There is apparent evidence that the laptop’s contents were downloaded to a third party. Folk, we are talking treasonous epsionage!!!!
Wow! You cannot make this stuff up.
There are some other things they have discovered that you simply cannot discuss in polite company….no wonder Comey spilled the beans. There would have been national riots if this had come out after the election!
Strong move below the support shelf furiously bought by the banksters. They are determined to try and hold onto this pivot shelf. What hubris!
It’s still possible that micro 4 isn’t done, so if this short term prediction is wrong it may be in expecting downwards movement now to new lows, but price may move sideways for a day or two first.
The structure of minor C is incomplete.
Now that price is underneath that lilac trend line it should provide very strong resistance. If price comes up to touch it short term that’s an entry opportunity to go short, with low risk because stops may be set a little above the line.
It is really amazing Lara. The fact of the matter is that the long held support shelf in both DJI and SPX (unlike RUT) STILL has not be “properly” breached – even with VIX at these levels we are not really seeing true fear in this market, at least not as evidenced by price action. Wow!
Todays candlestick for the S&P will be fully below the lilac trend line. That’s pretty bearish IMO.
But that doesn’t tell us how deep this correction is going to go, only that the probability of “bad things happening” (I like this from Chris Ciovacco) are more likely now than before 🙂
I have to say that I fully agree.
Nonetheless, I am scratching my head is befuddlement as the banksters hold on those round number pivots. DJI and SPX are remarkably still ABOVE 18,000.00 and 2100.00 even after what appears to be a capitulation spike in VIX. This is more than strange and I have to say a little bit un-nerving. Most other charts have broken those shelves and it makes no sense whatsoever that they remain intact in DJI and SPX. Something does not quite add up…. 🙁
I have a contrary view. I expect the price to run up to SMA5 ( SPX 2120.03 or above ) and then if it happens; a run to 2080. The lower BB of SPX daily has been pierced 3 times already without a run to upper BB. It is rare to see price more than 3 BB pierces in any big movement.
VIX has had 3 upper BB pierces and is probably ready to run down to lower BB.
Ordinarily that is what I would expect, but this is supposed to be a primary degree wave correction and there is no way those pivots should not get smashed on the final wave down. The move in volatility price should normally be interpreted as a signal that downside momentum has peaked but I still cannot believe those pivots were not taken out. I just closed out my remaining short positions. I am admittedly a bit confused about what I am seeing…
Thanks. I closed my shorts too. Will re-enter if needed tomorrow.
Gold really popping the last few days. Miners may be signaling reversal ahead…
We could be tracing out a fourth wave correction. I’m looking for a sharp fifth wave down to complete this leg of the decline. We won’t know for several days whether the next move up is corrective or the start of another impulse up.
I got stopped out of my short Euro trade. Looking for a good re-entry. It has been surprisingly strong the last few trading sessions. Not bad for a dead-man-walking! 🙂
Vern,
Euro may stay range bound until election – unless we get a surprise from Fed today. Long term Euro is going substantially lower and building sizable short very prudent. I am expecting under .90 cents within 12 months. DX a good buy between 96-97 range.
I am shorting gold today (controversial) — taking a stab at it and plan to hold the position till year end — (build more if opportunity presents and scale out when appropriate).
I think you are right on all counts Sundeep. I’m underwater on my GDX short but when I see price cavorting above the upper BB as it has been the last few sessions I am going to stay put so to speak.
I am also expecting a reversal in the Euro soon. I got a bit sloppy on the expiration date of my bearish call spreads and had to bail. I probably should have just let the shares get sold short and hung in there.
IKR! That trickster Euro almost had me tricked… but I took a reasonable profit.
Now I’m watching it come up to trend lines…. and today it’s broken them. The final trend line is the green one. If it breaks above that I won’t be sure what’s happening in EW terms anyway.
Let me know the next time you are bailing will ya?
I REALLY hate letting a nice profit turn into a loss. I should know better!!! 🙂
Sorry Verne, I bailed on 1st Nov at 1.09703.
Cesar is better at profit taking than I am, and I’m taking some advice from him. Turns out we’re better as a team than we are separately.
I’m looking at the hourly chart and seeing weakness today, so this bounce may be either close to over or due for a deeper correction about now IMO.
I’m using a new system that Cesar’s developed: ETSI, KAMA, Alligator…. on different time frames to help with entry and exit, in conjunction with Elliott Wave to help with trend direction.
When I’m more comfortable with it and I’ve tested it further, if it’s working for me, then I may present it to this membership. For now, still testing.
Neat. I’ve got a little score to settle with FXE and I aim to I tell ya! 🙂 🙂
First Karl Rove, now James Carville. The man has gone stark raving mad, ranting on about how the KGB (were’t they disbanded eons ago??!) is in cahoots with Trump and Comey conspiring to interfere in the US election. I am afraid these folk have a dismally low view of the intelligence of the American public. You really could not make this stuff up!! 🙂 🙂
Yes Vern you can’t make this stuff up! They all will be going to jail at some point!
Do you believe the following after all that has already been covered up? Cover-up in progress from the Justice Department… oh excuse me the corrupt No Justice Department!!!!
DOJ’s Peter Kadzik Exposed Colluding With Clinton Campaign
On Monday we were the first to note that Podesta’s friend Peter Kadzik was the DOJ representative chosen to head up a “thorough” review of the new Huma Abedin emails as revealed by a letter he wrote to Congress. Given Kadzik’s personal relationship with Podesta, it seemed like a “convenient” choice for the Clinton campaign.
In the letter to Congress, the DOJ writes that it “will continue to work closely with the FBI and together, dedicate all necessary resources and take appropriate steps as expeditiously as possible,” assistant attorney General Peter J. Kadzik writes in letters to House and Senate lawmakers.
“Ironically”, that is the same Peter Kadzik who has proven his “impartiality” in multiple WikiLeaks emails including this newly released bombshell in which Kadzik provides a very helpful “heads up” about Hillary’s email server investigation. This is what Kadzik emailed to John Podesta (via gmail) on May 19, 2015:
There is a HJC oversight hearing today where the head of our Civil Division will testify. Likely to get questions on State Department emails. Another filing in the FOIA case went in last night or will go in this am that indicates it will be awhile (2016) before the State Department posts the emails.
Perhaps Mr. Kadzik could explain to our readers – and the American public – why this particular message was delivered via his private, gmail account rather than his official DOJ email account?
Sure, who needs an independent investigator, this guy will do just fine.
And for readers who missed our original report on the long-running relationship between John Podesta and his close friend Peter Kadzik, here is an excerpt from our most recent article on the topic:
In the letter to Congress, the DOJ writes that it “will continue to work closely with the FBI and together, dedicate all necessary resources and take appropriate steps as expeditiously as possible,” assistant attorney General Peter J. Kadzik writes in letters to House and Senate lawmakers.
#BREAKING Senior DOJ official sends letter to lawmakers responding to request for more information about email review.#8days pic.twitter.com/PCgT2ODkQd
— Just the Facts (@JTF_News) October 31, 2016
So far so good, even if one wonders just how active the DOJ will be in a case that has shown an unprecedented schism between the politically influenced Department of Justice and the FBI.
And yet, something felt odd about this.
Kadzik… Kadzik… where have we heard that name?
Oh yes. Recall our post from last week, “Clinton Campaign Chair Had Dinner With Top DOJ Official One Day After Hillary’s Benghazi Hearing” in which we reported that John Podesta had dinner with one of the highest ranked DOJ officials the very day after Hillary Clinton’s Benghazi testimony?
It was Peter Kadzik.
http://www.zerohedge.com/news/2016-11-02/more-collusion-between-clinton-campaign-and-doj-kadzik-provides-heads-podesta
They are in serious trouble. Obama is canceling appearances with the Clintonista. Does anybody really believe Comey made that announcement without the approval of his boss in the White House??!!
There is an awful lot going on behind the scenes folk.
Note Ms. Abedin’s glaring absence from the scene…
Obama campaigning for Clinton in NC today —
I hope they can avoid the rioters! Hee! Hee!
IWM continues to lead the way. The pivots should fall today. Just how far below them we close is going to be of great import. This is in keeping with Lara’s downside target.
I guess Madam Clinton has already bought fireworks in anticipation of her winning the white house next Tuesday. Talk about counting chickens!! 🙂
I’m really looking forward to this awful election being over.
I’m over it already.
Me too Lara –
🙂
Seeing as the result is going to have an effect globally it seems a bit unfair that we don’t get to vote.
But then, I’m a contrarian and a trouble maker (an “uppity young woman” I have been called. meh) so I’d probably be voting for a third party.
Voting for third party in this election is wasting the vote IMHO.
That’s true…. if that’s what everyone believes.
But then, with a non proportional not directly representational system (you can see I don’t have a good opinion of USA’s democracy system) that is often the case.
I’d still be voting for a third party though. Protest… whatever. I just don’t think I could bring myself to vote for Clinton or Trump.
But it’s all academic anyway as I can’t vote.
The first time I voted in NZ we had a non proportional system, I was in a strong National Party electorate and I hated them. So I voted for McGullicudy Serious… who were anything but serious. Bananas for everyone, and war with paper swords and flour bombs. Their main policy? Dismantle parliament.
Told you I was a trouble maker 😉
The price action in the market reminds of an MMA battle taking place on the mat, where one of the combatants is an expert in “ground and pound” technique, wearing the opponent out on the way towards an inevitable submission by way of tap-out, or choke-out – whichever comes first. Looks like the banksters are on the bottom…. 🙂
DJI 18,000.00 slipping away, SPX 2100.00 should follow shortly….what happens after that should be quite telling – especially in SPX. If they surrender 2000.00 things could get ugly. I am personally expecting we will find very strong support and a likely reversal in that general area.
John Thomas, the Mad Hedge Fund Trader just gave a seminar in which he outlines how an all-out knock-down drag-out fight is brewing between Mr. Market and the central banksters, who are hell-bent on going all-out to keep Mr. Market (who is simply quite tired and wants to lie down and take a break) propped up on his feet and displaying a general air of good health. He made a good case that they are feverishly coordinating their efforts in this endeavor and thinks that they are playing an ultimately loosing game. He is also unsure about whether they have one more hurrah left or if the game is already up. They clearly have been trying to keep things propped up at least until after the elections next Tuesday and seem to be having a tough time of it.
Yep. Seems legit.
Mr Market is a Dead Man Walking too?
Interesting observation from Kimble. One of the few (apart from Eduardo Mirahyes of Exceptional Bear) to argue that a top may be in.
It is very instructive to observe the increasing impotence of the banksters. When was the last time you saw them able to jack futures up as they so frequently did to stymie bearish traders? Even now they are fecklessly trying to pretend the market is not in a down-trend and wasting their capital in an idiotic attempt to arrest the decline rather than let the market find its proper level. This makes for a protracted and painful process as the wave works it way to completion. Seems to me far better to be over and done with it. This could go on longer than we think… 🙂
The news media in the US has become a global laughing stock. They are already engaged in spewing co-ordinated drivel about how the market hates “uncertainty” (Trump doing well in the polls) to explain the market’s recent slide. Over the past few months a few alternative news outlets have aired amazing montages of numerous news reporters from different networks using the exact same words and phrases to report on news events, obviously given to them all by the same handlers. We are living in strange times.
Thanks Lara for the great analysis. With the BB penetrations we saw today, I suspect the next swing bottom is not far off. Thanks also for your well wishes.
Thanks to all for your well wishes and especially for your prayers for me tomorrow. The examination is not a big deal. They just shove a tube with a light up the nose and then down the throat! The big deal is that I have to drive 4 hours each way to reach the medical school / hospitals. The potential surgery afterwards, which is expected, is not really complicated either. It is just the possible loss of my voice that creates concerns. My primary vocation for the last 17 years is totally dependent upon the use of my voice and I do not want to retire yet. But I know I am in good hands. Maybe I ought to just go see doc. He is not that far from me!
Good trading and prosperity to all my friends who frequent this blog. Let’s see if when the SPX breaks 2200 if the number of posts per day increases.
sorry to hear about your temporary setback Rodney. So you are getting the ole up your nose with a rubber hose treatment eh? I cant help with your larry Rodney, unless its caused by nerve pressure in yer neck. good luck with the procedure, I’m sure you will do just fine. See what happens when you live in Nowhere? It takes 4 hours to get anywhere.
He’s a real nowhere man, living in a nowhere land.
Isn’t he a lot like you and me.
Nowhere man. That’s me alright.
I knew you were a back doc by you ID. But I thought I might save some money!
Best of luck Rodney. We’ll be waiting to hear how you’re doing when you’re ready 🙂
http://elliottwavestockmarket.com/2016/10/15/sp-500-elliott-wave-technical-analysis-14th-october-2016/#comment-65937
SVXY
– look at the price action during June, July, & August 2015…how does it compare to the last few months?
– look at the indicators during the same two periods…do they look reasonably similar?
– look at the bottom ribbon indicator…was today a game changer?
– “History doesn’t repeat itself but it often rhymes”
Very interesting. Today could indeed be a game changer. An amazing number of charts are clearly displaying topping patterns and despite the recent action in VIX, the relentless buying of the banksters has convinced far too many folk that this market will always ultimately keep going higher. I think it would be a mistake to entirely dismiss Lara’s alternate. At the risk of sounding like a broken record, I want to see how price trades around the round numbers. One of the early signs of the beginning of a serious and sustained market decline is that previous strong support pivots are taken out back and shot, so to speak. Futures so far not showing a blood-bath necessarily tomorrow, but then again, in markets where there has been such unprecedented central bank intervention, we cannot be confident that the ususal price discovery metrics will work as they should. This in fact includes futures and the upper BB penetration by VIX. At some pint they will return to normal, despite the current distortions caused by the banksters. A time for great caution imo
Hi Lara:
Can we draw any conclusions about whether the strongest part of the decline has passed (for minor C ) based on the current wave structure?
You actually answered y question later on in the analysis…I should have just kept reading….never mind! 🙂 🙂
(A few of you will remember Gilda Radner, Miss Emily Litella from SNL)
https://www.youtube.com/watch?v=TNrcKusFAiw