
Upwards movement was expected again for Monday, which is exactly what has happened.
Summary: The main wave count now expects upwards movement here for a fifth wave to end a third wave. The target is at 2,226 – 2,227. This bull market is ageing, but it still shows some signs of strength and is not done yet. Corrections present an opportunity to enter the trend.
Last monthly chart for the main wave count is here.
Last weekly chart is here.
New updates to this analysis are in bold.
MAIN WAVE COUNT
DAILY CHART
Click chart to enlarge.
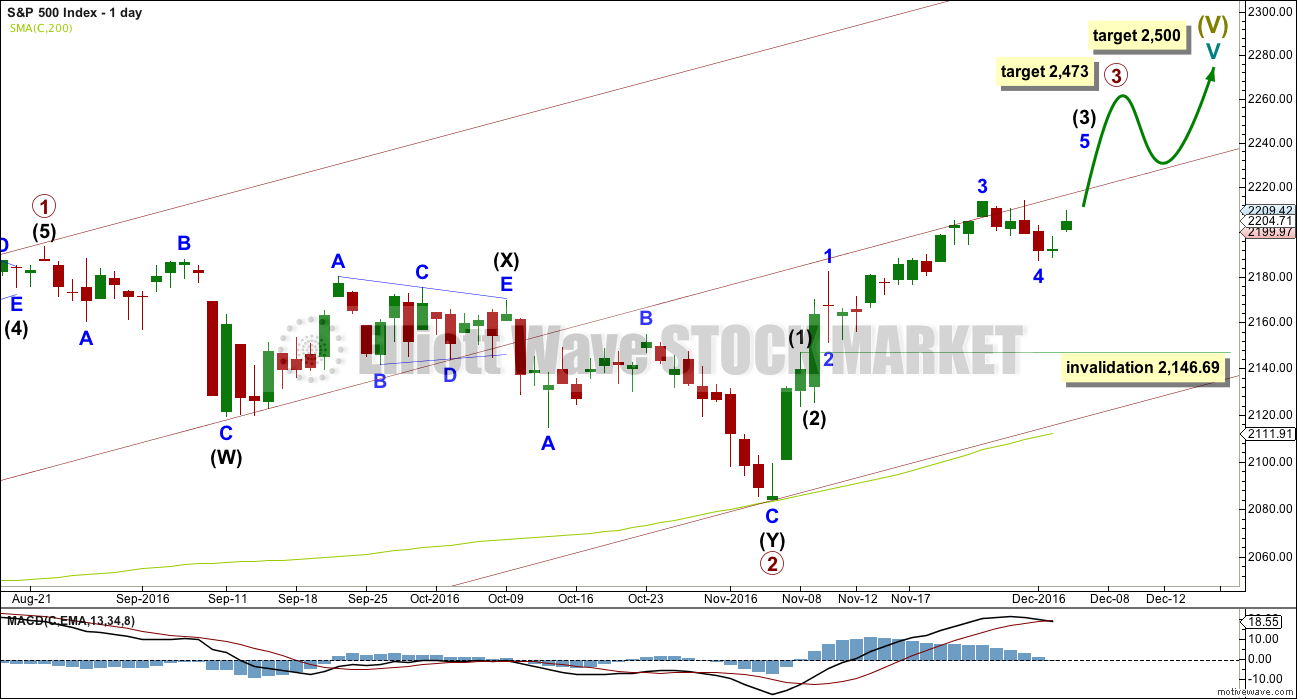
Cycle wave V must subdivide as a five wave structure. At 2,500 it would reach equality in length with cycle wave I. This is the most common Fibonacci ratio for a fifth wave for this market, so this target should have a reasonable probability.
Cycle wave V within Super Cycle wave (V) should exhibit internal weakness. At its end, it should exhibit strong multiple divergence at highs.
Within cycle wave V, primary waves 1 and 2 may be complete. Primary wave 3 may be over halfway through and is so far exhibiting weaker momentum than primary wave 1, which fits with the larger picture of expected weakness for this fifth wave at cycle degree. It is possible primary wave 3 may fall short of the target and not reach equality in length with primary wave 1.
Within primary wave 3, the upcoming correction for intermediate wave (4) should be relatively brief and shallow. Intermediate wave (1) was over very quickly within one day. Intermediate wave (4) may last a little longer, perhaps two or three days, and may not move into intermediate wave (1) price territory below 2,146.69.
At 2,473 primary wave 3 would reach equality in length with primary wave 1. This Fibonacci ratio is chosen for this target calculation because it fits with the higher target at 2,500.
When primary wave 3 is complete, then the following correction for primary wave 4 may last about one to three months and should be a very shallow correction remaining above primary wave 1 price territory.
The maroon channel is redrawn as a base channel about primary waves 1 and 2. Draw the first trend line from the start of primary wave 1 at the low of 1,810.10 on the 11th of February, 2016, then place a parallel copy on the high of primary wave 1. Add a mid line, which has shown about where price has been finding support and resistance.
HOURLY CHART
Click chart to enlarge.
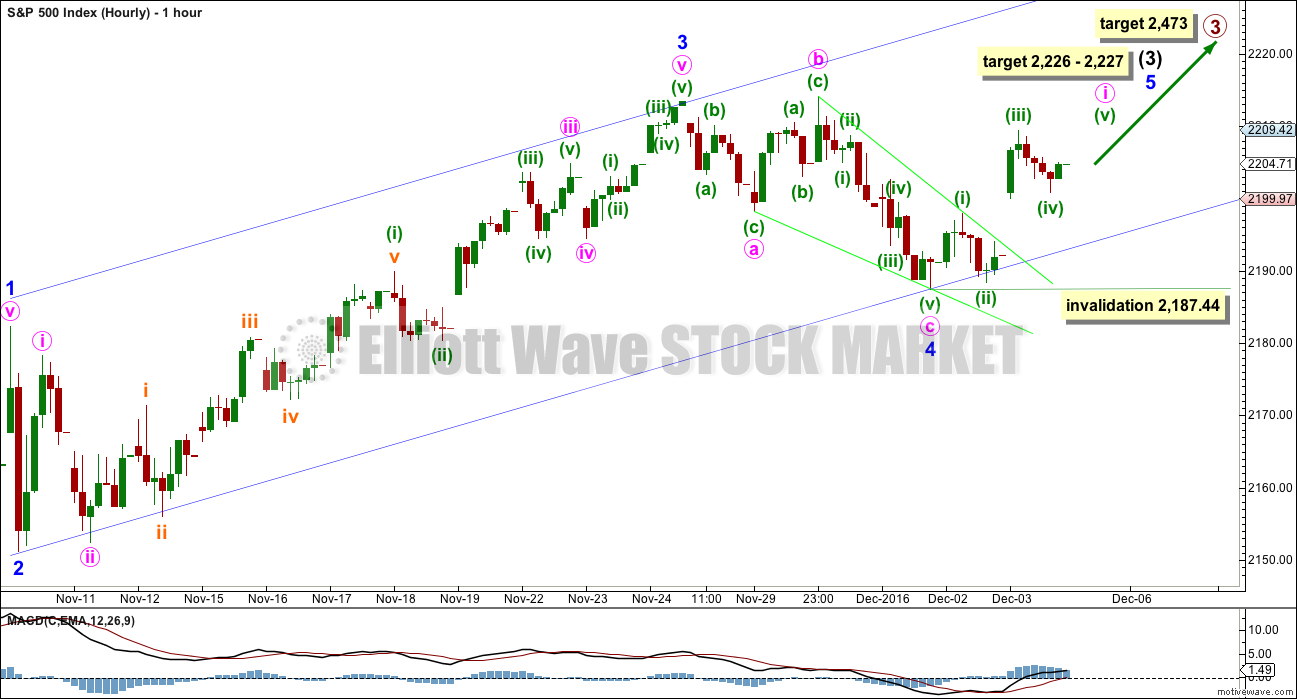
At 2,227 intermediate wave (3) would reach 1.618 the length of intermediate wave (1).
Now within intermediate wave (3), at 2,226 minor wave 5 would reach 0.618 the length of minor wave 3. This gives a 1 point target zone calculated at two degrees.
This wave count sees the middle of a third wave particularly weak; this is not common. The larger context of a fifth wave at cycle and Super Cycle degrees may see persistent unusual weakness though, so this wave count is possible.
I think there is enough upwards movement now to move the invalidation point higher. It looks extremely unlikely that minor wave 4 would continue further, because it would be grossly disproportionate to minor wave 2 if it did.
Within minor wave 5, no second wave correction may move beyond the start of its first wave below 2,187.44. Within minor wave 5, a five up for minute wave i may complete tomorrow and be followed by a three down for minute wave ii. If minute wave ii is deep, it may fill the gap left this morning. Minute wave ii should find support at the lower edge of the blue channel.
The wider blue channel is redrawn using Elliott’s second technique. Draw the first trend line from the ends of minor waves 2 to 4, then place a parallel copy on the end of minor wave 3. If minor wave 4 is over, then along the way up within minor wave 5 corrections should find support at the lower edge of this channel.
However, the S&P does not always work well with trend channels. Sometimes the S&P breaches channels and then continues in the prior direction. A breach of the lower edge of this channel would be a warning of a possible trend change, but it would not be a strong warning.
The S&P often forms slow rounded tops. When it does this the many subdivisions make analysis difficult. Only when support is breached by movement that is clearly downwards and not sideways would it be an indication of a deeper pullback.
Minor wave 5 may end about mid way within the channel. It must subdivide as a five wave structure. It may last about one or two weeks.
ALTERNATE WAVE COUNT
DAILY CHART
Click chart to enlarge.
There is a wave count that fits for the Dow Industrials that sees an imminent trend change. It relies upon an ending diagonal, but that idea will not fit well for the S&P.
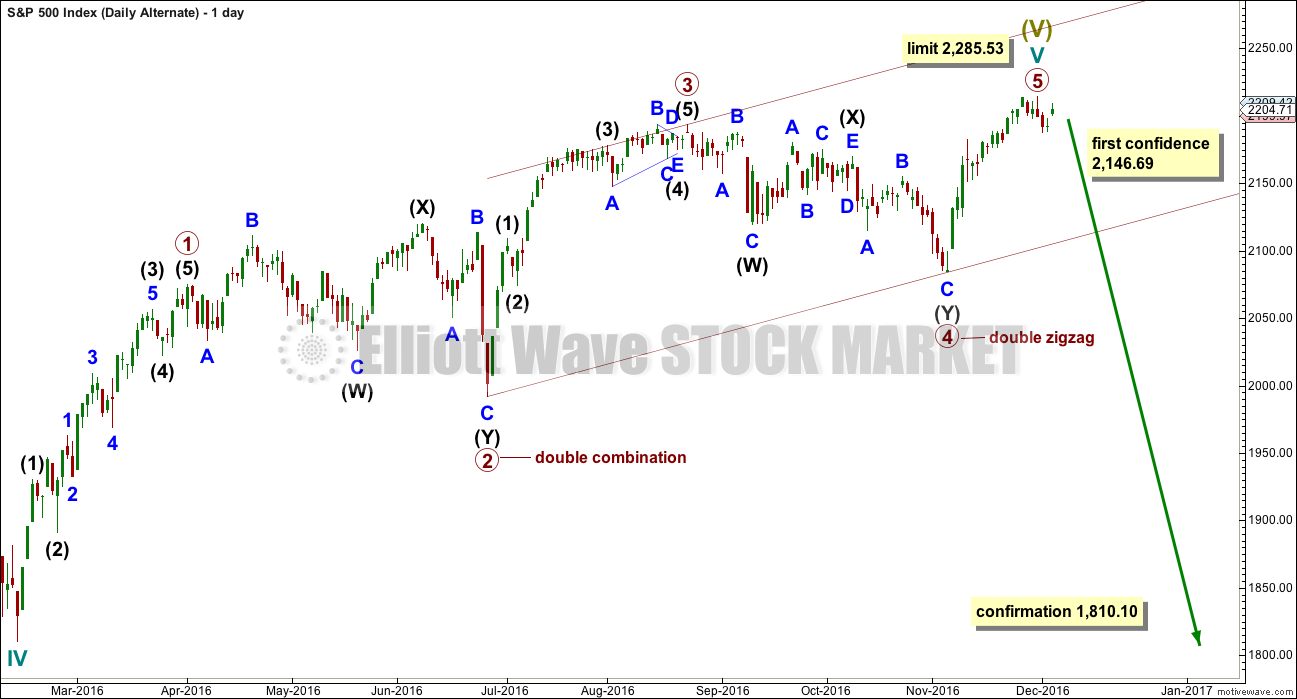
What if an impulse upwards is now complete? The large corrections labelled primary waves 2 and 4 do look like they should be labelled at the same degree as each other, so that gives this wave count the right look.
Primary wave 4 ends within primary wave 2 price territory, but it does not overlap primary wave 1. Primary wave 1 has its high at 2,057 and primary wave 4 has its low at 2,083.79. The rule is met.
There is alternation between the double combination of primary wave 2 and the double zigzag of primary wave 4. Even though both are labelled as multiples W-X-Y, these are different structures belonging to different groups of corrective structures.
Primary wave 3 is shorter than primary wave 1. This limits primary wave 5 to no longer than equality with primary wave 3 at 2,285.53.
The equivalent wave count for DJIA expects an end now to upwards movement and the start of a large bear market. Only for that reason will this alternate for the S&P also expect a reversal here.
This wave count has good proportions. Primary wave 1 lasted a Fibonacci 34 days, primary wave 2 lasted 60 days, primary wave 3 lasted 40 days, and primary wave 4 lasted 52 days. Primary wave 5 may be more brief than primary wave 3. If primary wave 5 is over now as labelled, then it may have ended in 18 sessions so with no Fibonacci duration.
If there has been a substantial multi generational trend change last week, then price should be falling with strength. The fact that it is not must reduce the probability of this wave count. This wave count remains technically viable, it is a warning of a potential fall in price, but it does not have support from classic technical analysis this week.
DOW JONES INDUSTRIALS
DAILY CHART
Click chart to enlarge.
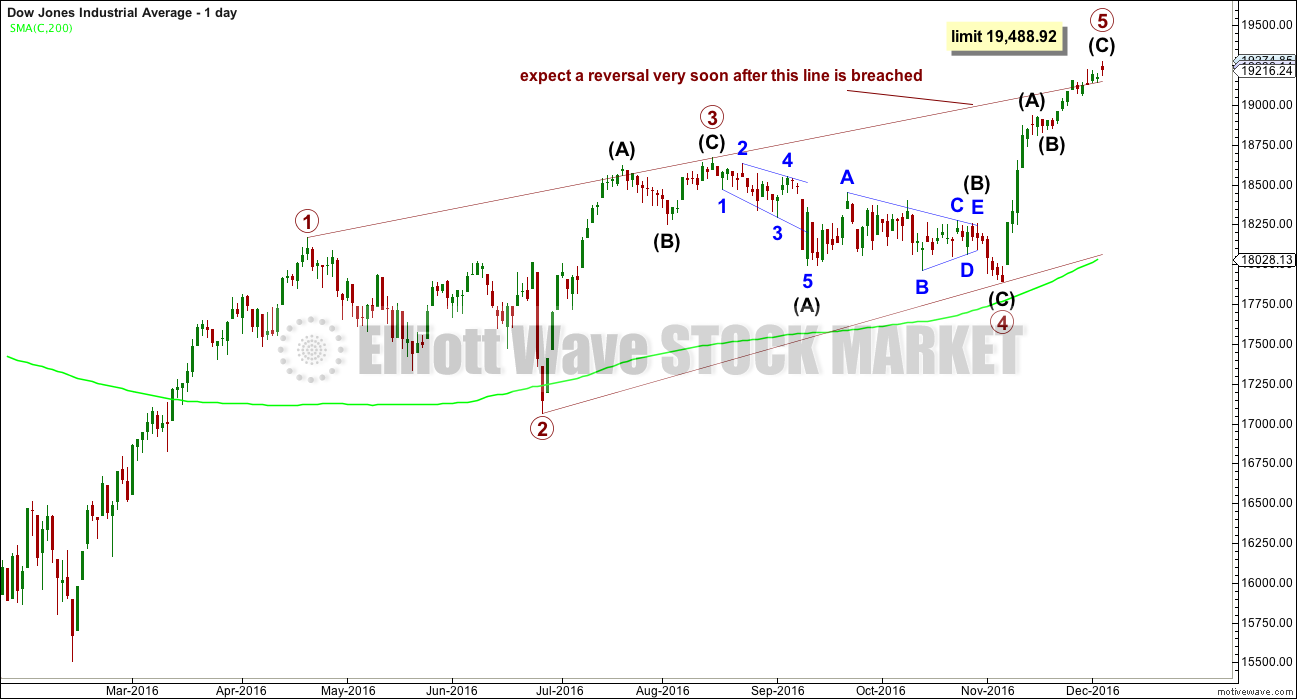
An ending contracting diagonal may be complete for the DJIA. This fits into the same picture as the alternate wave count for the S&P; both see a final fifth wave coming to an end very soon.
The 1-3 trend line is now overshot. Contracting diagonals normally end very quickly after this line is overshot, and it can be surprising how small the overshoot is. This wave count expects a very strong reversal.
The reversal is usually swift and strong when ending diagonals are complete. Today’s candlestick fully above the upper edge of the 1-3 trend line may possibly be a slightly larger than common overshoot. It is again possible that today saw the last high for many years in the DJIA. However, this still has no support from classic technical analysis. It is one possibility only in a realm of possibilities to consider.
The diagonal is contracting, so the final fifth wave is limited to no longer than equality in length with primary wave 3 at 19,488.92.
TECHNICAL ANALYSIS
WEEKLY CHART
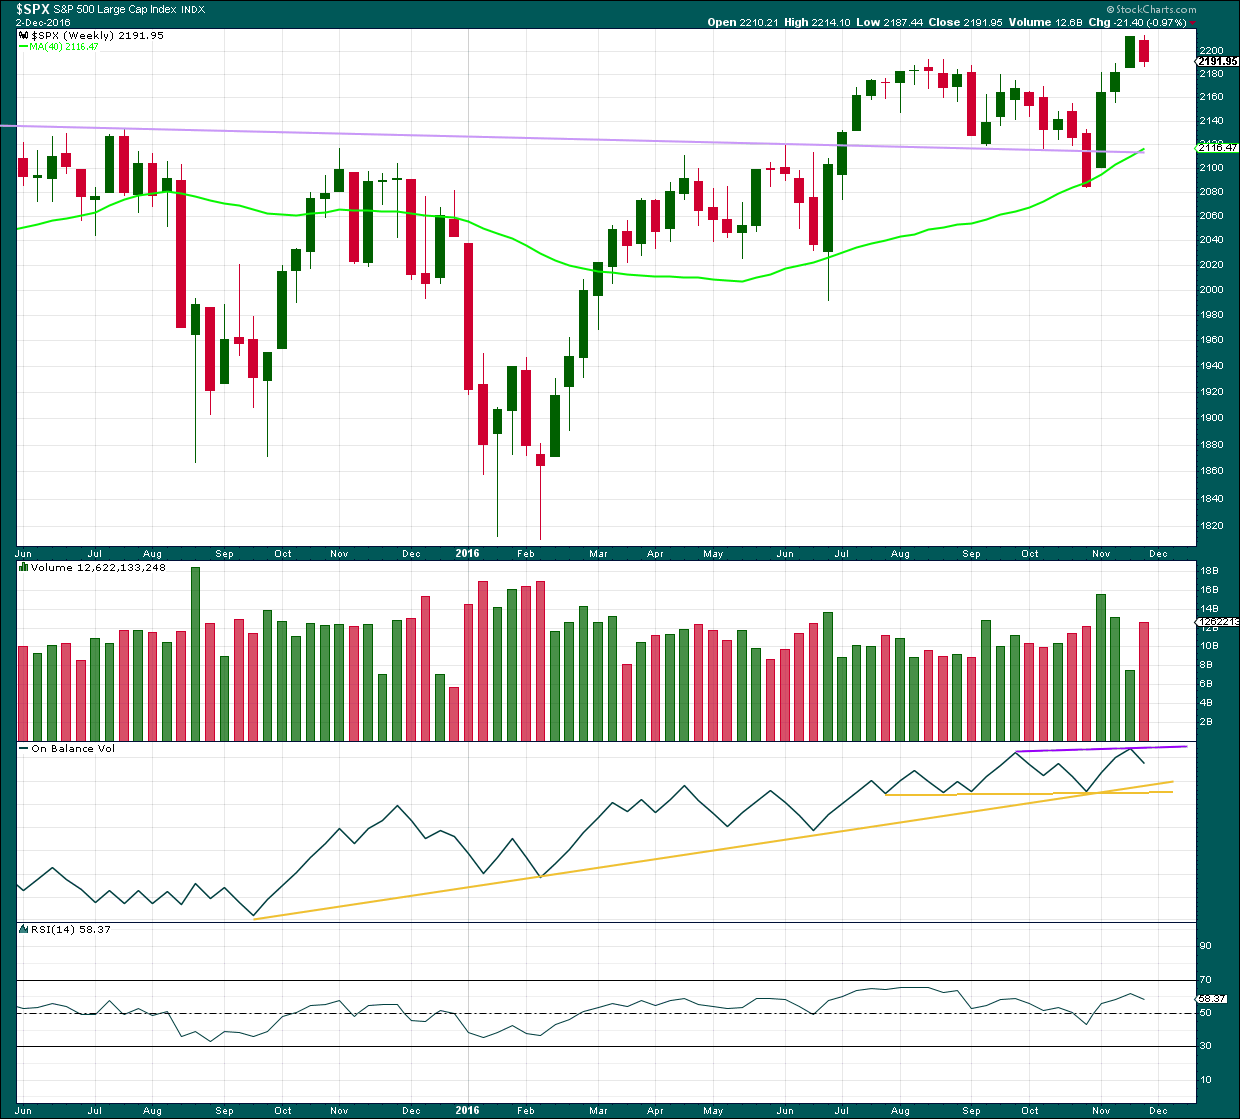
Click chart to enlarge. Chart courtesy of StockCharts.com.
Price moved overall upwards last week with a higher high (slightly) and a higher low. But the week closed with a red candlestick.
On Balance Volume last week moved lower. With stronger volume last week, the balance of it was downwards. The fall in price this week was supported by volume.
If price falls further this week, then the support lines for OBV may assist to hold the fall, at least temporarily.
If OBV breaks above the purple resistance line, that would offer a weak bullish signal.
RSI is not extreme. There is room for price to rise. There is mid term divergence with price and RSI for the new high last week and the high in August. This indicates weakness, but this is expected from the Elliott wave count.
DAILY CHART
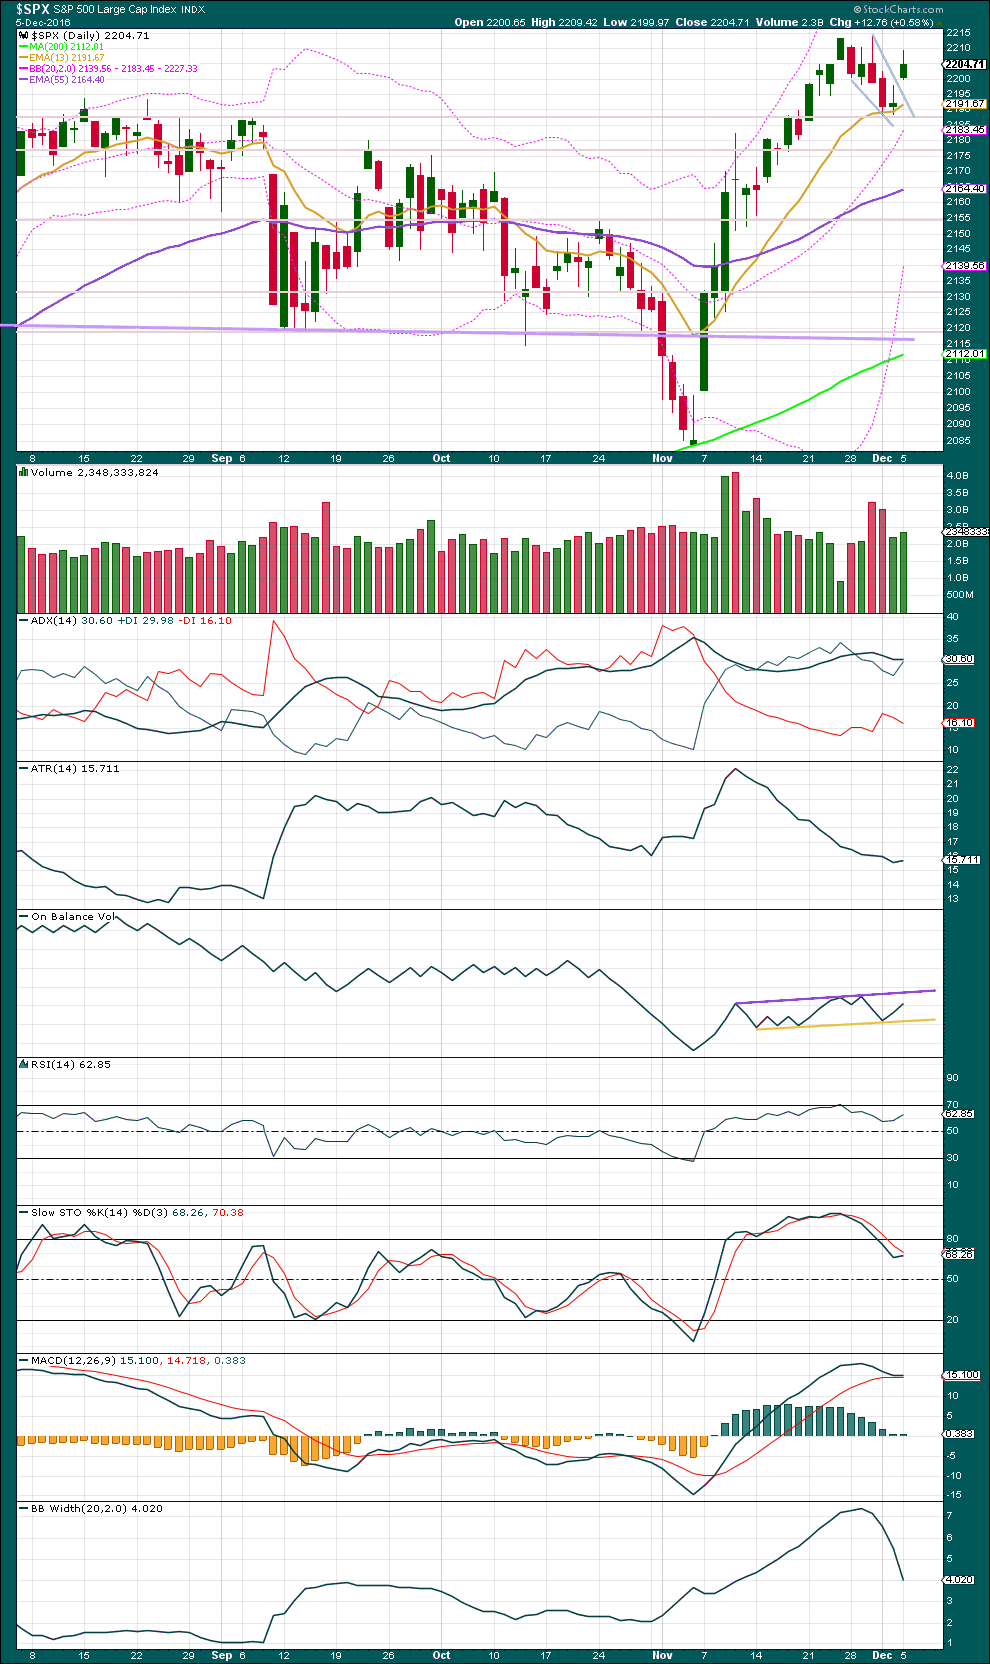
Click chart to enlarge. Chart courtesy of StockCharts.com.
A green daily candlestick has created an opening gap. This may be a breakaway gap following a small pennant pattern. The small pattern slopes away from the prior trend and the trend lines of it slightly diverge.
The gap open and upwards day come with some increase in volume. It is fairly likely that tomorrow will move price higher.
Using the measured rule, a target for the next movement up would be 2,318.
On Balance Volume is still constrained. A breakout of support or resistance would offer a bearish or bullish signal.
ADX declined very slightly today from 30.63 to 30.60, indicating no clear trend. ATR remains overall declining and Bollinger Bands are contracting. There is room for price to rise again; ADX is not extreme.
Neither RSI nor Stochastics are extreme. There is room for price to rise again.
MACD has not offered a bearish crossover.
The short term average today increased. It remains above the mid term average which is above the long term average. All are pointing upwards, and price is above all three. Price may have just last week found support at the short term average. The probability that a bull market remains intact is greater than a deep pullback here.
VOLATILITY – INVERTED VIX CHART
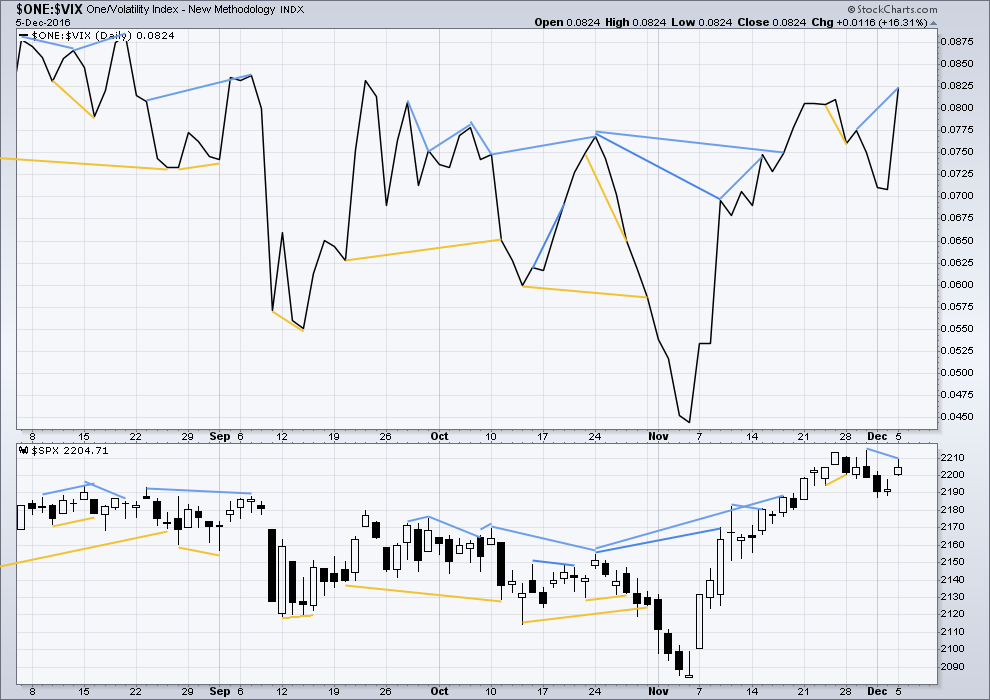
Click chart to enlarge. Chart courtesy of StockCharts.com.
There are a few instances of multi day divergence between price and inverted VIX noted here. Bearish divergence is blue. Bullish divergence is yellow. It appears so far that divergence between inverted VIX and price is again working to indicate short term movements spanning one or two days. While this seems to be working more often than not, it is not always working. As with everything in technical analysis, there is nothing that is certain. This is an exercise in probability.
The single day bearish divergence noted in last analysis between price and inverted VIX has not been followed by a downwards day. It is concluded that in this instance this divergence has likely failed.
Some short term hidden bearish divergence is noted today between price and inverted VIX: price has made a lower high while inverted VIX today made a higher high. This indicates weakness in upwards movement from price today. It may be followed by one or two days of downwards movement.
BREADTH – AD LINE
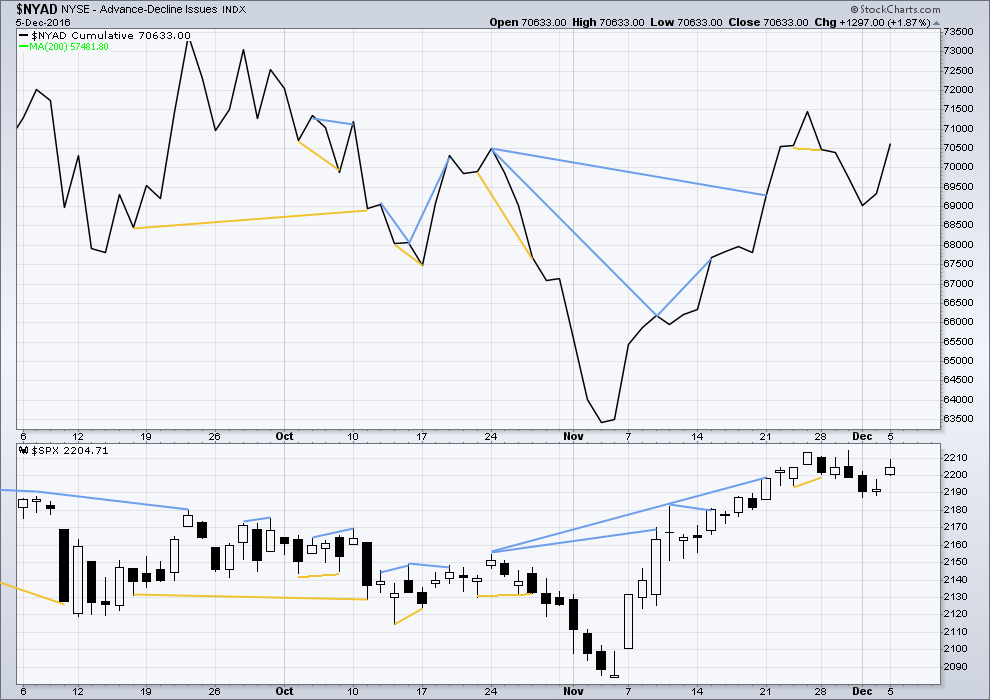
Click chart to enlarge. Chart courtesy of StockCharts.com.
Short term bullish and bearish divergence is again working between price and the AD line to show the direction for the following one or two days.
There is longer term divergence between price and the AD line, but like inverted VIX this has proven reasonably recently to be unreliable. It will be given no weight here.
There is no short term divergence noted here between price and the AD line.
DOW THEORY
Major lows within the old bull market:
DJIA: 15,855.12 (15th October, 2014) – closed below on 25th August, 2015.
DJT: 7,700.49 (12th October, 2014) – closed below on 24th August, 2015.
S&P500: 1,821.61 (15th October, 2014) – has not closed below this point yet.
Nasdaq: 4,117.84 (15th October, 2014) – has not closed below this point yet.
Major highs within the bear market from November 2014:
DJIA: 17,977.85 (4th November, 2015) – closed above on 18th April, 2016.
DJT: 8,358.20 (20th November, 2015) – closed above this point on the 9th of November, 2016.
S&P500: 2,116.48 (3rd November, 2015) – closed above this point on 8th June, 2016.
Nasdaq: 5,176.77 (2nd December, 2015) – closed above this point on 1st August, 2016.
Dow Theory Conclusion: The transportations indicate an end to the prior bear market. The transportation index confirms a bull market.
This analysis is published @ 10:01 p.m. EST.
Scottrade has a neat alert feature that shoots you an e-mail when pre-set conditions are triggered such as % price and volume changes. I like to use to spot any unusual price changes in charts I am watching and if that 2 Billion is correct it would be a much higher than average volume.
Maybe ask them about it as it’s not showing on other data feeds.
But to be fair, I’ve only been able to check two others.
If it’s correct then that would be strong support for the wave count and a buy here or about here
We have waves in the ocean this morning so I’m out now to catch some before the sea breeze comes along and ruffles it up 🙂
I’m loving the new banner pic that Cesar put up last night. It’s a photo he took of a flower in our back yard. I’m not sure what species it is. It’s probably a weed.
It sure is a beautiful weed! Nice photo too. Enjoy the waves, always.
There may now be a complete five up. A three down may find support about the lower blue trend line. Minute ii could move lower and fill the gap, if it’s a pattern gap. If it’s a breakaway gap it may not be filled.
TBH I’m not convinced I’ve got that triangle for minuette (iv) right. It does look a little forced.
If I’ve got that wrong then minuette (v) is not done.
Draw a channel about minute i. When it’s breached by downwards movement then minute ii has probably begun.
Well, this is not the Santa Claus rally I imagined when I mentioned it more than a month ago. But it looks like it will rally to the targets just under 2230 and take its time in doing so. Maybe we are setting up for another January like 2016’s.
I am curious about the explosive volume we saw in DJI and SPX. This was highly unusual, particularly with both indices closing well off the day’s highs. Distribution perhaps?
Either way something huge is going on below the surface.
? huh?
do you mean the daily volume for yesterday Verne? I’m not seeing it….
I was curious that you had not mentioned it Lara. Here is a chart of the volume profile from Scottrade. They show well over 2 billion shares traded. Did they screw up? I did not check other data feeds.
Oh wow, no I can’t see that on StockCharts data feed…
BarChart don’t provide any S&P data
And my broker CMC doesn’t either.
Have checked FXCM and they’re the same as StockCharts, a slight increase only
comment,,, the first