Upwards movement was expected for Wednesday’s session.
Although the candlestick closed red, it did make a higher high and a higher low from the prior day.
Summary: A small fourth wave correction may end tomorrow about 2,190. If price makes a new low below 2,182.30, then there will be an outside possibility of a large trend change. This is possible, but today has no confirmation at all.
Last monthly chart for the main wave count is here.
Last weekly chart is here.
New updates to this analysis are in bold.
MAIN WAVE COUNT
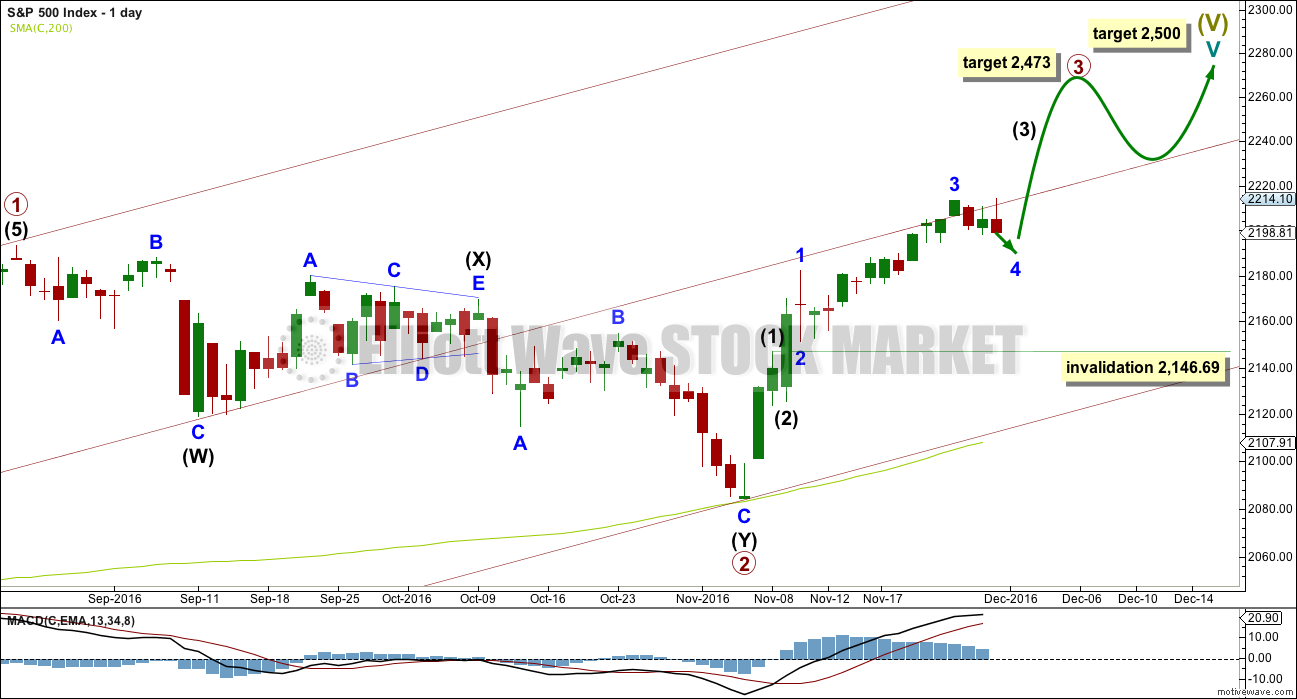
DAILY CHART
Cycle wave V must subdivide as a five wave structure. At 2,500 it would reach equality in length with cycle wave I. This is the most common Fibonacci ratio for a fifth wave for this market, so this target should have a reasonable probability.
Cycle wave V within Super Cycle wave (V) should exhibit internal weakness. At its end, it should exhibit strong multiple divergence at highs.
Within cycle wave V, primary waves 1 and 2 may be complete. Primary wave 3 may be over halfway through and is so far exhibiting weaker momentum than primary wave 1, which fits with the larger picture of expected weakness for this fifth wave at cycle degree. It is possible primary wave 3 may fall short of the target and not reach equality in length with primary wave 1.
Within primary wave 3, the upcoming correction for intermediate wave (4) should be relatively brief and shallow. Intermediate wave (1) was over very quickly within one day. Intermediate wave (4) may last a little longer, perhaps two or three days, and may not move into intermediate wave (1) price territory below 2,146.69.
At 2,473 primary wave 3 would reach equality in length with primary wave 1. This Fibonacci ratio is chosen for this target calculation because it fits with the higher target at 2,500.
When primary wave 3 is complete, then the following correction for primary wave 4 may last about one to three months and should be a very shallow correction remaining above primary wave 1 price territory.
The maroon channel is redrawn as a base channel about primary waves 1 and 2. Draw the first trend line from the start of primary wave 1 at the low of 1,810.10 on the 11th of February, 2016, then place a parallel copy on the high of primary wave 1. Add a mid line, which has shown about where price has been finding support and resistance.
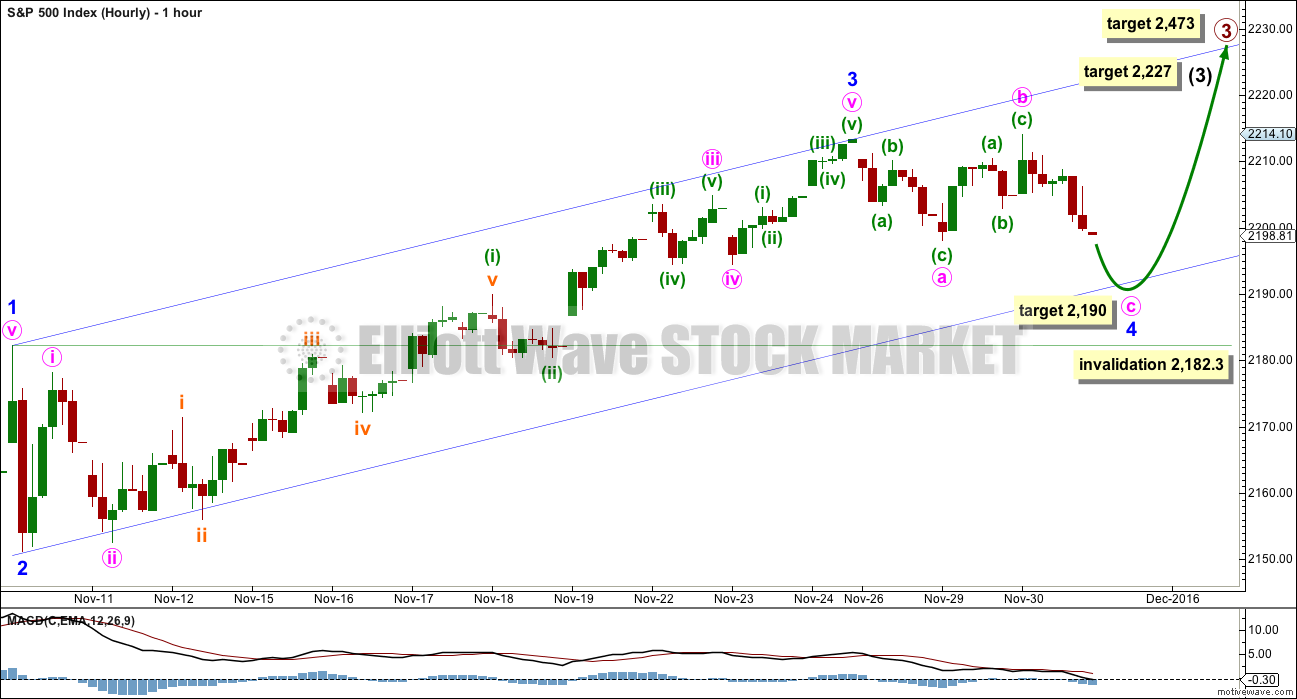
HOURLY CHART
At 2,227 intermediate wave (3) would reach 1.618 the length of intermediate wave (1).
This wave count sees the middle of a third wave particularly weak; this is not common. The larger context of a fifth wave at cycle and Super Cycle degrees may see persistent unusual weakness though, so this wave count is possible.
If minor wave 4 is unfolding as a flat correction, then within it minute wave b must retrace a minimum 0.9 length of minute wave a at 2,211.83. The normal range for minute wave b within a flat correction for minor wave 4 would be from 1 to 1.38 the length of minute wave a, giving a range from 2,213.35 to 2,219.13. Minute wave b is now complete and 1.05 the length of minute wave a. If minor wave 4 is a flat correction, then it would be an expanded flat. The most common ratio for minute wave c would be 1.618 the length of minute wave a at 2,190.
If minor wave 4 is unfolding as a combination, then it would be relabelled minute waves w-x-y. Minute wave x of a combination would now be complete. Minute wave y may unfold as either a flat or triangle.
If minor wave 4 is unfolding as a triangle, then there is no minimum nor maximum limit for minute wave b within it. With minute wave b now making a slight new high above the start of minute wave a, this may be a running contracting triangle. Minute wave c of a triangle may not move beyond the end of minute wave a below 2,198.15. A triangle would be invalid below this point.
At this stage, a triangle looks extremely unlikely though it is technically possible. The trend lines of a contracting triangle should converge. Here, the lower a-c trend line would be almost flat and that would look wrong.
Minor wave 4 may not move into minor wave 1 price territory below 2,182.30.
The channel is redrawn now using Elliott’s technique. Draw the first trend line from the ends of minor waves 1 to 3, then place a parallel copy on the end of minor wave 2. The lower edge of this channel may provide support if minor wave 4 moves lower.
It is likely that minor wave 4 will end within the price territory of the fourth wave of one lesser degree. Minute wave iv has its range from 2,204.80 to 2,194.51. The target would see it end below this range but not by too much.
The S&P often forms slow rounded tops. When it does this the many subdivisions make analysis difficult. Only when support is breached by movement that is clearly downwards and not sideways would it be an indication of a deeper pullback.
ALTERNATE WAVE COUNT
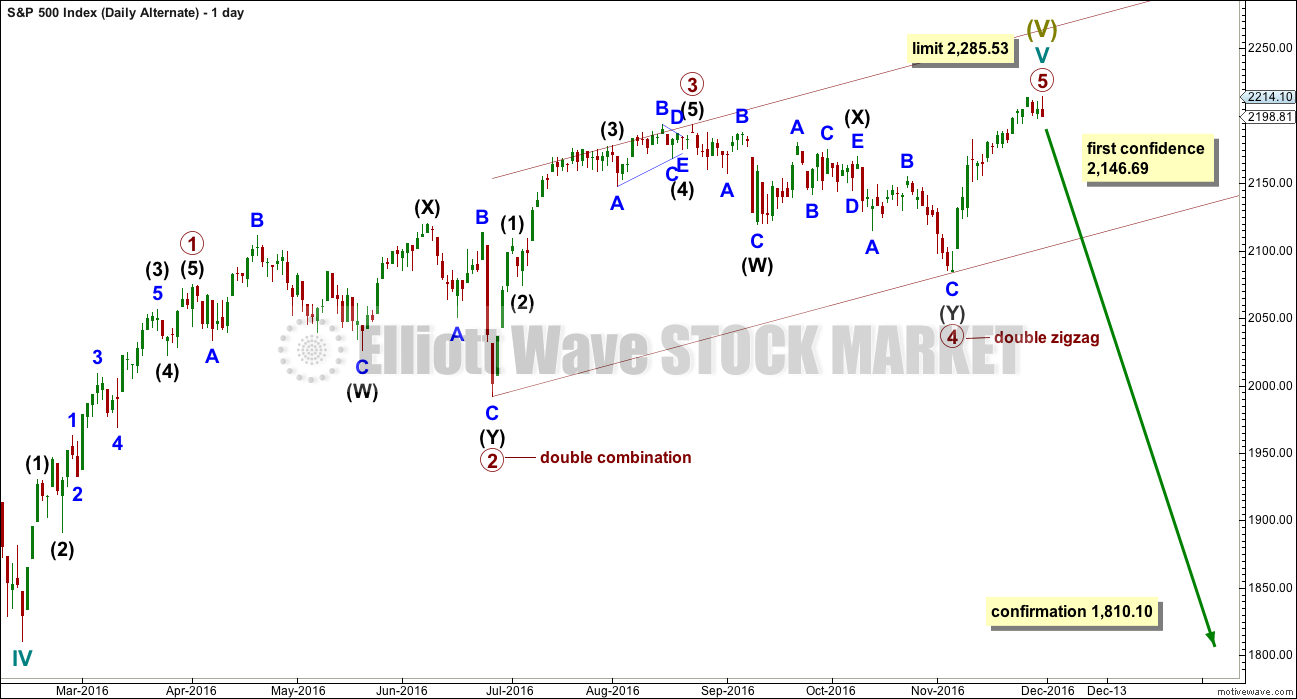
DAILY CHART
There is a wave count that fits for the Dow Industrials that sees an imminent trend change. It relies upon an ending diagonal, but that idea will not fit well for the S&P.
What if an impulse upwards is now complete? The large corrections labelled primary waves 2 and 4 do look like they should be labelled at the same degree as each other, so that gives this wave count the right look.
Primary wave 4 ends within primary wave 2 price territory, but it does not overlap primary wave 1. Primary wave 1 has its high at 2,057 and primary wave 4 has its low at 2,083.79. The rule is met.
There is alternation between the double combination of primary wave 2 and the double zigzag of primary wave 4. Even though both are labelled as multiples W-X-Y, these are different structures belonging to different groups of corrective structures.
Primary wave 3 is shorter than primary wave 1. This limits primary wave 5 to no longer than equality with primary wave 3 at 2,285.53.
The equivalent wave count for DJIA expects an end now to upwards movement and the start of a large bear market. Only for that reason will this alternate for the S&P also expect a reversal here.
This wave count has good proportions. Primary wave 1 lasted a Fibonacci 34 days, primary wave 2 lasted 60 days, primary wave 3 lasted 40 days, and primary wave 4 lasted 52 days. Primary wave 5 may be more brief than primary wave 3. If it exhibits a Fibonacci duration, it may total a Fibonacci 34 days and that would see it end on the 22nd of December. If it is only a Fibonacci 21 days in duration, it may end more quickly on the 2nd of December.
DOW JONES INDUSTRIALS
DAILY CHART
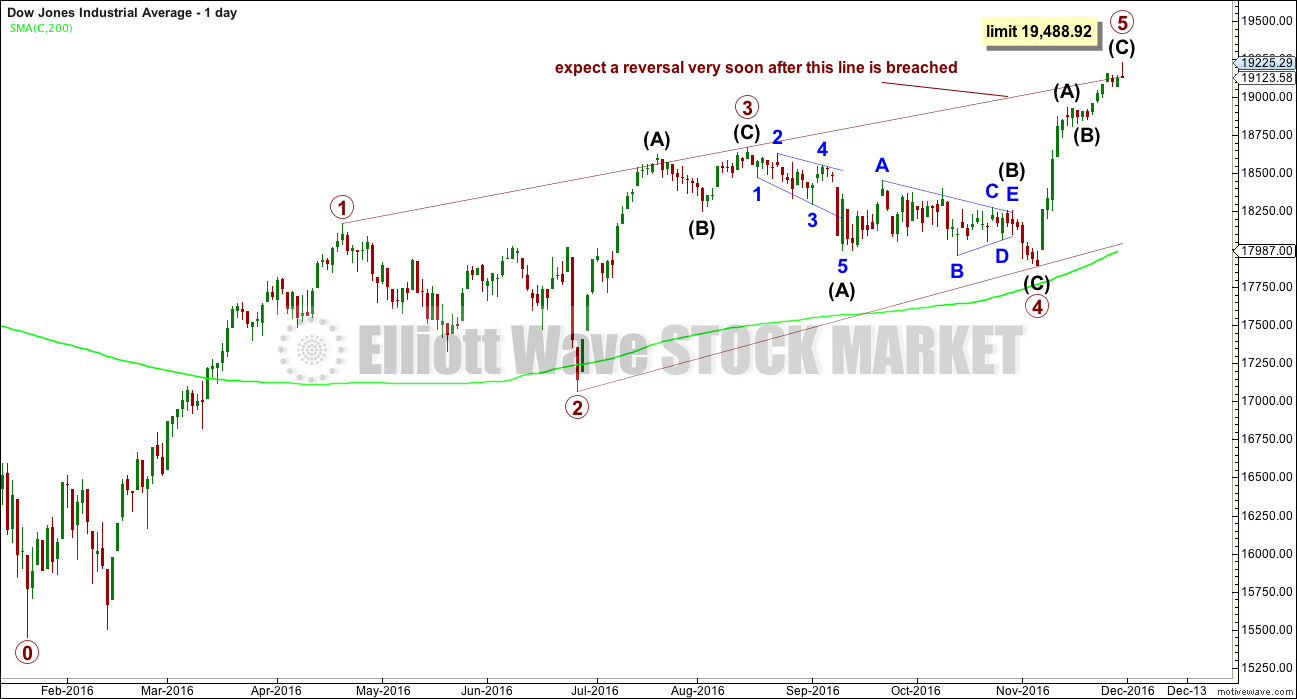
An ending contracting diagonal may be complete for the DJIA. This fits into the same picture as the alternate wave count for the S&P; both see a final fifth wave coming to an end very soon.
The 1-3 trend line is now overshot. Contracting diagonals normally end very quickly after this line is overshot, and it can be surprising how small the overshoot is. This wave count expects a very strong reversal.
Price more strongly today overshot the 1-3 trend line and quickly reversed. Both the S&P and DJIA today exhibit a volume spike. On Balance Volume indicates more downwards volume than upwards today, so there is strong support for downwards movement towards the end of the session for these markets. This now looks like the diagonal may be correct and may have ended today. What happens in the next few days will be indicative.
If this idea is correct, then the market may start to fall very hard indeed here. This is an outside possibility, but the possibility does illustrate a strong warning for any members holding long positions. It is essential that stops are used.
The diagonal is contracting, so the final fifth wave is limited to no longer than equality in length with primary wave 3 at 19,488.92.
TECHNICAL ANALYSIS
WEEKLY CHART
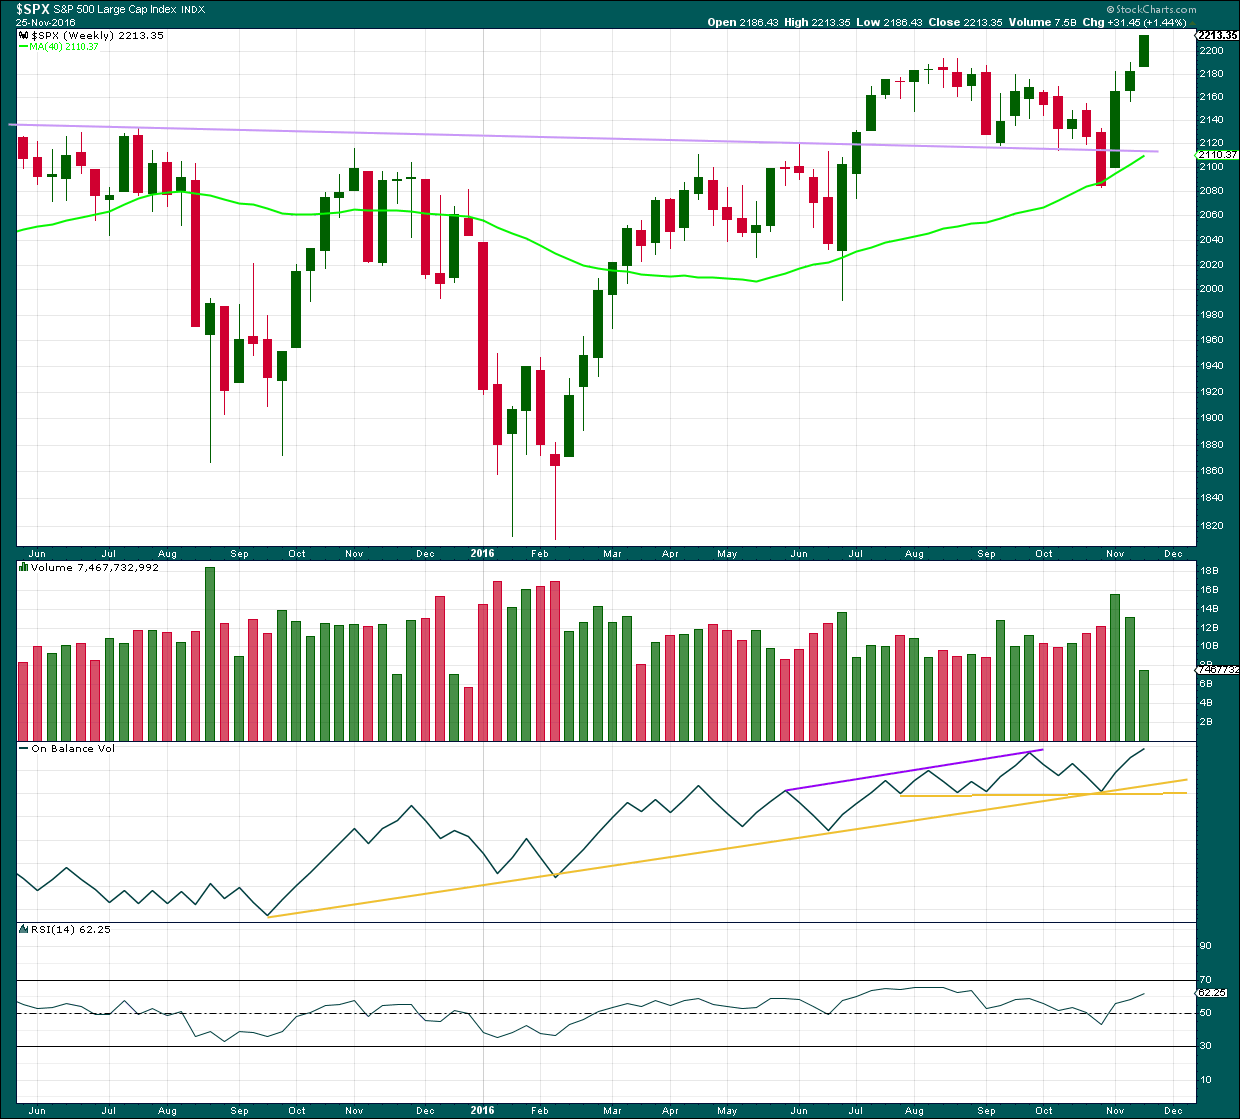
Click chart to enlarge. Chart courtesy of StockCharts.com.
Another upwards week comes with an increase in range but a strong decline in volume. This is partly due to the Thanksgiving Day holiday making this week short of one day, so not too much will be read into it.
On Balance Volume is bullish.
There is some mid term divergence between price and RSI: price is making new all time highs, but RSI is not following. This indicates weakness in price. It is not a signal of a trend change, only indication of weakness.
DAILY CHART
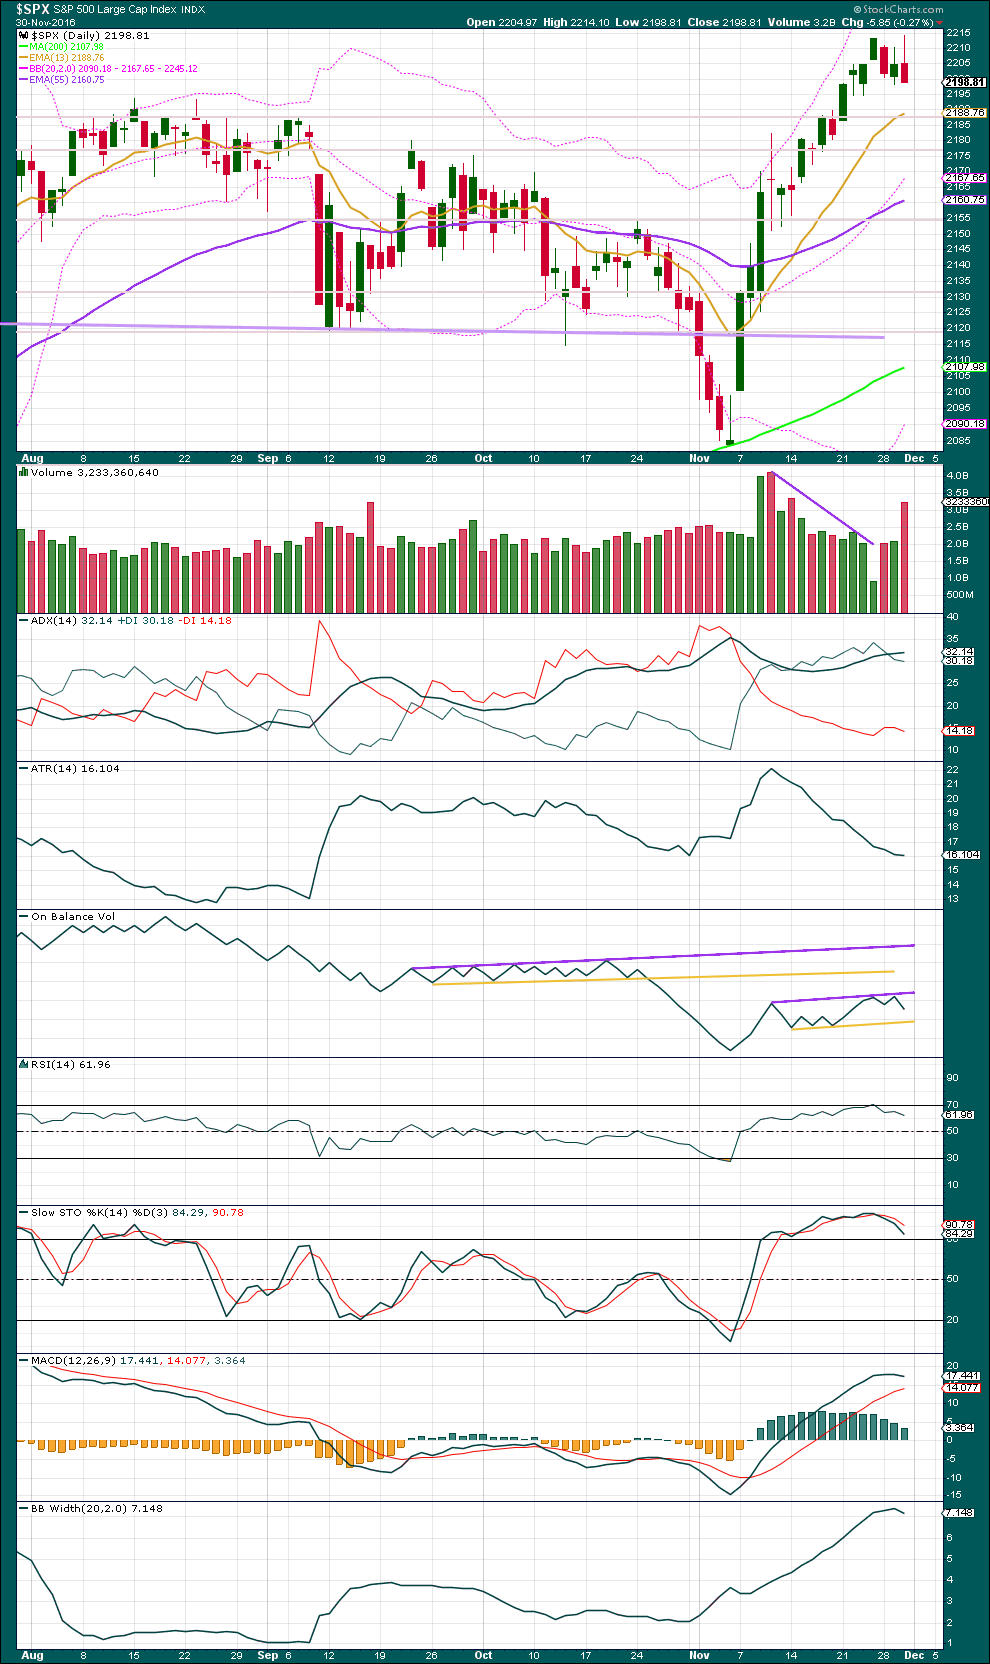
Click chart to enlarge. Chart courtesy of StockCharts.com.
Wednesday’s session has a higher high and a higher low than the day before, but closed red. Bulls began the session to make a new high, but the bears seized control and held it through the end of the session. On Balance Volume points lower; the balance of volume today was downwards. With a volume spike for the session, this downwards movement is relatively strong.
ADX is still increasing, indicating an upwards trend is in place, but it is coming closer to extreme at 35.
ATR has been declining while price has been trending higher. There is something wrong with this trend. While bulls are able to push price higher, the range they are able to manage is getting smaller and smaller. They are getting weaker and weaker.
Bollinger Bands are only just now beginning to contract after a long period of expansion while price trended higher. Some consolidation and low volatility should be expected about here.
MACD may be beginning to turn around after increasing.
RSI now exhibits divergence with price at today’s high. After being slightly overbought, this divergence indicates a trend change here to either a consolidation or a new downwards trend.
The picture today looks neutral to bearish.
VOLATILITY – INVERTED VIX CHART
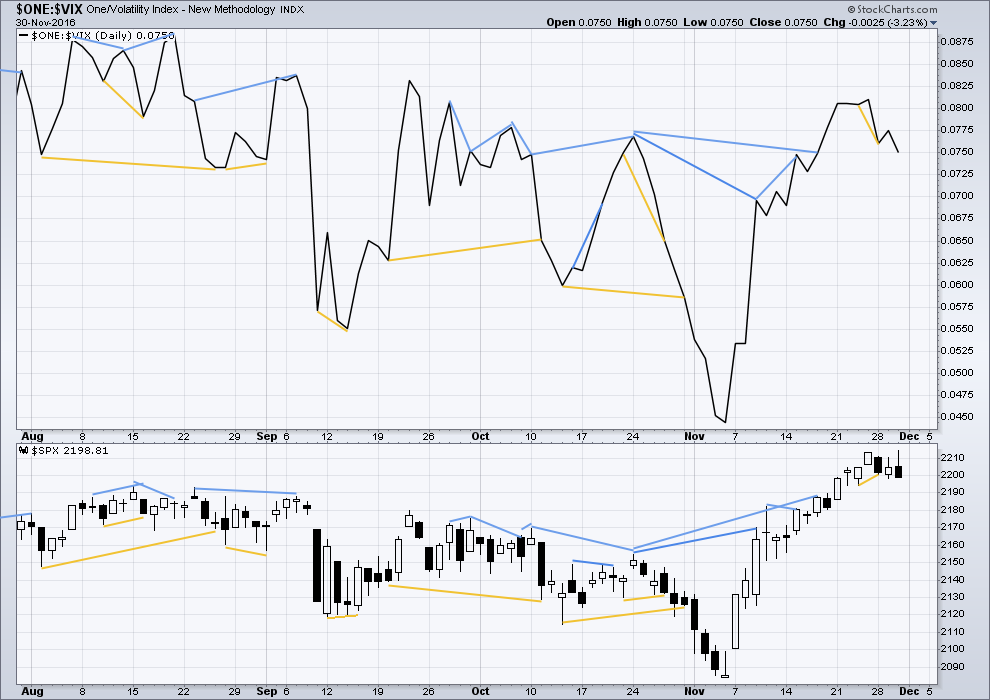
Click chart to enlarge. Chart courtesy of StockCharts.com.
There are a few instances of multi day divergence between price and inverted VIX noted here. Bearish divergence is blue. Bullish divergence is yellow. It appears so far that divergence between inverted VIX and price is again working to indicate short term movements spanning one or two days. While this seems to be working more often than not, it is not always working. As with everything in technical analysis, there is nothing that is certain. This is an exercise in probability.
Yesterday’s bullish divergence was followed by a new all time high, so this may now be resolved.
BREADTH – AD LINE
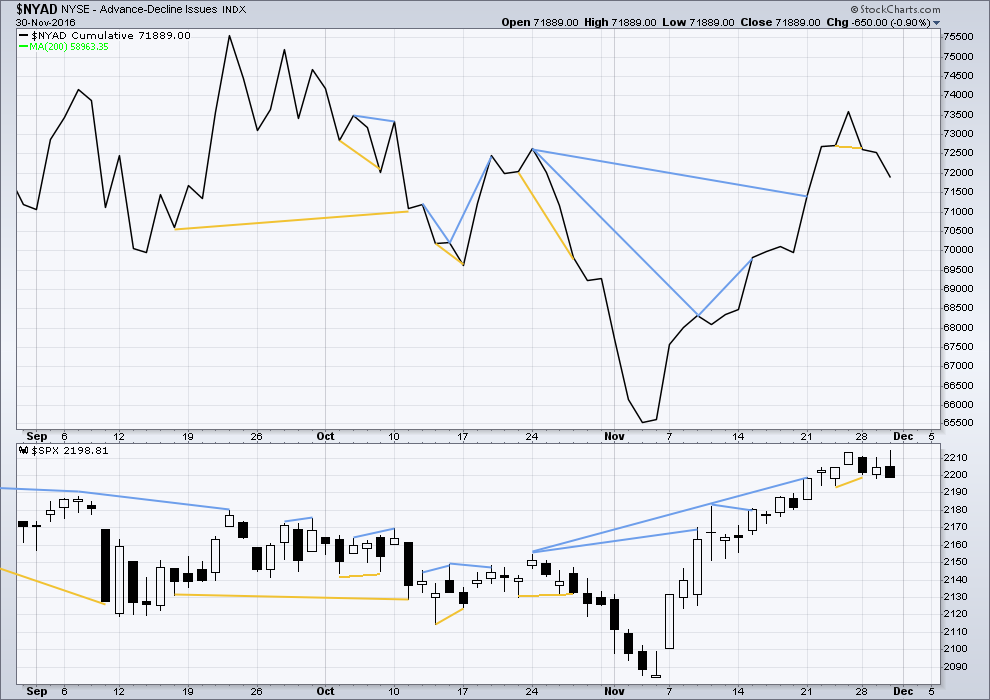
Click chart to enlarge. Chart courtesy of StockCharts.com.
Short term bullish and bearish divergence is again working between price and the AD line to show the direction for the following one or two days.
There is longer term divergence between price and the AD line, but like inverted VIX this has proven reasonably recently to be unreliable. It will be given no weight here.
Short term bullish divergence has been followed by a new all time high from price. This divergence may now be resolved.
Price today moved overall higher with a higher high and a higher low, but the AD line sharply declined. Today, while price moved higher, there was a decline in market breadth. This single day divergence is bearish.
UVXY
Click chart to enlarge. Chart courtesy of StockCharts.com.
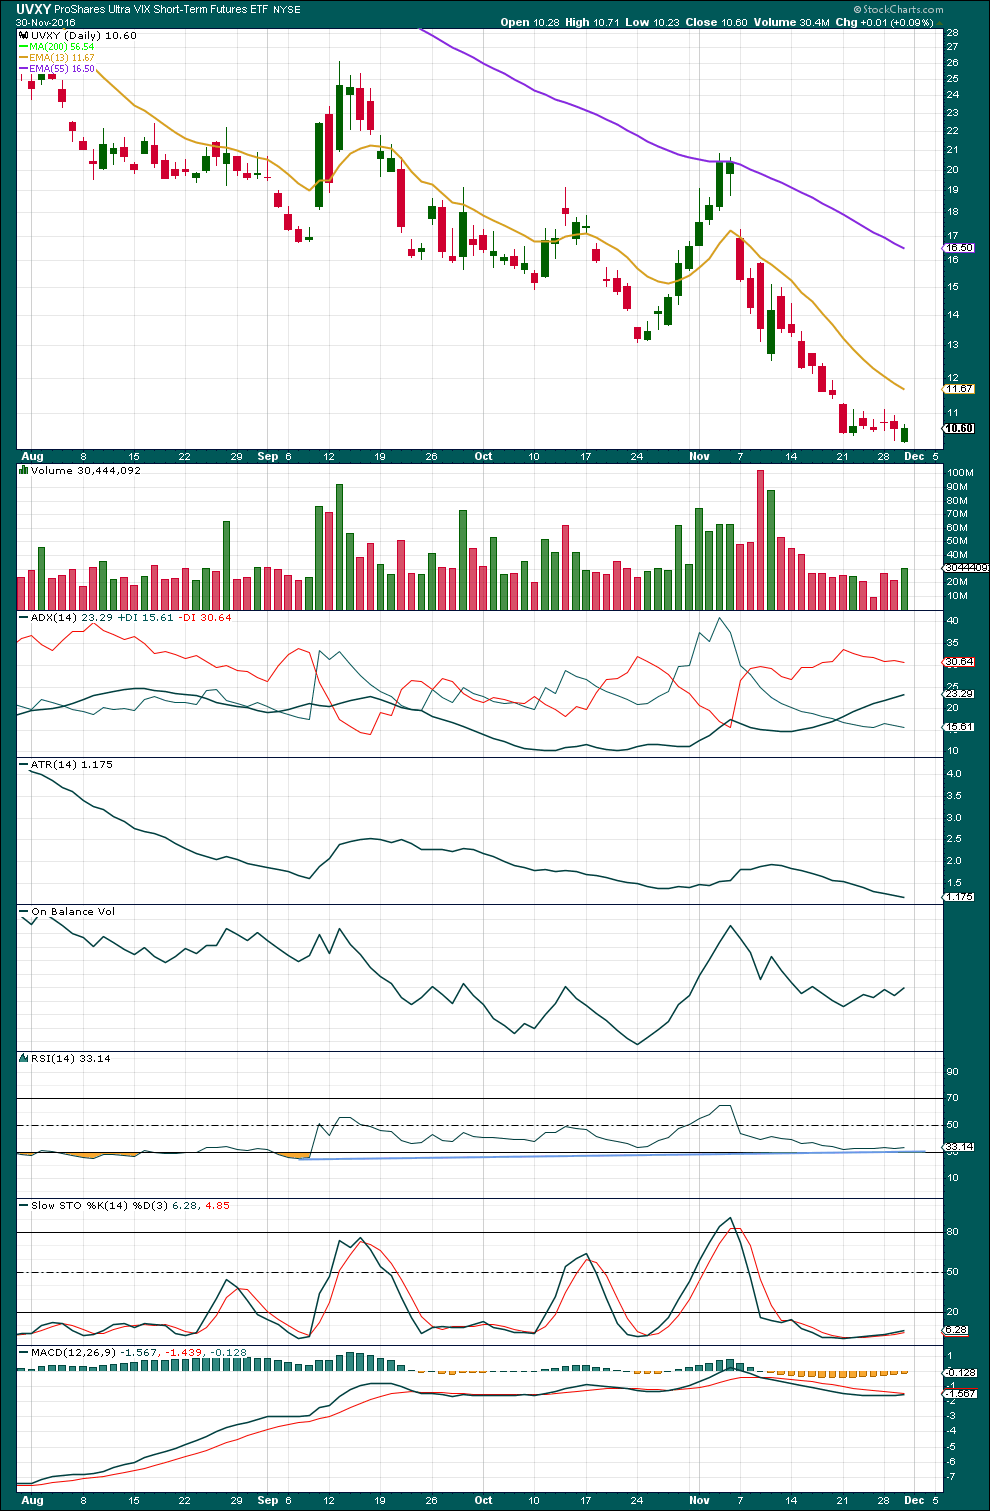
The Unicorn has been making new 52 week lows.
UVXY made a slight new low then reversed and now shows some strength from volume. On Balance Volume indicates the balance of volume today was upwards.
It looks like at least a short term low may be in place now for UVXY.
There is double divergence at lows between price and RSI, with RSI moving from oversold back in September.
I will make no comment on ATR behaviour for this market as I do not know it well enough. I will only say that generally after a period of declining ATR, as UVXY has here, some increase should be expected.
If this market is turning, then the very bearish wave count for the S&P is just possible. Even if this is not considered to support the bearish wave count for the S&P, some upwards movement is a reasonable expectation here for UVXY.
DOW THEORY
Major lows within the old bull market:
DJIA: 15,855.12 (15th October, 2014) – closed below on 25th August, 2015.
DJT: 7,700.49 (12th October, 2014) – closed below on 24th August, 2015.
S&P500: 1,821.61 (15th October, 2014) – has not closed below this point yet.
Nasdaq: 4,117.84 (15th October, 2014) – has not closed below this point yet.
Major highs within the bear market from November 2014:
DJIA: 17,977.85 (4th November, 2015) – closed above on 18th April, 2016.
DJT: 8,358.20 (20th November, 2015) – closed above this point on the 9th of November, 2016.
S&P500: 2,116.48 (3rd November, 2015) – closed above this point on 8th June, 2016.
Nasdaq: 5,176.77 (2nd December, 2015) – closed above this point on 1st August, 2016.
Dow Theory Conclusion: The transportations indicate an end to the prior bear market. The transportation index confirms a bull market.
This analysis is published @ 11:56 p.m. EST.

Lara,
You have been perfect in forecasting this 4th wave. I am not about to go long here, however. My overriding reason is because of the SPX chart pattern on the daily. There is a potential H&S developing. If this pattern continues to develop, the current drop could take us below 2100. Far to much risk for me especially relative to the potential gain in the completion of the next fifth wave. I am continuing to SOH.
Volatility also raising a cautionary flag. When VIX is rising along with any of the major indices it is time to be careful. VIX is starting to move off a basing pattern and it does not look to me like it is done heading North. I also would not want to be long this market over the week-end ahead of the vote in Italy. The market continues to be severely stretched to the upside imo.
The alternate very bearish scenario does remain technically viable.
Lowry’s don’t support that view though, they expect some more months of this bull market.
The green daily candlestick on DJIA may negate the gravestone doji, but todays candlestick did not make a new high so maybe it doesn’t…..
Still, if DJIA is reversing it should not muck around. It’s mucking around.
The mucking looks to me like fast and furious bankster pumping to try and forestall what may be ultimately inevitalble. While the selling in DJI has not been intense it does look like the relentless infusions to try and keep the market aloft is being matched at least by equally relentless redemptions resulting in what is effectively a current stalemate.
To date the banksters are winning.
The only question remains, for how long can they keep it up? Literally. LOL
It is amazing. The mispricing of risk in the market is historic. What is interesting is now even VIX is starting to ignore the fact that we are trading at all time highs. Caveat Emptor! 🙂
Not sure how many heard that speech from Trump at Carrier plant. Without getting into any politics, all I can say is that this was a very anti business speech. Highly threatening. On a brighter note, bears who have been waiting for years, may finally get that correction next year- courtesy of trade wars that will start 2017-2018. Safe to say Nasdaq (tech will be first to fall and dow the last). But patience needed for bears. Won’t happen overnight.
I do my best to avoid all politicians speeches at all times. Of all hues.
In this way I maintain my sanity and equilibrium.
I recommend it 🙂
Great advice! Every time I see a politician getting ready to blather I run in the opposite direction as fast as my legs can carry me with fingers stuck firmly in both ears! 🙂
Updated hourly chart:
If this wave count is right then that should be all she wrote for minor 4.
The S&P should turn up from here. Minor 4 is now a completed expanded flat, a very common structure, giving perfect alternation with the zigzag of minor 2.
The channel is slightly overshot, the last hourly candlestick so far is green with a long lower wick. That’s a bit bullish. Only a bit, because this is only an hourly candlestick.
I’ve drawn a small channel about minute c. Expanded flats don’t fit into channels, so I use a channel about their C waves. When price breaks above this then the probability that minor 4 is over will increase… slightly. Only slightly because this channel is so narrow, steep and short held. So it doesn’t have good technical significance.
Any entries here to go long may set stops just below the invalidation point (best practice here) or just below the low I’ve labelled minor 4 at 2,189.08.
Risk: minor 4 could continue further. Positions may be underwater for a few days.
OR
my wave count is wrong and you’ll suffer a loss. That is certainly possible.
Mitigate risk. Always use a stop. Always. I just can’t stress that enough. I know sometimes members ignore this advice because they come on here and complain about losing positions. Don’t do that, it won’t get you any sympathy. Trading without stops exposes all the equity in your account to loss. If you do that you will one day wipe out your account, of that I can be 100% certain.
Do not invest more than 3-5% of equity on any one trade. Maybe even less. I’m down to 2% currently after a series of small losses, one of my rules.
Stick to those two rules.
Just so it’s clear:
Lara’s Two Golden Rules
1. Always use stops
2. Invest no more than 3-5% of equity on any one trade
The Nasdaq is down a whopping 80 points. Might this be leading the Dow and Spx down. Hugge number of new highs and lows point to indecision. What is that Hindenburg omen again,,,,gotta look that up
This is what it is (from Kirkpatrick and Dhalquist, “Technical Analysis”)
– the 52 week highs and lows are each greater than 2.2% of total issues
– the small number of new highs or new lows is greater than 75
– the ten week moving average of the NYSE Composite is rising
– new highs cannot be more than two times the number of new lows (okay for new lows to be two times the number of highs)
– confirmation, defined as two or more occurrences within a 36 day period, exists
The odds of a crash are about 27% after a confirmed signal.
I’ve just noticed this on FTSE. A Head and Shoulders pattern forming, sitting now on the neckline.
IF price breaks below the neckline then there will be a very high probability of a continuation of a downward trend to a target about 441 points below the breakout. That should be about 6,250.
This is only a strategy IF price can break below the neckline. Not before.
I closed a few doubles in QQQ puts and UVXY calls on this last move down but I wonder if it’s quite done. VIX is printing a full fat candle and a reversal should sport an upper wick. We also are facing a huge global political and market risk in Italy’s vote this week-end. I would not be surprised to see DJI surrender its bravado and print a red one by the close. If we close near VIX highs today I will re-load short term VIX calls….
Although there’s a long upper wick on the green VIX candlestick today it also has a relatively long lower wick….. so some balance there.
It sure looks today like UVXY has reversed.
There are some very strange things afoot. After making a new 52 week high today, trading was halted on CAT stock after some news came out about overly optimistic 2017 earnings expectations. This is totally nuts and a good example of how you cannot trust anything you are seeing in equities prices these days. Just think about it! – From a new 52 to week high to a suspension of trading to because of a sudden limit down. This really and truly stinks to high heaven!!!!!
I am not buying that announcement BS. It is just a cover for the fact that someone used these new highs to dump a crap load of CAT stock on an unsuspecting market,
Insiders bailing? Not a sign of health that one.
I recently opined that I was looking askance at all the hugs and smiles that were coming out of OPEC as a result of the announced production agreements. My skepticism had to do with the intensity of old hostilities between two of the major players, Saudi Arabia and Iran and I said that even if it was in their best interests, these two hated each other so much that this would undermine any attempt at arriving at and actually keeping any kind of arrangement. Surprise! Surprise!
It now turns out that while they were supposedly negotiating with the Saudis over this oil deal, Iran was preparing a devastating cyber attack on their military command and control systems which they have unleashed in the last 48 hours. Does that sound like a whole lotta love to you? 🙂
Today’s candlestick on the DJIA is a gravestone doji (BarChart data – on StockCharts it looks more like a shooting star because the body is a little bigger).
From Nison: “The gravestone’s forte is in calling tops. The shape of the gravestone doji makes its name appropriate…. the gravestone doji represents the gravestone of the bulls that have did defending their territory”.
You’ve really got to hand it to the bulls. The last doji in DJI on November 14 was printed after several days trading above its upper BB. Here we are two weeks later and the bulls are still running. This kind of price action is a rare departure from a typically predictable reversion to the mean trade and DJI is not alone in displaying this kind of anomaly so far as ususally reliable trade signals are concerned. We saw something similar with TBT. I can understand the frustration of some traders who are concluding that TA is no longer working in this market. I think it would be helpful to remember that we are seeing a topping process not seen previously in all of market history and so should not be surprised by marker behaviour that is unprecedented.
I am of the opinion that the kind of extremes we are seeing in markets may be telling us something about the nature of the top that is forming. Let’s see if the gravestone doji lives up to its reputation, or ends up being another formerly reliable signal that falls to the remarkable distortive power of a GSC topping process. I have widened my stops on short positions to allow for that possibility.
There are two things I am looking for in the next few days to get some notion of the nature of the upcoming correction.
The first is how price action behaves around the round numbers. If the bull is still alive and well DJI 19,000.00 will probably not be surrendered and a bounce there means I am out of all my short positions. I would consider that to be very bullish indeed.
The second thing is what happens in UVXY. Its nominal value should quickly catch up to and surpass that of VIX if a more lasting top is in and this should happen in a couple, or three at the most, trading sessions. The start of a serious decline should see several days of strong candles with higher highs and higher lows. Hochberg at EWI points out that this week has a positive seasonal bias so that makes what happens doubly interesting and insightful. European marks already heading South.
From Bulkowski’s site:
——————————————————-
Gravestone Doji Important Results
Theoretical performance: Indecision to bearish reversal (during up trends)
Tested performance: Bearish reversal 51% of the time
Frequency rank: 42
Overall performance rank: 77
Best percentage meeting price target: 79% (bear market, up breakout)
Best average move in 10 days: 5.09% (bear market, up breakout)
Best 10-day performance rank: 27 (bear market, up breakout)
All ranks are out of 103 candlestick patterns with the top performer ranking 1. “Best” means the highest rated of the four combinations of bull/bear market, up/down breakouts.
The above numbers are based on hundreds of perfect trades. See the glossary for definitions.
—————————————
Gravestone Doji Discussion
The actual, tested, behavior of the gravestone doji matches the theoretical performance: indecision or randomness, packaged into a tight little bundle of joy. Price closes at the bottom of the candlestick and price should breakout downward most often, which it does.
The gravestone doji is rare in a bear market, which I find odd. That can be due to the dearth of bear markets, but the ratio of bullish to bearish sightings is about 15 to 1.
Once price breaks out, the performance is lousy, ranking 77 — near the bottom of the list. That means price does not trend far after a breakout. However, after an upward breakout in a bear market, price moves higher by 5.09% in 10 days, which is quite good. When you consider that price closed at the bottom of this candlestick, the climb is even higher (because I measure from a close above the top of the candlestick as the breakout, and do not start counting from the bottom of the doji). Using the height of the candle projected in the direction of the breakout shows that the trend meets the predicted target 79% of the time, which I consider acceptable.
———————————————————–
Link to information: http://www.thepatternsite.com/Gravestone.html
Thanks Rodney. A great reminder that we are always dealing with probabilities when it comes to trading signals.
Well, it seems to have not worked this time. DJIA is printing a green daily candlestick. The signal from the doji is negated.
So far…! 🙂