Upwards movement continued past the target, which was at 2,199.
Summary: A target for upwards movement to end is now at 2,206. The limit is at 2,213.03. A pullback is still expected to begin soon and to find support about 2,120 and the lilac trend line for a test of support.
Last monthly chart for the main wave count is here.
Last weekly chart is here.
New updates to this analysis are in bold.
MAIN WAVE COUNT
DAILY CHART
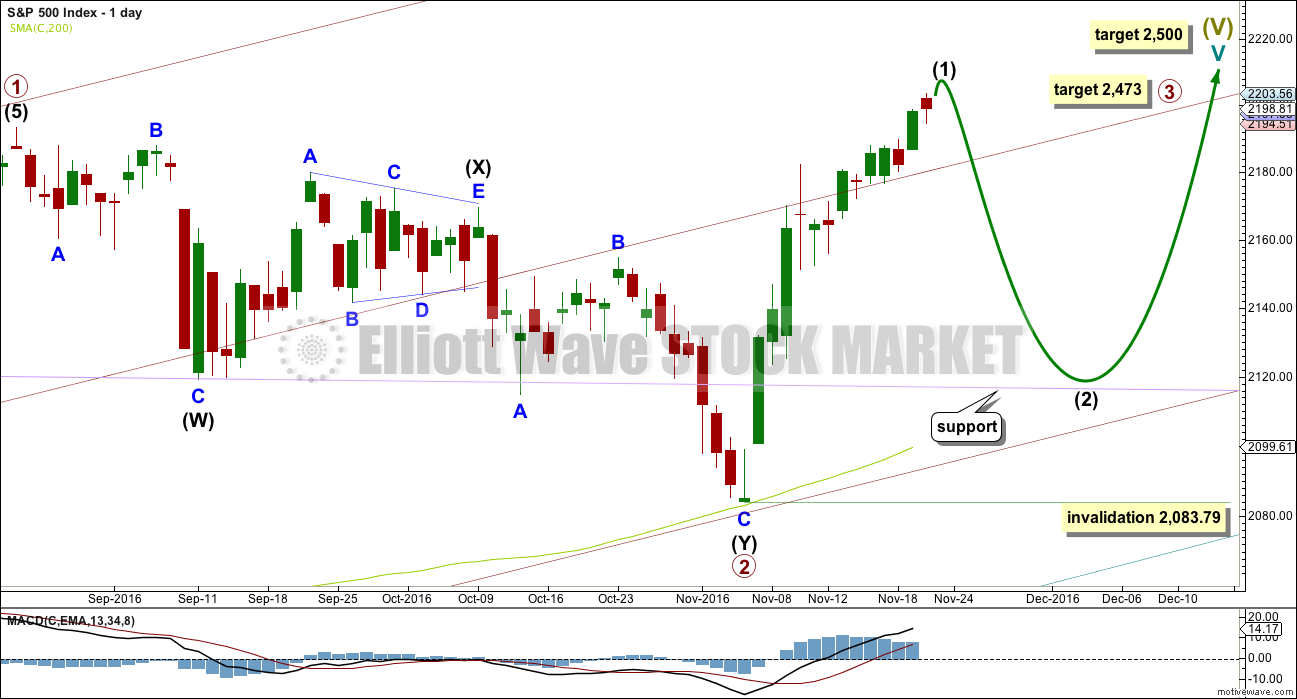
Primary wave 2 now looks to be complete as a double zigzag. Within primary wave 2: intermediate wave (W) was a very shallow zigzag lasting a Fibonacci 13 sessions; intermediate wave (X) fits perfectly as a triangle lasting 20 sessions, just one short of a Fibonacci 21; and intermediate wave (Y) also lasting 20 sessions deepens the correction achieving the purpose of a second zigzag in a double.
Primary wave 2 looks like it has ended at support about the lower edge of the maroon channel about primary wave 1, and at the 200 day moving average.
With upwards movement slicing cleanly through the lilac trend line, this behaviour looks to be more typical of an upwards trend. At this stage, corrections within primary wave 3 may be expected to turn down to test support at this trend line.
At 2,500 cycle wave V would reach equality in length with cycle wave I.
At 2,467 primary wave 3 would reach equality in length with primary wave 1. This is the ratio used in this instance because it fits with the higher target at 2,500.
Intermediate wave (2) may not move beyond the start of intermediate wave (1) below 2,083.79.
Primary wave 3 may show some strength compared to primary wave 1, but it does not have to. This wave count sees price in a final fifth wave at cycle degree, within a larger fifth wave at Super Cycle degree. The upcoming trend change may be at Grand Super Cycle degree, a once in generations trend change. This final fifth wave should be expected to exhibit great internal weakness; this market may appear broken. That would be typical behaviour for a final fifth wave of this magnitude.
HOURLY CHART
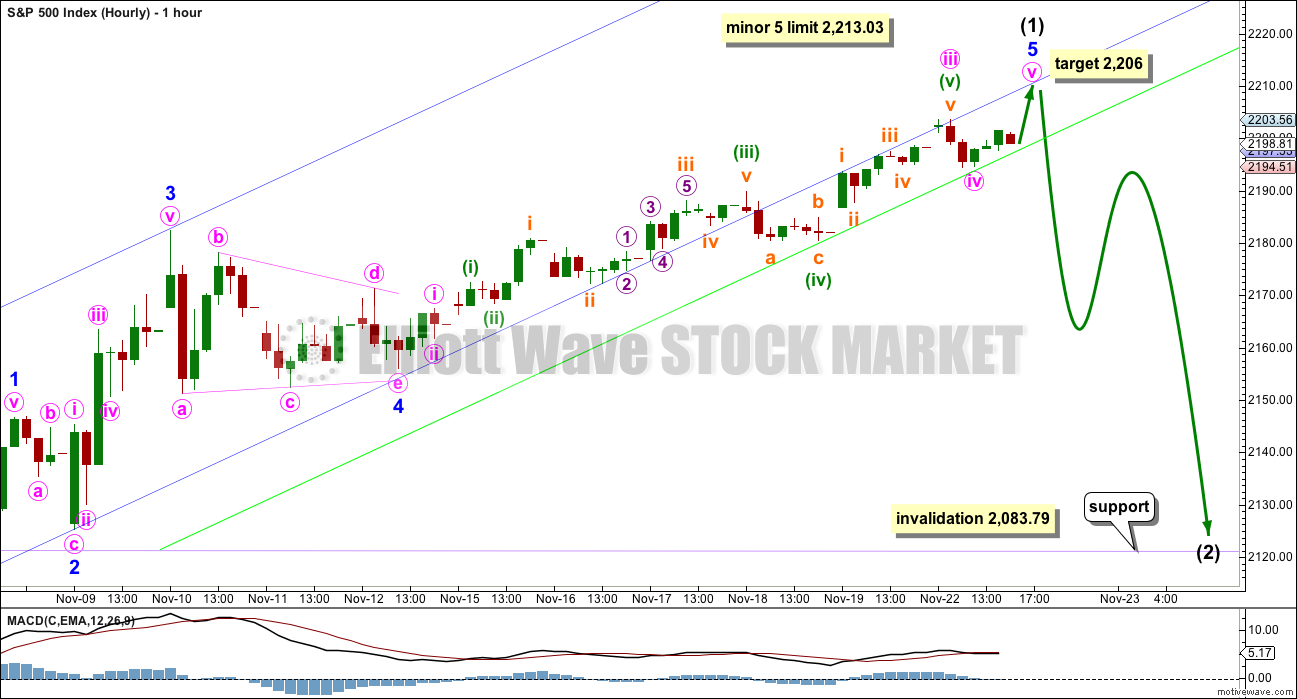
There is no Fibonacci ratio between minor waves 1 and 3. Minor wave 3 is slightly shorter than minor wave 1. Because a core Elliott wave rule states a third wave may not be the shortest, this limits minor wave 5 to no longer than equality in length with minor wave 3 at 2,213.03.
At 2,206 minute wave v would reach equality in length with minute wave i.
Minor wave 2 is a shallow 0.34 zigzag and minor wave 4 is a shallow 0.46 regular contracting triangle. This gives perfect alternation in structure and some alternation in depth.
Minor wave 5 is showing weakness. MACD has failed to make a new high while price has moved upwards. This wave lacks momentum.
Downwards movement broke below the lower edge of the best fit channel. The S&P can breach channels yet continue in the old direction, and that is what has happened. The channel breach may only be read as a warning of weakness.
A parallel copy of the lower edge of this channel is drawn today in green. This shows where price is finding resistance at the lower edge of the blue channel and support at the green line. A breach of the green line with downwards movement would be a small indicator of a potential trend change. While price remains above this trend line expect price to continue to find support there and bounce up.
Intermediate wave (2) may be expected to last about a Fibonacci 5, 8 or 13 days. It is most likely to be a single or double zigzag structure. It is most likely to correct to close to the 0.618 Fibonacci ratio of intermediate wave (1), which should be close to support about 2,120 and the lilac trend line.
TECHNICAL ANALYSIS
WEEKLY CHART
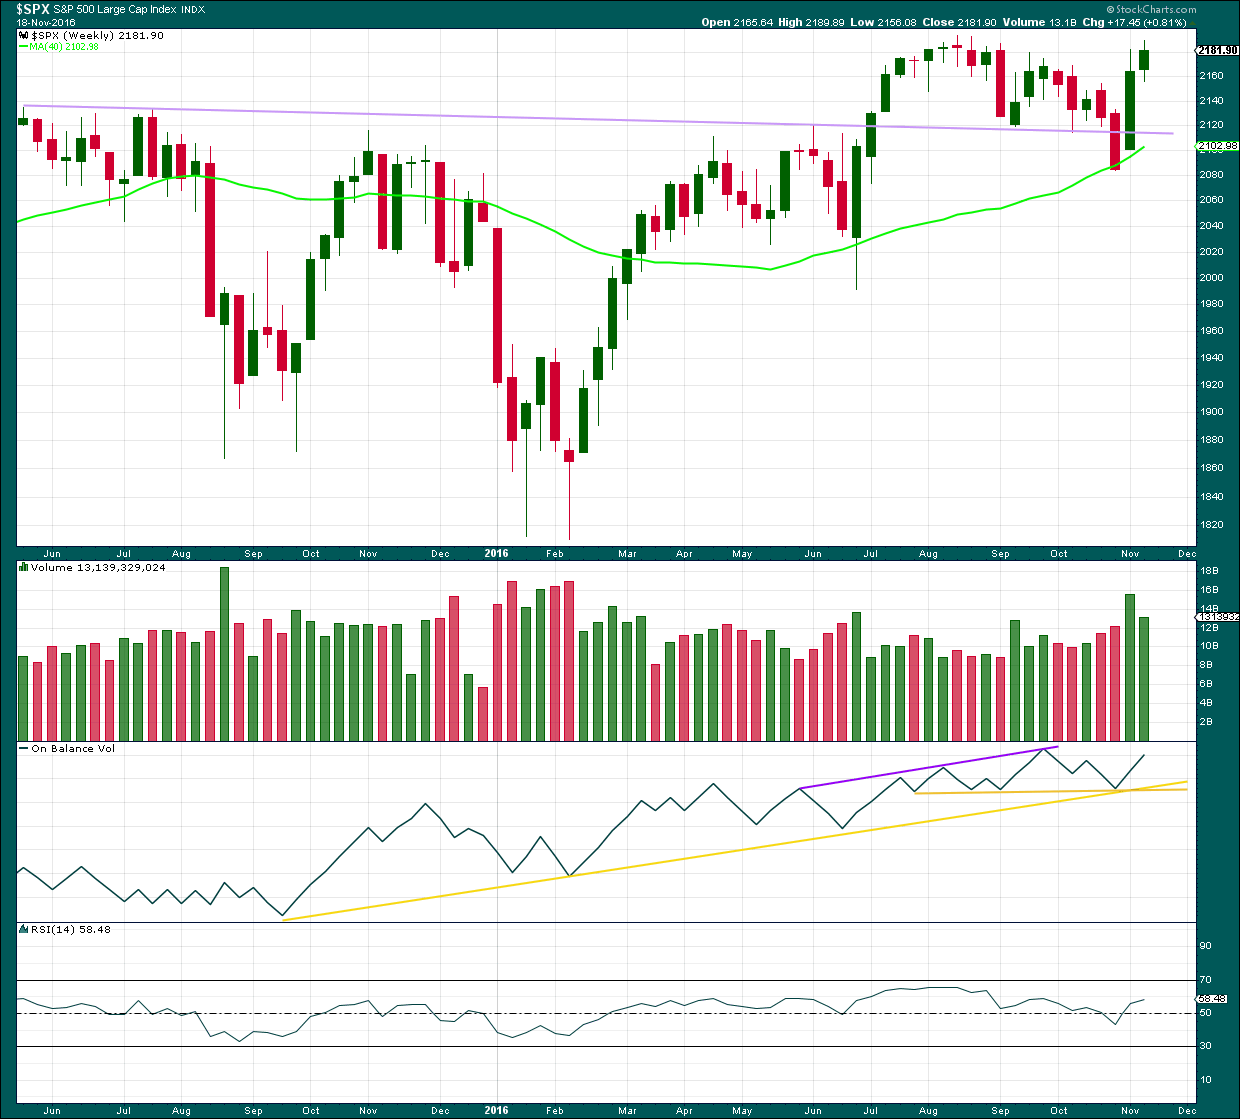
Click chart to enlarge. Chart courtesy of StockCharts.com.
A smaller range upwards week on lighter volume looks like bulls are tiring. Some downwards or sideways movement this week is a reasonable expectation.
There is no close by resistance line on On Balance Volume to stop a rise in price. There is no divergence between OBV and price to indicate weakness here.
RSI is not extreme. There is room for price to continue to rise.
DAILY CHART
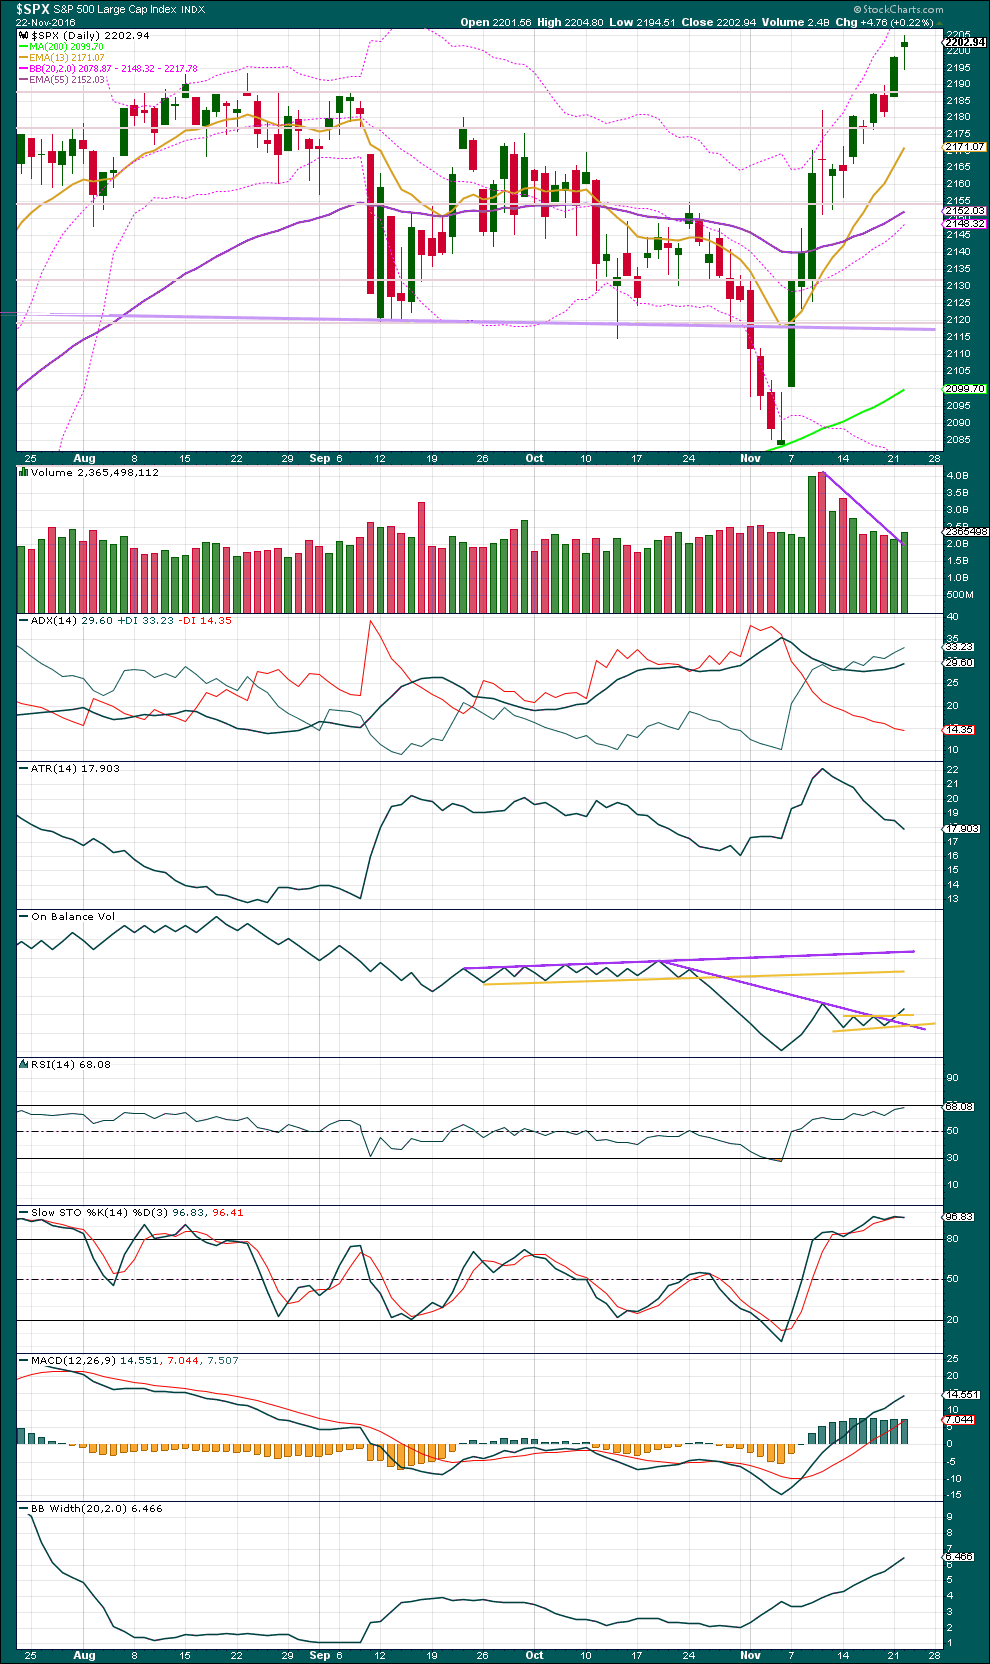
Click chart to enlarge. Chart courtesy of StockCharts.com.
This classic technical analysis section is updated at 10:23 p.m. EST.
Another upwards day has support from volume. This is not a hanging man candlestick because the upper wick is too large.
All three short, mid and long term moving averages are pointing up. Price is above all three. ADX is increasing and Bollinger Bands are widening. There is an upwards trend in place currently. Corrections are an opportunity to join the trend.
ATR is declining, so this trend is looking tired.
RSI is not yet overbought though. There is room for more upwards movement.
Stochastics is overbought and today shows divergence with price at today’s high. Price today made a new high, but Stochastics did not. This indicates weakness for bulls. This is not a signal of a trend change though. It is a warning to be alert for an upcoming trend change.
On Balance Volume today broke above the new short term yellow line. This is a weak bullish signal. Weak only because the line is short held and only tested twice before. There is strong divergence between price and On Balance Volume from the high on 10th of November and today, but divergence between OBV and price is not always reliable.
MACD is still bullish.
Overall, there is clearly an upward trend in place, but it is nearing an end. The end may come tomorrow or in another week. If RSI moves to overbought and then shows divergence with price, then an end will be expected to be imminent. That is not the case today.
VOLATILITY – INVERTED VIX CHART
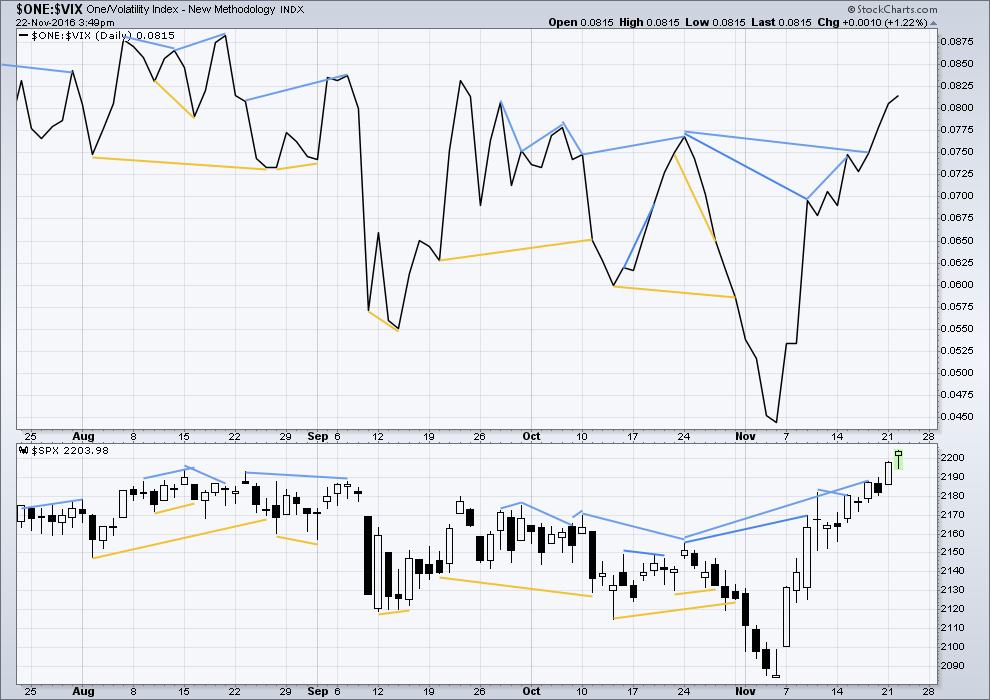
Click chart to enlarge. Chart courtesy of StockCharts.com.
There are a few instances of multi day divergence between price and inverted VIX noted here. Bearish divergence is blue. Bullish divergence is yellow. It appears so far that divergence between inverted VIX and price is again working to indicate short term movements spanning one or two days. While this seems to be working more often than not, it is not always working. As with everything in technical analysis, there is nothing that is certain. This is an exercise in probability.
No new divergence is noted today between price and VIX. Inverted VIX is moving higher as price is moving higher. Volatility is declining, which is normal for an upwards trend.
BREADTH – AD LINE
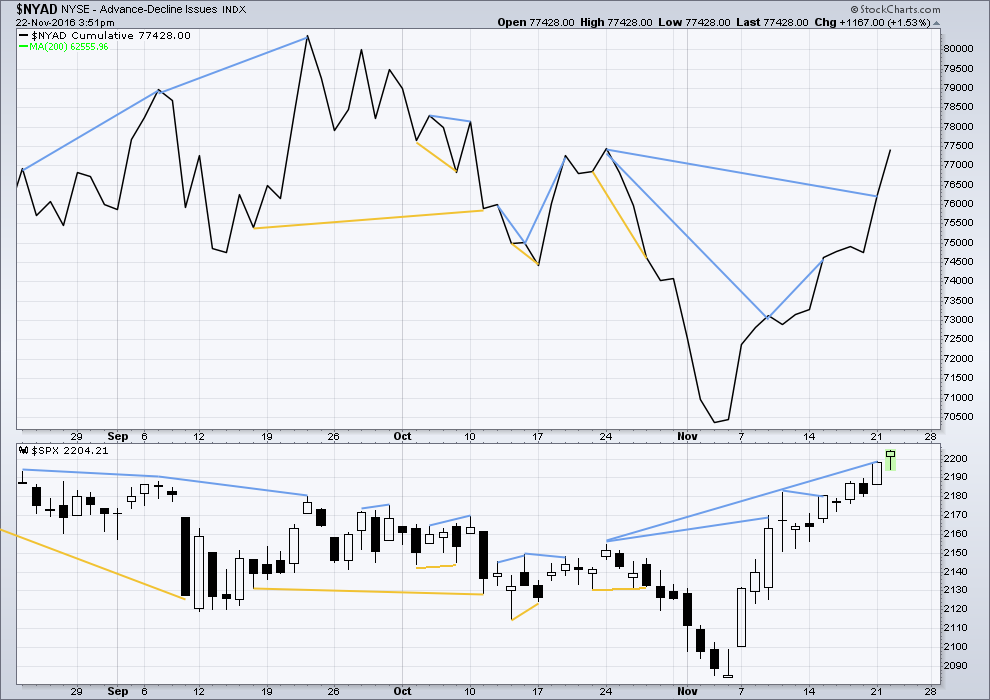
Click chart to enlarge. Chart courtesy of StockCharts.com.
Short term bullish and bearish divergence is again working between price and the AD line to show the direction for the following one or two days.
On Friday price moved overall higher with a higher high and a higher low than Thursday. The AD line however moved lower. This single day divergence is also bearish. It was not followed by a downwards day though, so it is considered to have failed.
The mid term bearish divergence between the highs of the 24th of October and yesterday has now disappeared today. The AD line has caught up to price and has also made a new high today. This divergence is considered to have failed also.
This upwards movement has the support of market breadth.
BREADTH – MCCLELLAN OSCILLATOR
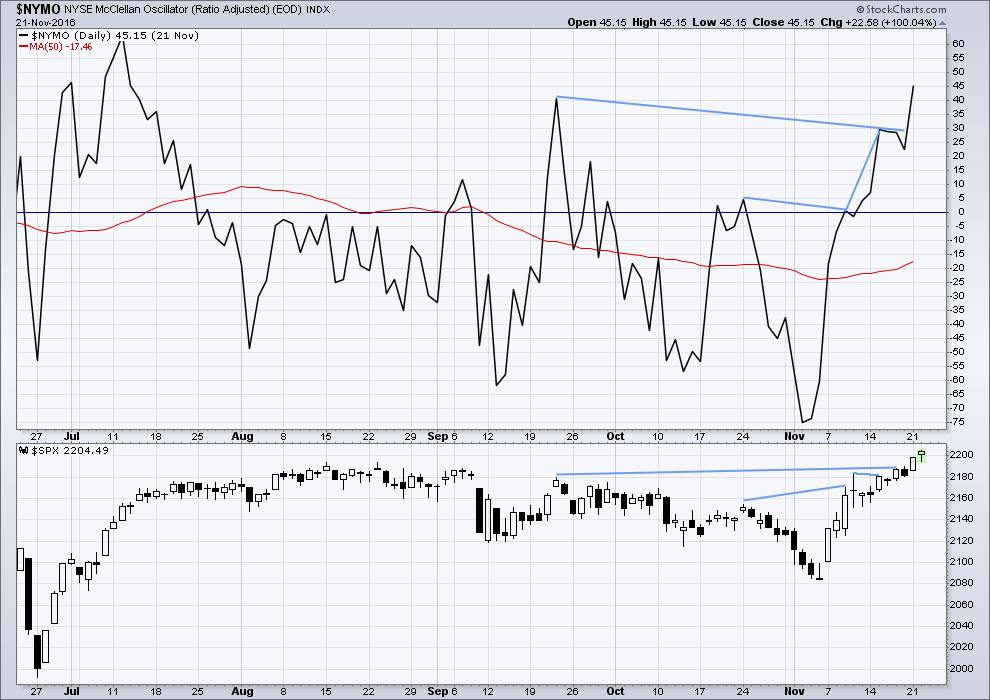
Click chart to enlarge. Chart courtesy of StockCharts.com.
On the 21st August, 2015, the McClellan Oscillator reached -71.56. Price found a low the next session, 104 points below the closing price of the 21st August. This very extreme reading for the 24th August would have been a strong indicator of a low in place.
On the 11th December, 2015, the McClellan Oscillator reached -80.82. It moved lower the next session to -92.65 and price moved 19 points lower. The extreme reading of 11th December might possibly have led to an expectation of a bigger bounce than the one that occurred, and might have misled analysis into missing the strong fall from 29th December to 20th of January.
The next most recent occasion where this oscillator was extreme was the 8th January, 2016. It reached -66.25 on that date. The low was not found for seven sessions though, on the 20th January 2016, almost 110 points below the closing price of the 8th January. At the low of the 11th February, there was strong bullish divergence with price making new lows and the oscillator making substantially higher lows. This may have been a strong warning of a major low in place.
The most recent occasion of an extreme reading was -75.05 on the 2nd of November. The last low came two days later.
As an indicator of a low this is not it. It is a warning of extreme levels. The next thing to look for would be some divergence with price and this oscillator at lows. Divergence is not always seen at lows, but when it is seen it should be taken seriously. Any reading over 100 should also be taken very seriously.
This indicator will be approached with caution. It is one more piece of evidence to take into account.
Recent hidden bearish divergence between price and the McClellan Oscillator has today disappeared. This too is considered to have failed.
The McClellan Oscillator is not yet extreme. Extreme is considered above +60 or below -60. There is still some room for price to rise.
DOW THEORY
Major lows within the old bull market:
DJIA: 15,855.12 (15th October, 2014) – closed below on 25th August, 2015.
DJT: 7,700.49 (12th October, 2014) – closed below on 24th August, 2015.
S&P500: 1,821.61 (15th October, 2014) – has not closed below this point yet.
Nasdaq: 4,117.84 (15th October, 2014) – has not closed below this point yet.
Major highs within the bear market from November 2014:
DJIA: 17,977.85 (4th November, 2015) – closed above on 18th April, 2016.
DJT: 8,358.20 (20th November, 2015) – closed above this point on the 9th of November, 2016.
S&P500: 2,116.48 (3rd November, 2015) – closed above this point on 8th June, 2016.
Nasdaq: 5,176.77 (2nd December, 2015) – closed above this point on 1st August, 2016.
Dow Theory Conclusion: The transportations indicate an end to the prior bear market. The transportation index confirms a bull market.
This analysis is published @ 04:40 p.m. EST.

Dear Lara,
Anyone who expects any TA analyst to be right all the time is a fool. Analysis and trading are both art and science. We are searching for patterns and tendencies etc. In addition, as has been said many times in the past, trading is hard work. Your work is absolutely essential to me and I appreciate it greatly.
I never understand why so many people become disinterested with bull markets. I can understand trendless market disinterest because it is much more difficult to be profitable. But great profits can come from trending markets no matter what the direction. Example in point, last week I wrote that I closed out a trade at +20% profit. In my case, this was also a large trade so it made a significant impact on my account balance(s). I don’t know why so many don’t find this acceptable or exciting. If they are out to get rich quick in a bear market, they will probably not make it as a trader.
Again, I rely upon your work and greatly appreciate it along with all the member commentary. Have a great day.
In my world the snow is falling in the mountains. A favorite time of year for me.
Thank you Rodney. Enjoy your snow, and may you have a really wonderful Thanks Giving.
We’ll stick with you through thick and thin Lara!
I often find that when I ignore your confidence points, or rather take the decision to trade before they are reached, I lose the trade. But that is my choice and I sometimes kick myself for it.
To ensure a trend change has actually happened I think I will wait for the first five waves, then the three wave retrace before entering although that is going to require a lot of patience and discipline.
That’s very kind Nick. Thank you.
I do now have a solid core of very loyal members, and that’s what keeps me going even when I get it horribly wrong.
Just so you all know, when I get it wrong I too have losses. And I feel awful. It can be discouraging, but then I jump back in with more energy to look deeper, learn from my mistakes and get it right next time.
I am looking forward to the pullback in order to get long and hold onto something for longer than a day. Figuring out when that begins is proving very tricksy.
It will come…. but when exactly?
Ris’ departure reminds me of a story Prechter tells about a major brokerage firm on Wall St firing all their technical analysts right before the 2000 high.
At the end of bull markets technical analysis is quite unpopular. Plenty of folks will opine that it doesn’t really work, or that the market is so broken it can’t work anymore.
I also have commented here that when the S&P goes up strongly this membership languishes or drops. When the S&P falls hard this membership surges.
It’s currently at a rather low point for the last 12 months 🙁 So I do hope the bear market hurries up.
You’re excellent analysis and continued hard work are much appreciated! Now go surfing!! 🙂
Thank you Chris 🙂 I did manage to find a small wave in the ocean this morning after coffee and before the NY close. Best time to go surfing.
I surfed with dolphins last week, and so I’m still stoked on that one
Absolutely right Lara. Even if they are not on the loosing side of trades, I know a lot of traders that literally get depressed when they feel the market is acting irrationally and not according to their expectations. I have found the best way to deal with those situations is simply stay on the sidelines until the situation becomes clearer. With convictions trades (such as buying cheap volatility), it is also critically important for traders to allow sufficient time for well-planned trades to pan out. A trade that initially moves against you does not necessarily have to result in a loss. I was quite early on my TBT trade two weeks ago after that initial upper BB penetration and ended up taking assignment of calls I had sold against an anticipated decline. I limited my upside exposure by buying calls against my short position in the shares and patiently remain in the trade. While I think long term yields are headed higher, unless reversion to the mean as a principle has been annulled, bonds are due for a bounce.
3.26% on the 30 Year Treasury is the spot to watch. If it breaks through there & continues higher with gusto… look out!
BTW: Vern… did you see Prechter’s report this evening. This makes or breaks… if I continue my subscription with them.
Yes I did. That interim report was quite interesting. I know a few other good Elliotticians that are calling an ED in the DOW. I too am expecting a final spike higher early next week or Friday. The neat thing about an ED is the reversal is brutal and leaves not doubt about what is developing once price closes back below the 1-3 trendline. The last one I saw in the long bond actually took a bit longer than usual to get going to the downside but played out exactly as expected with TLT falling hard to retrace the diagonal’s beginning. If that is what is going on in DJI, it will be a swift ride to the downside. The last decline was telegraphed by RUT and when that index decisively heads South it will probably be another heads-up for what is coming. I think based on what is going on with volatility that we could be close. I see extremes everywhere and as someone noted, fortune favors the prepared! Have a wonderful Thanksgiving with friends and family everyone!
Like this Verne?
I think this looks pretty good. I think I’ll add it as an addition for the next few days to the bottom of the S&P analysis. If it plays out as expected this could be a nice profitable trade for us all.
Lets make some money 🙂
Updated alternate hourly. This will be in the main body of the analysis today as an alternate.
For the main hourly wave count intermediate (1) could again be over.
It looks like the S&P is forming a slow rounded top which is typical for this market. When it does that it gets really hard to analyse the EW structure at the end. It keeps breaking trend lines and then continuing in the same direction. I’ve added another parallel line today.
Redrawing VIX trend-line to include low from Sep 8 at 11.65 to yesterday’s low at 12.20.
At the very least an interim top should be quite close. VIX today already diverging with price in DJI and an impending downturn would greatly increase if this kind of price action continues. VIX and market price both moving higher generally a reliably indication that a trend reversal is at hand. I remained fully loaded on long vol positions, albeit underwater on a few of them. Hard stops tightened to 10.50
Shorting GS huge right here at 212.70. HUUUUGE.
What if minor 4 wasn’t a triangle? This is also possible. There would be no limit for this wave count because minor 3 would be incomplete and longer than minor 1.
I’ll add this alternate to the main body of the analysis tomorrow, but I wanted to publish it here in comments so you’re all aware of it today.
The bottom line; the limit for the main wave count could be passed.
However, this upwards wave is showing a lot of weakness. Minute iii, the middle of the third wave, is the weakest. That doesn’t look right.
And minuette (c) of minute ii is slightly truncated.
I agree in that it does not look right. The slope of a 3rd of a 3rd should be much steeper. It is not strong relative to what comes immediately before or after.
Putting it into the larger context though it is entirely possible.
This is a fifth wave at cycle degree within a fifth wave at Super Cycle degree. I’d expect to see all kinds of internal weakness.
We’ve seen an impulse before with the third wave weaker and shorter than the first, then the fifth wave weakest still.
We may see that for primary 3, and within primary 3 at intermediate degree.
Yep. It really should penetrate that upper channel. The upward move looks, smells, and feels like a terminal wave to me…..
Terminal wave? Genuinely, What does that mean? This could actually be the top?
Like a fifth wave at multiple degrees. Clearly trying to call a top is an exercise in futility but the remarkable number of new 52 week lows in UVXY the last few weeks suggests an extreme in complacency.
Ok, gotcha. Thanks Vern.
Just dropping a quick note to thank all the folks on this board who provided guidance and their insight over the last year or so. I have decided to step away and focus on other projects as markets are not likely to behave per TA as most expect given the overriding influence some big players have. Once again thanks for sharing and all the best!
Sorry to see you go Ris. Thanks for your contributions. These sure are unusual times in the global financial markets. Best of all luck to you in all your future endeavors. Thanks also for saying good-bye. That is quite considerate of you.
Good luck Ris, and thanks for the goodbye. I always wonder why members leave when they do.
Maybe when the bear market is with us you’ll be back.
Hmmm. I was just thinking we are at a critical point here with interest rates providing a major headwind. I think we are within a few days of a top of some sort. The trump rally may have been fueled by those who took positions against the market when he won the electoral vote, a short squeeze of sorts. I would think big players may be getting a bit Ansey with their longs and may take some profits here and over the next few days, which jives with your latest 2006 Spx call being a top here for a bit. Markets thin on fri, so could see it pushed around….one last top or here today…..it feels real close
All the best Ris. I am really going to miss your comments.
Ditto – all the best Ris. Every dog has its day buddy – check back in once the bear starts kicking some royal butt. Mr M is mighty frustrating for many of us lately 🙂