
A slight new high and then downwards movement was expected for Friday. This is exactly what happened.
Summary: Downwards movement is expected to begin on Monday towards 2,120. Divergence between price and the AD line, and price and the McClellan Oscillator supports this view, as does declining volume.
Last monthly chart for the main wave count is here.
Last weekly chart is here.
New updates to this analysis are in bold.
MAIN WAVE COUNT
DAILY CHART
Click chart to enlarge.
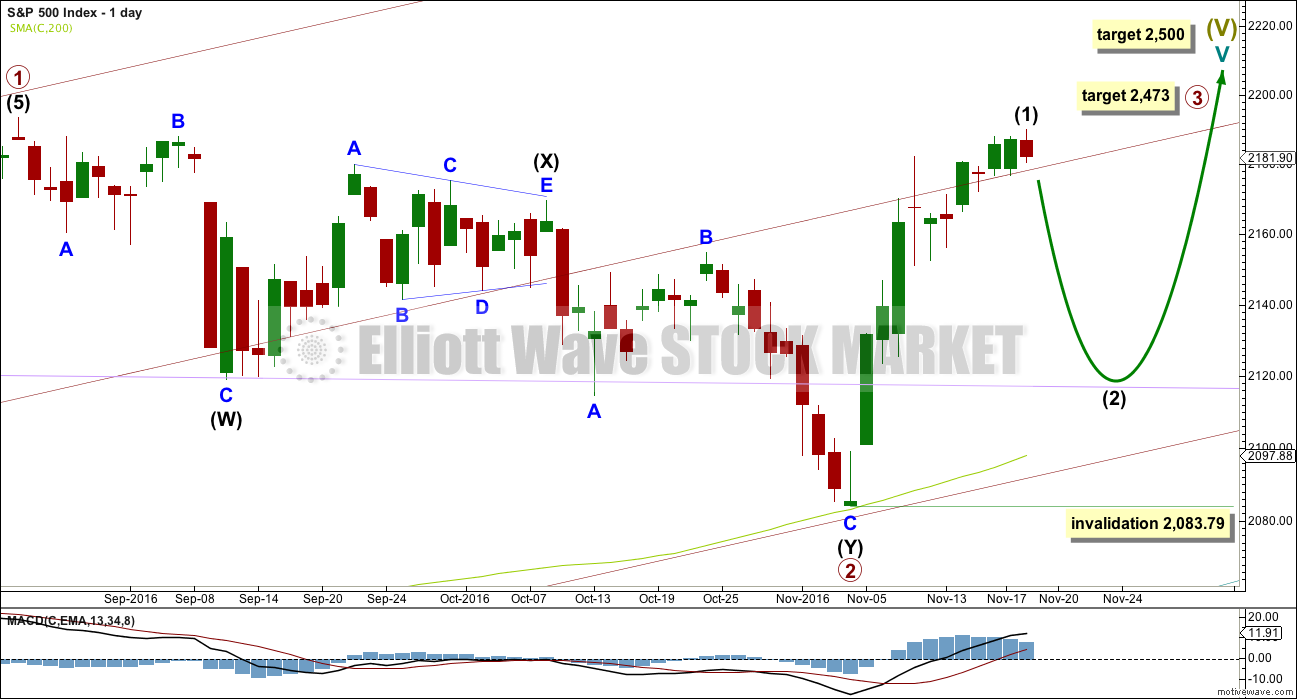
Primary wave 2 now looks to be complete as a double zigzag. Within primary wave 2: intermediate wave (W) was a very shallow zigzag lasting a Fibonacci 13 sessions; intermediate wave (X) fits perfectly as a triangle lasting 20 sessions, just one short of a Fibonacci 21; and intermediate wave (Y) also lasting 20 sessions deepens the correction achieving the purpose of a second zigzag in a double.
Primary wave 2 looks like it has ended at support about the lower edge of the maroon channel about primary wave 1, and at the 200 day moving average.
With upwards movement slicing cleanly through the lilac trend line, this behaviour looks to be more typical of an upwards trend. At this stage, corrections within primary wave 3 may be expected to turn down to test support at this trend line. While after hours movement did not find support there, the New York session did.
At 2,500 cycle wave V would reach equality in length with cycle wave I.
At 2,467 primary wave 3 would reach equality in length with primary wave 1. This is the ratio used in this instance because it fits with the higher target at 2,500.
Intermediate wave (1) may now be complete. Intermediate wave (2) may not move beyond the start of intermediate wave (1) below 2,083.79.
Primary wave 3 may show some strength compared to primary wave 1, but it does not have to. This wave count sees price in a final fifth wave at cycle degree, within a larger fifth wave at Super Cycle degree. The upcoming trend change may be at Grand Super Cycle degree, a once in generations trend change. This final fifth wave should be expected to exhibit great internal weakness; this market may appear broken. That would be typical behaviour for a final fifth wave of this magnitude.
HOURLY CHART
Click chart to enlarge.
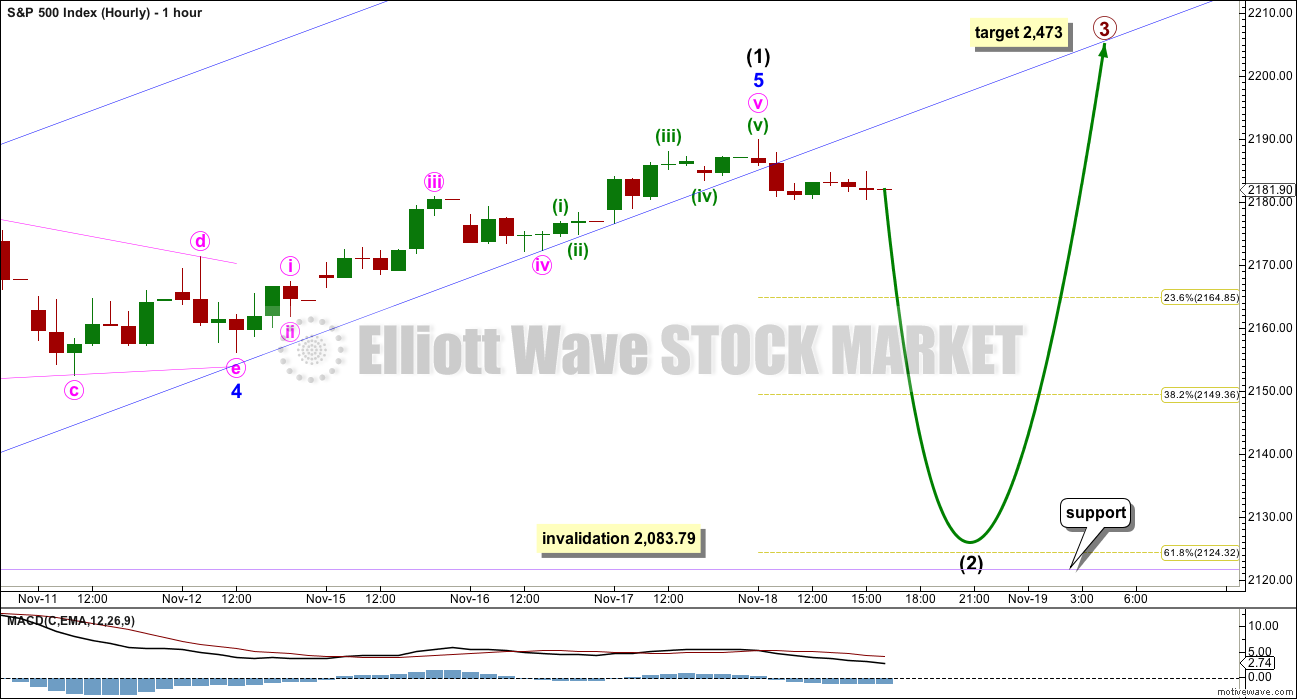
There is no Fibonacci ratio between minor waves 1 and 3. Minor wave 3 is slightly shorter than minor wave 1. Because a core Elliott wave rule states a third wave may not be the shortest, this limits minor wave 5 to no longer than equality in length with minor wave 3 at 2,213.03.
If minor wave 5 is over at Friday’s high, then it would be 1.39 points short of 0.618 the length of minor wave 3.
Minor wave 2 is a shallow 0.34 zigzag and minor wave 4 is a shallow 0.46 regular contracting triangle. This gives perfect alternation in structure and some alternation in depth.
Minor wave 5 is showing weakness. MACD has failed to make a new high while price has moved upwards. This wave lacks momentum.
Downwards movement for Friday broke below the lower edge of the best fit channel. This is a warning that upwards movement may be over, but it is no definitive. The S&P can breach channels yet continue in the old direction.
The target for intermediate wave (2) will be the 0.618 Fibonacci ratio of intermediate wave (1) at 2,124. This target is close to the support line at 2,120 and the lilac trend line.
Intermediate wave (2) may be expected to last about a Fibonacci 5, 8 or 13 days. It is most likely to be a single or double zigzag structure.
TECHNICAL ANALYSIS
WEEKLY CHART

Click chart to enlarge. Chart courtesy of StockCharts.com.
A smaller range upwards week on lighter volume looks like bulls are tiring. Some downwards or sideways movement next week is a reasonable expectation.
There is no close by resistance line on On Balance Volume to stop a rise in price. There is no divergence between OBV and price to indicate weakness here.
RSI is not extreme. There is room for price to continue to rise.
DAILY CHART
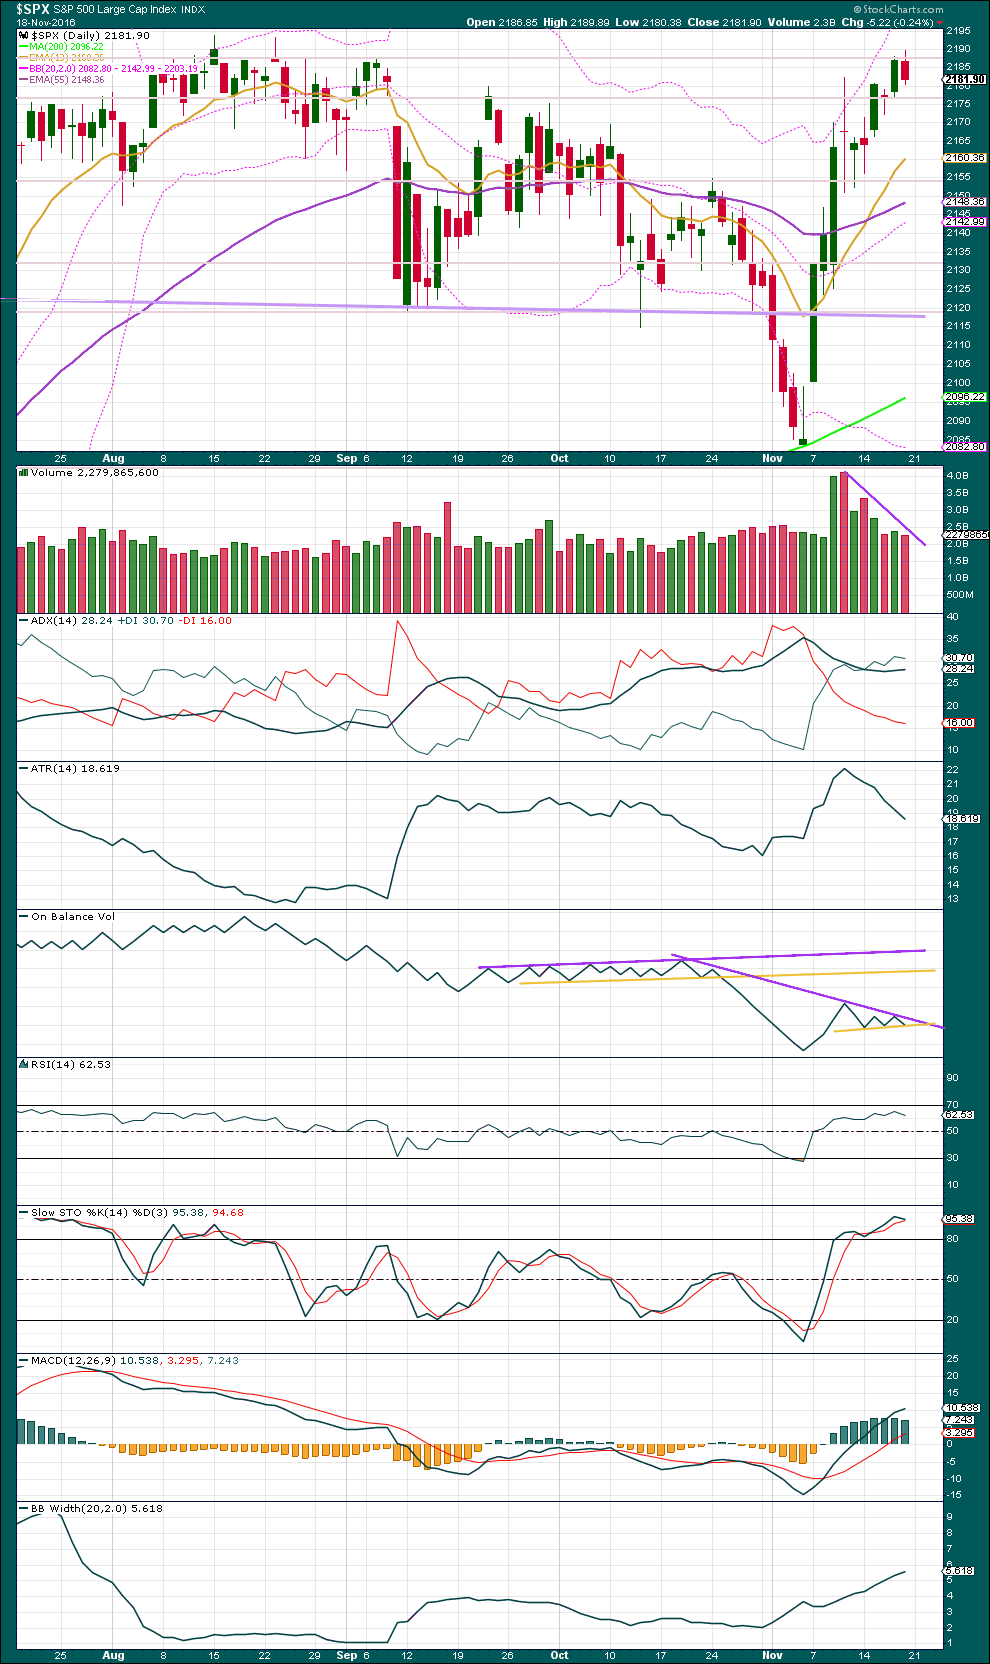
Click chart to enlarge. Chart courtesy of StockCharts.com.
Volume has declined as price has moved overall higher this week. ATR is also declining. The bulls look tired; each day the distance managed by bulls is less and less.
ADX is increasing, indicating an upwards trend. Bollinger Bands continue to widen in agreement. Price has been trending higher. Neither of these indicators will tell when the trend will change.
On Balance Volume is constrained between support and resistance. A breakout by OBV may signal the next direction for price.
RSI is not extreme and exhibits no divergence with price.
Stochastics is overbought, but this indicator may remain extreme for reasonable periods of time during a trending market. It does not exhibit any divergence with price to indicate weakness.
MACD is still bullish.
The only signal that price may pull back here is declining volume. It would still be typical behaviour of price to turn down to test support at the lilac trend line after breaching it.
VOLATILITY – INVERTED VIX CHART
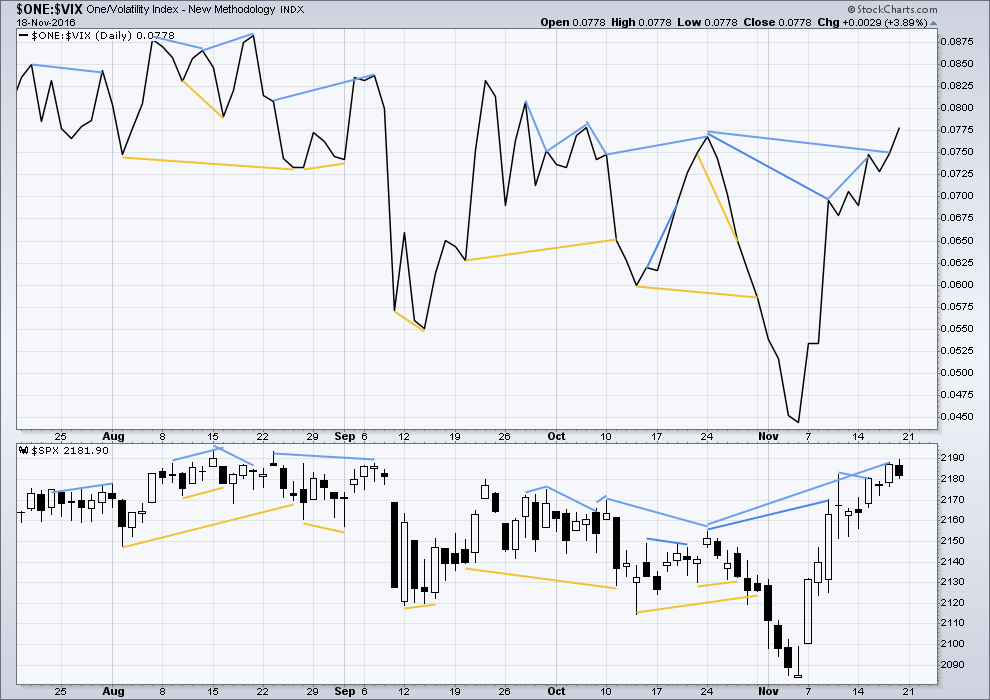
Click chart to enlarge. Chart courtesy of StockCharts.com.
There are a few instances of multi day divergence between price and inverted VIX noted here. Bearish divergence is blue. Bullish divergence is yellow. It appears so far that divergence between inverted VIX and price is again working to indicate short term movements spanning one or two days. While this seems to be working more often than not, it is not always working. As with everything in technical analysis, there is nothing that is certain. This is an exercise in probability.
Mid term divergence noted in last analysis has now disappeared. It may be considered to have been resolved by one day of downwards movement.
Price moved higher on Friday and inverted VIX also made a new high.
BREADTH – AD LINE
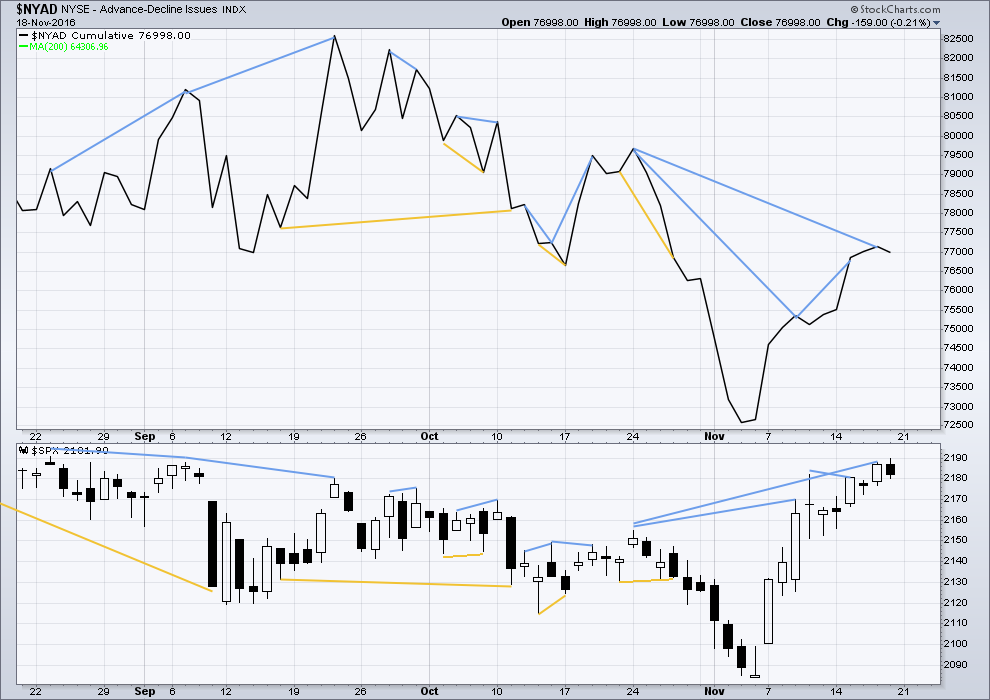
Click chart to enlarge. Chart courtesy of StockCharts.com.
Short term bullish and bearish divergence is again working between price and the AD line to show the direction for the following one or two days.
There is strong mid term divergence between price and the AD line: price has made a higher high above the prior high of the 24th of October, but the AD line has not managed to make a corresponding new high. This is regular bearish divergence. It indicates a lack of market breadth to this upwards movement from price these last nine days, and this strongly supports the Elliott wave count.
On Friday price moved overall higher with a higher high and a higher low than Thursday. The AD line however moved lower. This single day divergence is also bearish.
BREADTH – MCCLELLAN OSCILLATOR
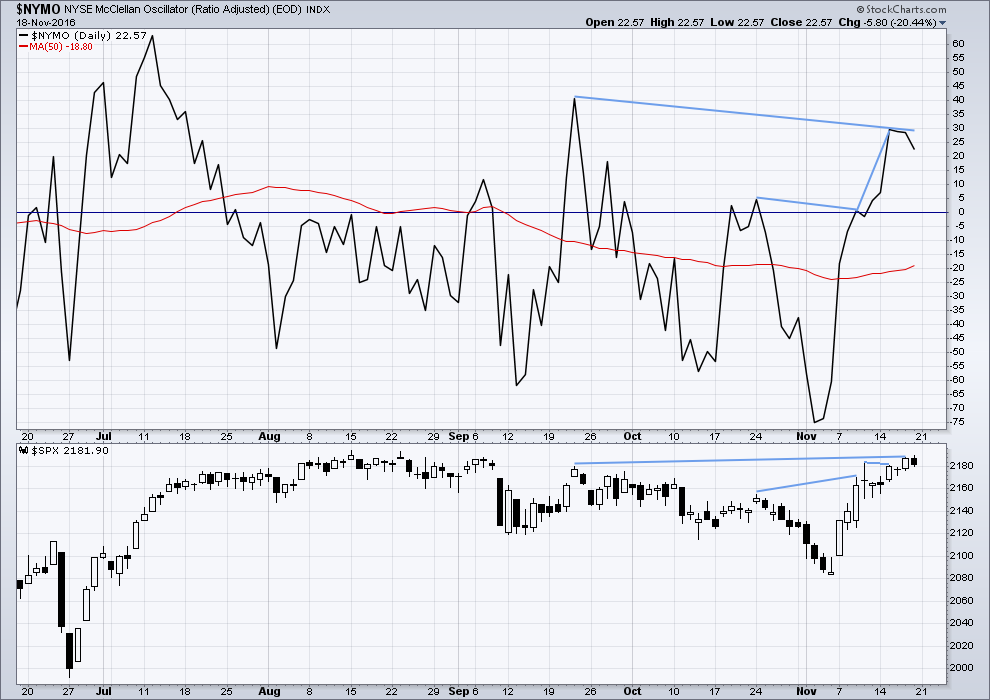
Click chart to enlarge. Chart courtesy of StockCharts.com.
On the 21st August, 2015, the McClellan Oscillator reached -71.56. Price found a low the next session, 104 points below the closing price of the 21st August. This very extreme reading for the 24th August would have been a strong indicator of a low in place.
On the 11th December, 2015, the McClellan Oscillator reached -80.82. It moved lower the next session to -92.65 and price moved 19 points lower. The extreme reading of 11th December might possibly have led to an expectation of a bigger bounce than the one that occurred, and might have misled analysis into missing the strong fall from 29th December to 20th of January.
The next most recent occasion where this oscillator was extreme was the 8th January, 2016. It reached -66.25 on that date. The low was not found for seven sessions though, on the 20th January 2016, almost 110 points below the closing price of the 8th January. At the low of the 11th February, there was strong bullish divergence with price making new lows and the oscillator making substantially higher lows. This may have been a strong warning of a major low in place.
The most recent occasion of an extreme reading was -75.05 on the 2nd of November. The last low came two days later.
As an indicator of a low this is not it. It is a warning of extreme levels. The next thing to look for would be some divergence with price and this oscillator at lows. Divergence is not always seen at lows, but when it is seen it should be taken seriously. Any reading over 100 should also be taken very seriously.
This indicator will be approached with caution. It is one more piece of evidence to take into account.
There is now two days running of divergence between price and the McClellan Oscillator. The oscillator moved lower while price moved higher for Thursday and Friday. Market breadth declined although price moved higher. This divergence is bearish.
The McClellan Oscillator is not extreme. There is still plenty of room for price to rise.
DOW THEORY
Major lows within the old bull market:
DJIA: 15,855.12 (15th October, 2014) – closed below on 25th August, 2015.
DJT: 7,700.49 (12th October, 2014) – closed below on 24th August, 2015.
S&P500: 1,821.61 (15th October, 2014) – has not closed below this point yet.
Nasdaq: 4,117.84 (15th October, 2014) – has not closed below this point yet.
Major highs within the bear market from November 2014:
DJIA: 17,977.85 (4th November, 2015) – closed above on 18th April, 2016.
DJT: 8,358.20 (20th November, 2015) – closed above this point on the 9th of November, 2016.
S&P500: 2,116.48 (3rd November, 2015) – closed above this point on 8th June, 2016.
Nasdaq: 5,176.77 (2nd December, 2015) – closed above this point on 1st August, 2016.
Dow Theory Conclusion: The transportations indicate an end to the prior bear market. The transportation index confirms a bull market.
This analysis is published @ 01:05 a.m. EST on 20th November, 2016.
A new all time high today for the S&P500 invalidates any and all bear wave counts at this time.
It’s still a bull market folks.
Corrections are an opportunity to join the trend. For the more aggressive they’re also an opportunity to make $$ on the other side. The dark side.
This bull market is old and tired, but it’s not done yet.
Thanks Lara,
Scaled some /ES futures at 2200. still expecting 2215-2230 this week with vix close to 11. Look forward to your analysis Lara.
The Percentage Of Stocks In A Bear Market Is Growing
As US stocks push to record highs, trading volume is dwindling and broad market breadth is terrible…
http://www.zerohedge.com/news/2016-11-21/percentage-stocks-bear-market-growing
(I’ve not verified the figures stated albeit another member mentioned something similar a few days ago)
Lowry’s OCO (Operating Companies Only) AD line shows support from breadth to this current wave upwards.
The general AD line does show horrible breadth, you’re right there.
Selling pressure is still only slowly contracting.
The bull market is old, but it’s not dead yet. That’s their conclusion, and mine too.
While I can see some weakness in this upwards movement it just keeps on going. It’s getting very close now to the round number pivot of 2,200. How price behaves here is important; if it slices up through it then that would be very bullish, but hesitancy around here is bearish.
Lets see how this ends this session. Volume will indicate too how tired or strong bulls are. But that too won’t tell us when this wave will end and a pullback will begin.
I won’t be going long here. It’s too close to the end I think for my comfort. Still holding a small short on DJIA which hasn’t made a new high today. As for the S&P… I want to see good indication of a turn and serious weakness before I go short here. I don’t see that yet.
A big question mark today on whether or not there is a high in place.
The question mark is nicely placed.
Sad day my friends. Not sure who is in London but my business today (a garden centre) went up in smoke. 14 years of work gone, heart broken
I am so very sorry Paresh. I cannot even imagine how devastating this must be for you. My prayers and thoughts are with you from the other side of the globe. I wish I could lend a hand of support. But these simple words are my expression of condolences. I am truly sorry.
Absolutely awful. I hope you can recover quickly, but will definitely be praying for you.
Very Sorry to hear that Paresh. Our prayers with you and your family.
Oh My! So very sorry to hear about this. As a small business owner I know how painful a loss like this is to take. I hope your insurance will pay fully and speedily to help lessen the pain of the loss. Also will be praying for you and your family Paresh.
I’m so sorry to hear that Paresh.
Email me or Cesar if you’d like your membership suspended while you focus on rebuilding your business, you can come back when you’re ready at the old rate.
Really sorry to hear that Paresh – I saw it on the news but never imagined a member here would be the owner.
Hope you get back on your feet soon. A 14 year customer base doesn’t go up in smoke – they’ll be back to support your new site soon enough.
It appears to me that on Friday SPX broke down and out of its uptrend channel on the hourly chart. Today’s gap up is a classic retest of that broken channel line completing the 5th wave of primary (1).
i have taken my first short the market position by being long volatility. Let’s see if the channel line holds and SPX fills this morning’s gap up. If it does and we close SPX down for the day, it could be the beginning of the awaited correction.
Stopped out with a very small loss on my long volatility position. Risk management required near by stops, a smaller position, and actual stops placed versus a mental stop. It was worth the try, however.
But the SPX hourly is back in its uptrend channel. Last week Lara, Olga and I all mentioned the SPX often does this. It plays dirty! I suspect this may continue for a couple more days.
IKR. This market just won’t play nicely with it’s trend lines. One of the most annoying habits of it….. but after seeing it do this many times before I’m very wary of those parallel channels.
Still loaded to the gills with volatility instruments of every possible variety. As expected, under water in a few positions but calls go out a way and also sitting on fewer options and more shares so time decay not a big concern. Hard stop on both VIX and UVXY at ten even. Scuba gear anyone?! 🙂
Hey Vern, I have a small long that I’m still holding from 11/7, and my chart is showing 2214 as a wave 5 on my timeframe. But like I said, could be wrong and I definitely would start a long up here.
Someone recently asked for comment on how I use volatility in my trading decisions and I gave the summary of buying it when it’s cheap and selling it when it is expensive. As simple as it sounds, it is remarkable how few are actually willing to do it since it is so counter-intuitive. Well, by any measure, particularly taking into consideration the current divergence with market price, it is currently cheaper than it has been in quite some time! 🙂
Another 52 week low on UVXY. Cheaper than it has been in the last year! But it has not yet touched nor penetrated its lower BB.
It looks to me that SPX missed a new ATM by just 9 cents or so. My data may not be the most accurate however.
Could be totally wrong here on the SPX, but I think 2214 area comes before any significant pullback.
David agree would you. 2200 in the cards and then possibly 2214-2230 range. This is seasonally strong week as well.
Looks like you might be right on David. SPX 2194 is the old high. Break it and 2200 should fall shortly.
Speaking of shortly, I have not yet entered any short positions. Perhaps I’ll soon be looking for another entry point for a long position.
It is really quite interesting how differently traders view the markets. I look at the incredibly over-bought situation and the price action in VIX and would not touch any long positions in this environment with a ten foot pole (apart from hedges) and on the other hand, a few of us on the board are calling for a march in SPX above 2200. Fascinating! 🙂
I am curious as to what you would consider “significant”. I personally would consider anything less than 3% to be fall into the insignificant category.
Made my final purchase of volatility with remaining available trading capital at this morning’s VIX lows. Fully locked and loaded.
( A truck-load of Dec expiration VIX 10 strike calls)
Vern,
I have been adding Feb and April Vix calls as a hedge against my longs. VIx however still has a potential to get to 10.50-11 handle by Friday this week. A close above 16 on Vix will make the likely scenario of 2120-2140 possible short term. This being a short trading week and seasonally strong, bias is towards new highs and 2200 + this week.
Possible. I would would be unable to take advantage as I have a full allocation for my VIX long positions. As tempting as it would be to add to them with a continued run higher, I will be maintaining position size discipline for now…hedged with near term DIA and IWM calls from older bearish call spreads – one of the things I really appreciate about spread trades! 🙂