
Upwards movement to a short term target at 2,139.50 was expected.
Upwards movement did unfold, but reached 7.37 points above the target.
Summary: Volume does not support this upwards movement, and there is some regular bearish divergence between price and the AD line today. While the main wave count is preferred, it is not yet finally confirmed. A new high above 2,154.79 would confirm the main wave count and see the alternate discarded. A break below the lilac trend would be concerning for the main wave count, and a new low below 2,083.79 would increase the probability of the alternate. There is enough suspicion about this upwards movement today to warn members to be very nimble and flexible in the next few days, particularly tomorrow. Look for a downwards correction to find support at the lilac trend line about 2,123.
Last monthly chart for the main wave count is here.
Last weekly chart is here.
New updates to this analysis are in bold.
MAIN WAVE COUNT
DAILY CHART
Click chart to enlarge.
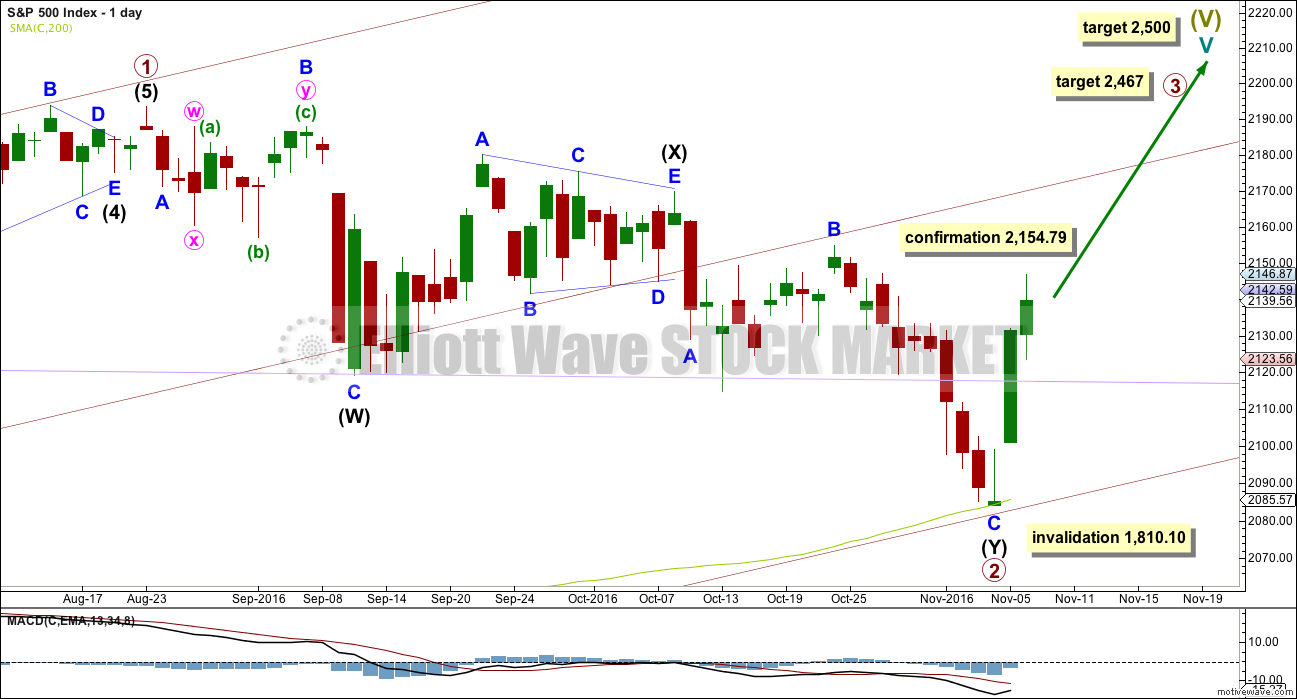
Primary wave 2 now looks to be complete as a double zigzag. Within primary wave 2: intermediate wave (W) was a very shallow zigzag lasting a Fibonacci 13 sessions; intermediate wave (X) fits perfectly as a triangle lasting 20 sessions, just one short of a Fibonacci 21; and intermediate wave (Y) also lasting 20 sessions deepens the correction achieving the purpose of a second zigzag in a double.
Primary wave 2 looks like it has ended at support about the lower edge of the maroon channel about primary wave 1, and at the 200 day moving average.
With upwards movement slicing cleanly through the lilac trend line, this behaviour looks to be more typical of an upwards trend. At this stage, corrections within primary wave 3 may be expected to turn down to test support at this trend line.
At 2,500 cycle wave V would reach equality in length with cycle wave I.
At 2,467 primary wave 3 would reach equality in length with primary wave 1. This is the ratio used in this instance because it fits with the higher target at 2,500.
Primary wave 3 may show some strength compared to primary wave 1, but it does not have to. This wave count sees price in a final fifth wave at cycle degree, within a larger fifth wave at Super Cycle degree. The upcoming trend change may be at Grand Super Cycle degree, a once in generations trend change. This final fifth should be expected to exhibit great internal weakness; this market may appear broken. That would be typical behaviour for a final fifth wave of this magnitude.
HOURLY CHART
Click chart to enlarge.
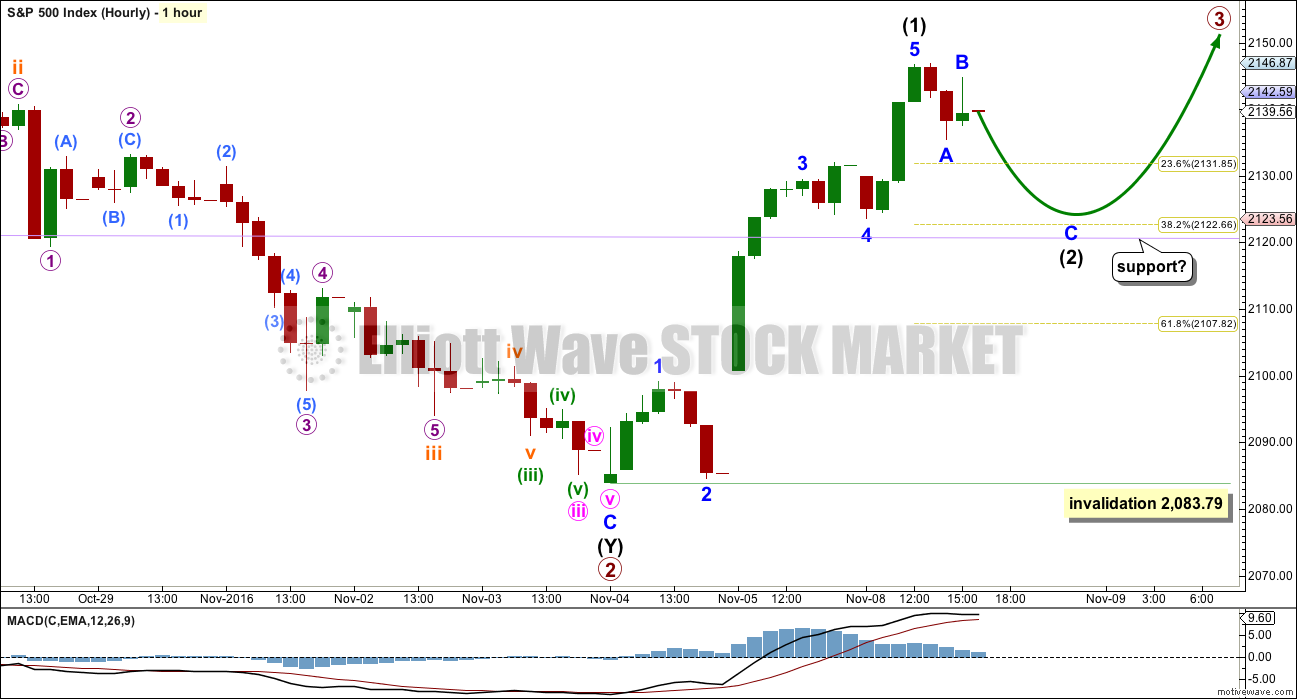
A five wave structure upwards may be complete. This may be intermediate wave (1), or the degree of labelling within this upwards movement may need to be moved down one degree to minor.
The invalidation point is at the same place no matter what degree of labelling is used. Intermediate wave (2) may not move beyond the start of intermediate wave (1) below 2,083.79.
Fibonacci ratios within intermediate wave (1) are: there is no Fibonacci ratio between minor waves 3 and 1, and minor wave 5 is 1.59 points short of 1.618 the length of minor wave 1.
Intermediate wave (2) may be relatively shallow if it finds support about the lilac trend line. It would be typical behaviour of price to turn down to test support after breaking through this line.
If price does find support at the lilac trend line, then it may offer an opportunity to join an upwards trend. However, it is essential that stops are used. The risk is that the alternate wave count may still be correct, so this risk must be accepted.
A new low below 2,083.79 would invalidate this main wave count at the hourly chart level. It would also substantially reduce probability of this wave count at the daily chart level. While it would be possible that primary wave 2 could be continuing lower, the structure would not have as good a fit and would look odd.
ALTERNATE WAVE COUNT
DAILY CHART
Click chart to enlarge.
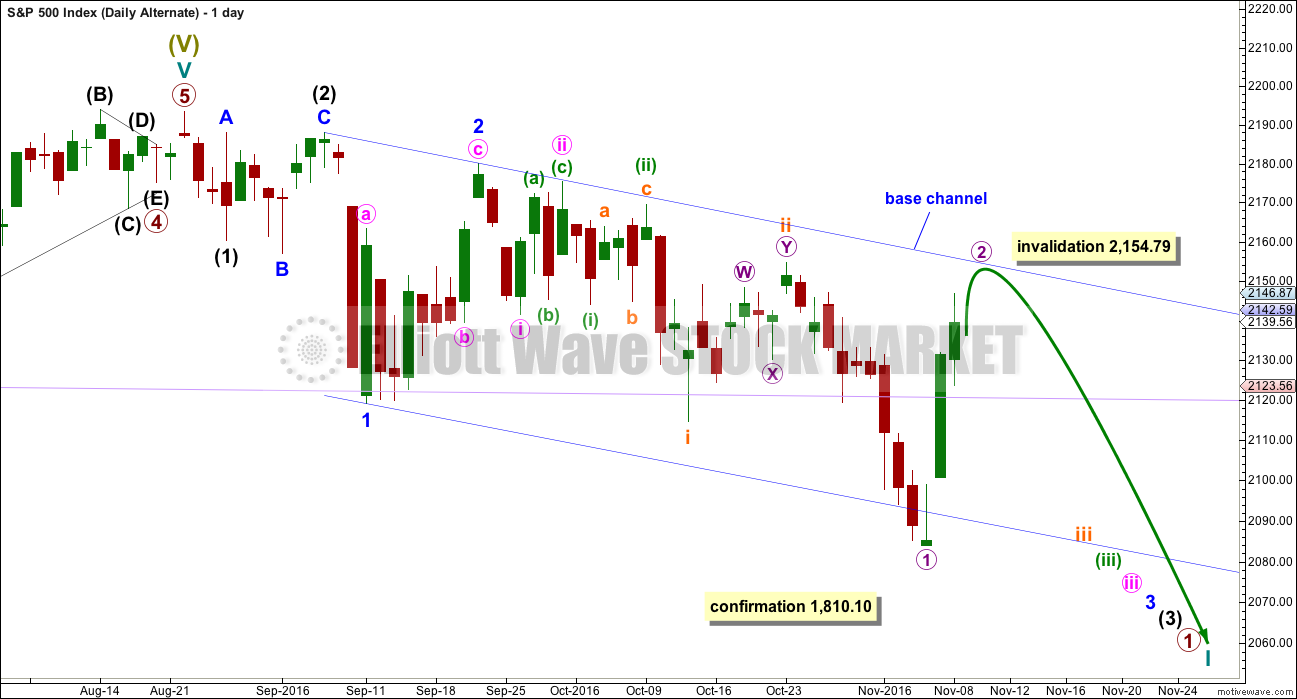
What if this downwards movement is the start of something even bigger?
This wave count expects that a new bear market to span several years and take price substantially below 666.76 has begun. For such a huge call it absolutely requires price confirmation below 1,810.10.
If a new bear market has begun, then the degree of labelling within the last impulse upwards is simply moved up one degree.
Downwards movement from the all time high may be a series of overlapping first and second waves. What looks like an obvious triangle must be ignored for this wave count. This is problematic, and it reduces the probability of this wave count. But this is a viable wave count.
The dark blue channel is a base channel about minor waves 1 and 2. Minor wave 3 should have the power to break through the lower edge of the base channel. The middle of minor wave 3 would not yet have passed for this wave count because price remains within the base channel.
Another first and second wave correction may be completing at micro degree. There may now be six overlapping first and second waves. This wave count now expects to see an imminent explosion to the downside.
At the hourly chart level, micro wave 2 is still incomplete and should move higher. It should find very strong resistance at the upper edge of the dark blue base channel. Any breach of the upper edge of this channel would substantially reduce the probability of this wave count.
Micro wave 2 may not move beyond the start of micro wave 1 above 2,154.79.
A new low below 2,083.79 would increase the probability of this alternate wave count.
TECHNICAL ANALYSIS
WEEKLY CHART
Click chart to enlarge. Chart courtesy of StockCharts.com.
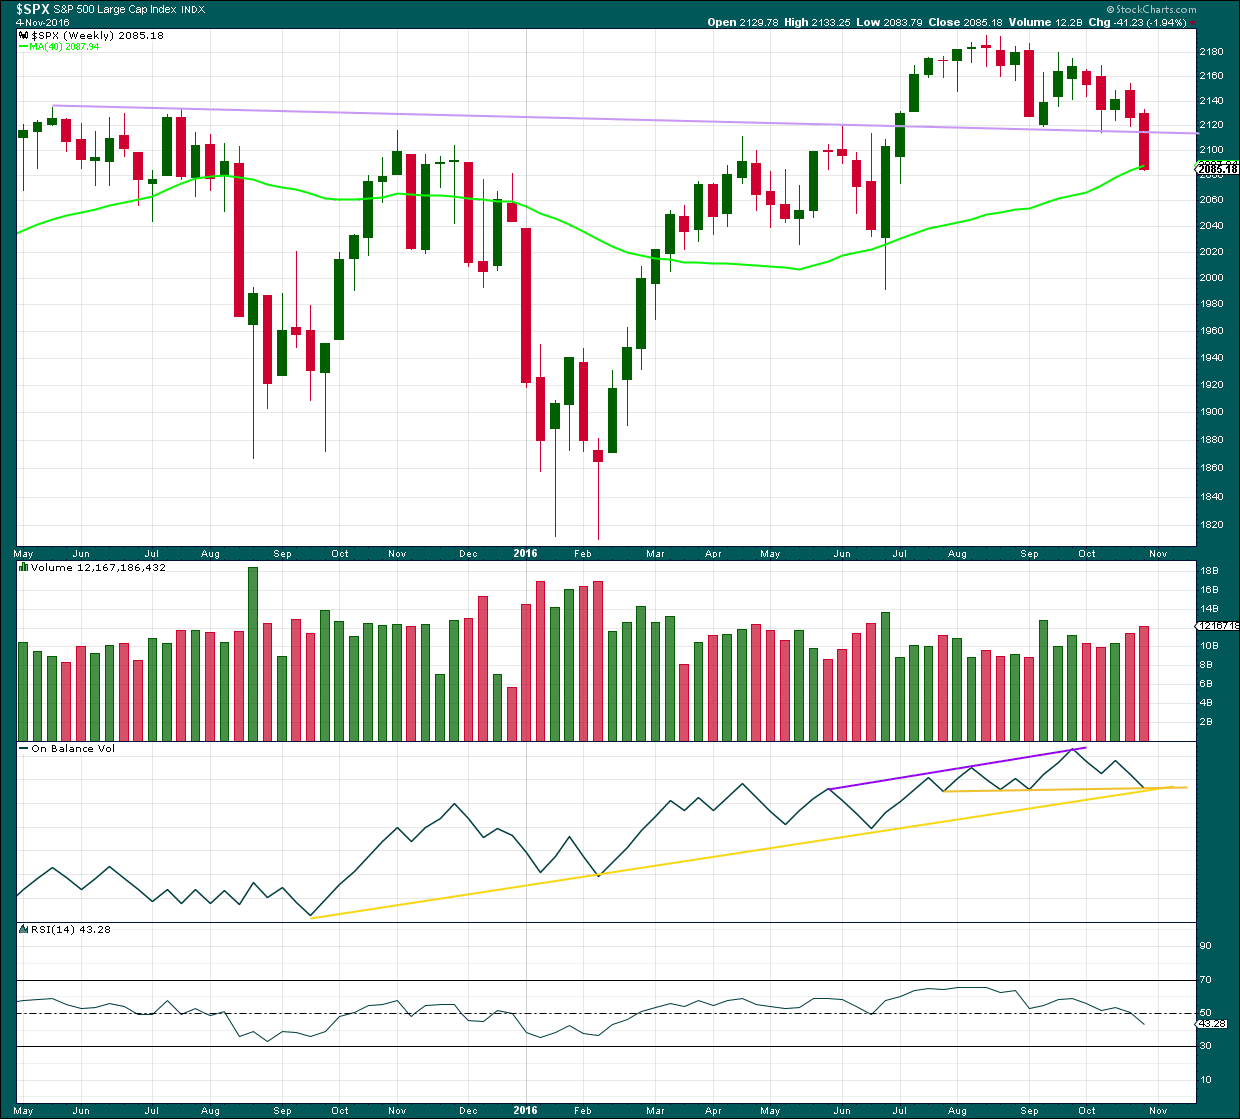
A strong downwards week breaking and closing well below the lilac trend line is a strong bearish signal. After a trend line breach, it would be typical to see price turn upwards and test resistance at the line.
There is strong support for price here from the 40 week (200 day) moving average. There is strong support for On Balance Volume here by both yellow lines. This suggests price may bounce early next week.
How high the bounce goes is going to tell us which Elliott wave count is correct. From a classic technical analysis point of view a breach back above the lilac line would be very bullish. If that happens, then new all time highs may be expected. But if the lilac line remains intact and provides strong resistance, then the possibility of a bear market would increase.
DAILY CHART
Click chart to enlarge. Chart courtesy of StockCharts.com.
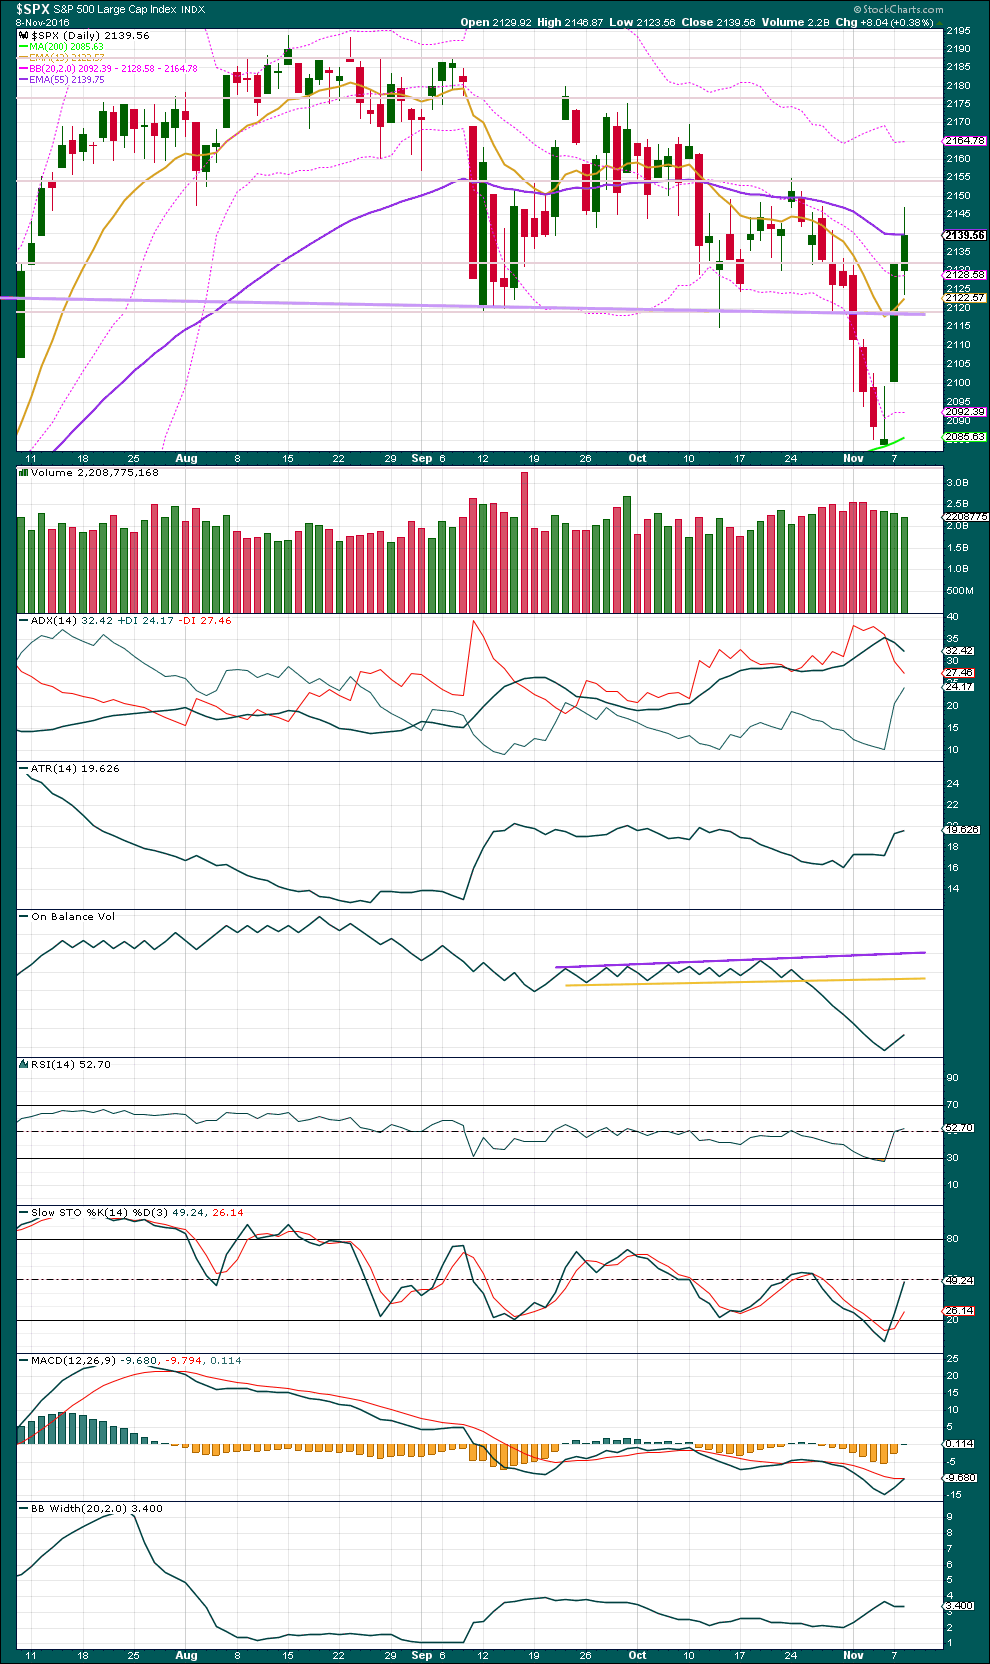
Three green daily candlesticks in a row all come with declining volume. The rise in price is not well supported by volume, so it is suspicious. This supports the alternate Elliott wave count over the main count. Members are warned that the alternate wave count does remain valid despite having a lower probability. Beware of the implications of this tomorrow.
Next resistance is about 2,155.
ADX does not yet indicate a trend nor a trend change. The -DX line remains above the +DX line.
ATR indicates a possible new trend as it is increasing as price moves higher. However, Bollinger Bands slightly contracted today. So there is some doubt with two of these three indicators not indicting an upwards trend. If there is an upwards trend, this is a very early stage.
RSI and Stochastics are both back close to neutral. There is plenty of room for price to rise or fall.
VOLATILITY – INVERTED VIX CHART
Click chart to enlarge. Chart courtesy of StockCharts.com.
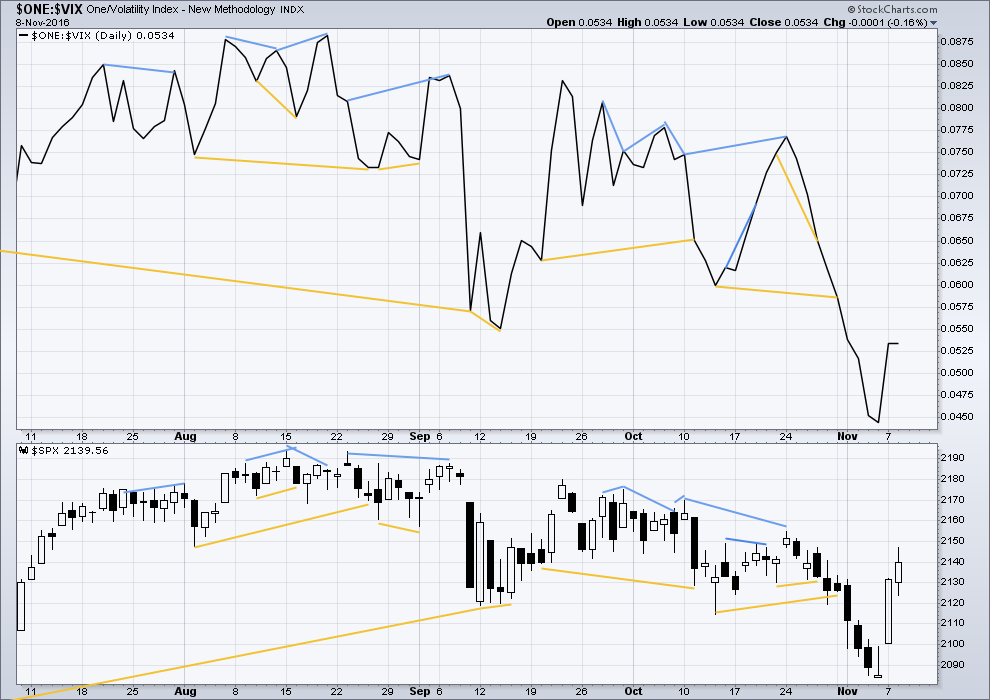
There are a few instances of multi day divergence between price and inverted VIX noted here. Bearish divergence is blue. Bullish divergence is yellow. It appears so far that divergence between inverted VIX and price is again working to indicate short term movements spanning one or two days.
While price moved higher today, VIX is unchanged. This is not enough to say there is divergence, but this is not normal behaviour. An upwards trend should come with a decline in volatility for it to be healthy and sustainable. That this movement does not adds some suspicion.
BREADTH – AD LINE
Click chart to enlarge. Chart courtesy of StockCharts.com.
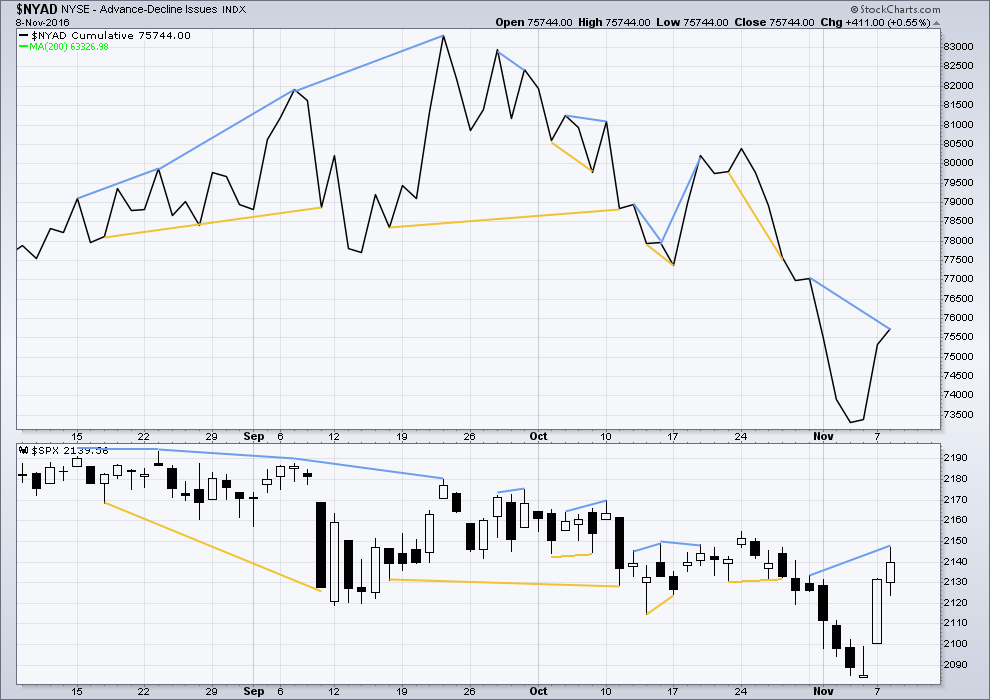
Short term bullish and bearish divergence is again working between price and the AD line to show the direction for the following one or two days.
There is short – mid term regular bearish divergence today between price and the AD line: price has made a higher high above the high for the 31st of October, but the AD line has made a lower high. This rise is not supported by a corresponding increase in market breadth while bulls have pushed price higher for three days, so it is suspicious.
BREADTH – MCCLELLAN OSCILLATOR
Click chart to enlarge. Chart courtesy of StockCharts.com.
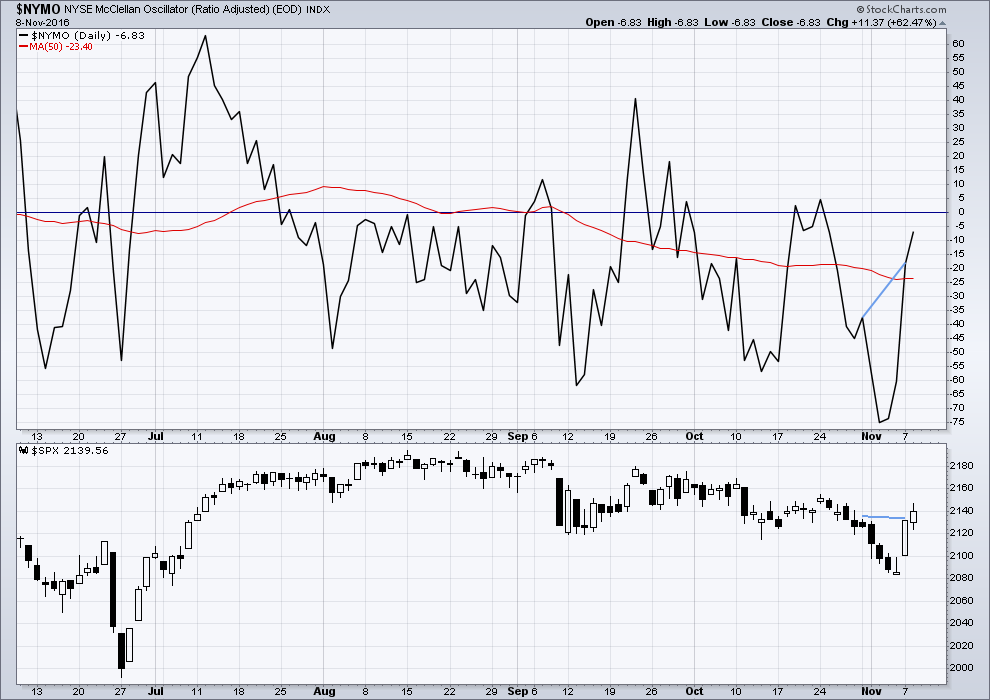
The McClellan Oscillator is now extreme (below 60). On its own this is not an indicator of a low, but it is a warning that this market is oversold. The McClellan Oscillator today is at -73.44.
On the 21st August, 2015, the McClellan Oscillator reached a similar point of -71.56. Price found a low the next session, 104 points below the closing price of the 21st August. This very extreme reading for the 24th August would have been a strong indicator of a low in place.
On the 11th December, 2015, the McClellan Oscillator reached -80.82. It moved lower the next session to -92.65 and price moved 19 points lower. The extreme reading of 11th December might possibly have led to an expectation of a bigger bounce than the one that occurred, and might have misled analysis into missing the strong fall from 29th December to 20th of January.
The next most recent occasion where this oscillator was extreme was the 8th January, 2016. It reached -66.25 on that date. The low was not found for seven sessions though, on the 20th January 2016, almost 110 points below the closing price of the 8th January. At the low of the 11th February, there was strong bullish divergence with price making new lows and the oscillator making substantially higher lows. This may have been a strong warning of a major low in place.
As an indicator of a low this is not it. It is a warning of extreme levels. The next thing to look for would be some divergence with price and this oscillator at lows. Divergence is not always seen at lows, but when it is seen it should be taken seriously. Any reading over 100 should also be taken very seriously.
This indicator will be approached with caution. It is one more piece of evidence to take into account.
Very weak bearish divergence noted yesterday did not result in any downwards movement. No new divergence is noted today.
This oscillator is not extreme. There is plenty of room for price to rise or fall.
While the AD line shows internal weakness, the McClellan oscillator does not. This supports the main Elliott wave count.
DOW THEORY
Major lows within the old bull market:
DJIA: 15,855.12 (15th October, 2014) – closed below on 25th August, 2015.
DJT: 7,700.49 (12th October, 2014) – closed below on 24th August, 2015.
S&P500: 1,821.61 (15th October, 2014) – has not closed below this point yet.
Nasdaq: 4,117.84 (15th October, 2014) – has not closed below this point yet.
Major highs within the bear market from November 2014:
DJIA: 17,977.85 (4th November, 2015) – closed above on 18th April, 2016.
DJT: 8,358.20 (20th November, 2015) – has not closed above this point yet.
S&P500: 2,116.48 (3rd November, 2015) – closed above this point on 8th June, 2016.
Nasdaq: 5,176.77 (2nd December, 2015) – closed above this point on 1st August, 2016.
Dow Theory Conclusion: Original Dow Theory still sees price in a bear market because the transportations have failed to confirm an end to that bear market. Modified Dow Theory (adding S&P and Nasdaq) has failed still to confirm an end to the old bull market, modified Dow Theory sees price still in a bull market.
It is noted today that while the S&P500, DJI and Nasdaq moved lower, DJT did not. This is not part of Dow Theory, but divergent behaviour between DJT and the other indices is a cause for concern regarding this downwards trend for the S&P500.
This analysis is published @ 08:34 p.m. EST.
The Transportations today provide important confirmation of a bull market.
I am taking the last major swing high within the last bear market as 8,358.2. Today DJT closed above this point.
Dow Theory says we are now in a bull market folks.
Until it says we are not we should assume we are.
Bill Ackman and Caral Icahn have two interesting things in common. in addition to being two of the savviest investors of their generation, they have both doubled down on trading positions that have suffered substantial losses, Ackman in the case of Valeant, and now Ichan in the case of Hertz. I will never be remotely as capable as these men but I think Porter Stansberry has some real insight when he comments that both men are missing the critical importance of a credit cycle that is changing, and that will spell the doom of previous high flyers that are deeply indebted. Tim Knight thinks they have made a mistake typical of novice traders- doubling donw on a loosing trade. I am sure Ackman would love to have the Valeant price now at which he initially doubled down. Icahn could find himself in the same position eventually.
Icahn is announcing that he invested a billion in futures at the low of last night’s meltdown. He has already made a great return on that trade. I have never ever seen DJI futures bought 800 points out of the red in all the years I have been in the markets. Not only was DJI bought that deeply out of the red, when it was still down by several hundred points VIX was also already deeply in the red, another remarkable anomaly. This is not normal market behaviour. These are price movements that one would expect in a bear market. The range of price swings we are seeing seems to me to be unprecedented. I do not fully understand what is going on in the markets right now. I never trade what I do not understand, so I remain mostly in cash. I have started to accumulate volatility as it is again becoming cheap. I think it is going a lot higher. Stay Frosty!
Verne,
I am glad that you feel this way as I have been searching and looking for a rationale for today’s market action. I had bought SPX short position at yesterday’s high so was very pleased to see hugely down market as election results were being announced but today is totally unreal. Fortunately, there is time on my side but never thought of this scenario playing out.
I see bearish divergence between price and inverted VIX, and McClellan oscillator and the AD line. It’s quite strong.
Price is at the upper edge of the Bollinger Bands.
I’m expecting a red candlestick tomorrow.
I cannot find an alternate bearish wave count at this stage. I may not have one to publish for you all tonight…. still working on it.
There are quite a few interesting anomalies I am seeing. I had a few SPY 220 (Nov 16) strike puts left over from a bearish call spread I made awhile back that were still in the money and unloaded them yesterday for a profit on both legs. After today’s run-up I was chiding myself for not continuing to hold them as an upside hedge but when I checked the bid/ask, they were selling for even less than I got yesterday, even at today’s high! Most strange. I know quite a few traders that are really feeling cheated today. One person saw a 100K profit literally evaporate from his trading account by the open. I think the market is a very dangerous place for the unwary right now, and possibly even for experienced traders. I have never ever seen anything like I saw last night and frankly I find it somewhat ominous. I have a feeling Mr. Market is not quite done with those lows we saw overnight.
A sustained run with DJI above its BB would indeed be another very unusual development.
We are overbought.
I won’t be leaving anything open overnight. Unless I’m watching it like a hawk… and even then maybe not.
But then my time zone really is awful for trading this market.
Vern,
That is one reason I use /ES options (S&P futures) among others. You can trade them overnight and take advantage of wild swings when they happen. I know several professionals who have migrated over to futures markets for hedging and trading while owning core stock or commodity positions.
Verne,
I am one of those traders that you mention so you plan and execute the trade after waiting and then this surprise out of the blue throws you back to drawing board and you have to start from scratch again..oh well that’s life.
Lara, do you see a possible bear market alternate at this point, or are we out of those woods?
This upwards movement is still within the blue base channel on the bear wave count, and so that count remains the same and is still valid.
Ok thank you
No, it has now breached the base channel and the invalidation point.
I’m looking for an alternate. So far I cannot see one.
Okay, I have one. But it feels and looks horrible. It feels… manufactured.
Alternate hourly chart:
It’s possible that intermediate (2) isn’t over. It could be an expanded flat correction to still have a spike down which should find support at the lilac trend line.
Minor B would be 1.79 X minor A, this is longer than the maximum common range of 1.38 but within allowable convention of up to 2. So this is possible.
Because minor B is longer than the common range I must judge this idea to have a lower probability.
Oops… my labels for minute a and b are not placed correctly. Will fix.
Updated main hourly chart:
With this EW analysis only using NY session data this must still be the main wave count. The spike down and back up after hours cannot be taken into account.
Intermediate (2) may be over, intermediate (3) up may be underway. If the degree of labelling within (3) is moved down one and minor 2 is yet to unfold then it may not move beyond the start of minor 1 below 2,139.52
Rodney,
I scaled some longs — still long like you — shorted gold last night and scaled it this AM.
Lara thanks for all you do. (I was scared last night). Did not sleep much. But scaled 30% of my positions I have had this whole year. Will wait for the eventual crash. But it may not start till 2017. Seasonally strong period now (till end of the year).
It looks like this market is still in a bull market. Maybe to continue until October 2017?
From an EW perspective that makes no sense though that the electorate in the USA would choose such a big change from Democrats to Trump if this market is still bull.
Yes, I am still long. In fact, in the green as of today. I missed acquiring my last long position over this week. But that is okay. I will have ammo at the next swing low of significance. That being said, we are very near ATH’s on several of the indices. If we burst through we may witness some panic buying push us up another 100 points before a pause. Greed can push the market and we haven’t seen that sort of buying in the last three months.
Today’s candlestick is powerful. Combined with the weekly (if it holds) gives a great deal of support to the Main count. We are also above all the moving averages on the daily charts. Lastly, daily MACD has made a bullish cross over. These are all pieces of evidence supporting the Main count. If we add increasing volume that will give much more confidence.
Wow… I wake up to bizarro world 🙁
I watched price drop to 2,032 last night, only to wake up and see the NY session has price UP not down.
What?
So the NY session has found support at the lilac trend line. That’s where intermediate (2) ends. Now a third wave of a third wave up.
The confirmation point remans at 2,154.79. Or…. maybe that should be called a confidence point. I think I need to stop using that word confirmation, because there’s always an alternate scenario.
In the early 1800’s as the Battle of Waterloo was finishing, Lord Rothchild had the first report of Wellington’s victory over Napoleon. It was a secret only he and his paid messengers knew. But he began selling hard and doing it publicly. Everyone thought he must be in the know and began to sell along side him creating a great panic slide in the market. Then before the truth of Napoleon’s defeat arrived to the public, Lord Rothchild began buying all he could. He began paying 10 cents on the dollar (or pound) for English bonds as well. Needless to say, when the truth of the outcome arrived in England, Rothchild significantly boosted his massive wealth.
I am thinking what we have witnessed over the last 12 hours is a repeat of that which took place that night so long ago. Someone bought all those futures just above SPX 2000. Today they are sitting on a big pile of profits. Unfortunately it is not me!
With due regards I see the reverse situation. The panic yesterday was real and the pull up today morning was planned. It has already started loosing it’s sheen.. Let’s see where it is during the low hours of the day.
That is exactly one of the interesting things about the financial markets, they can keep us in suspense.
Just Printed a green
Are we looking for 2154 again as confirmation?
Yes. But I call it a ‘confidence’ point. What it really does is invalidate the Alternate count as printed. That gives us more confidence in the Main count.
And who would have thought, we are now in the green on the SPX. Before the first half hour of trading is over, we are green. Up from a -100 point loss over night.
Yesterday, 1 minute after the close and before the 100+ SPX point drop overnight, I wrote:
“In the last ten minutes it looks like the bears are selling it into the close or the bulls are taking their money off the table. I think it is the start of the c wave of this correction down to the 2114-2120 region. I suspect we will see that tomorrow morning.”
Now, all the excitement and huge swings in the market has taken place overnight. But this morning, we have not even reached the 2120 area yet and we are down only 16 SPX points in the first few minutes. In my book this is telling me we will most likely see a post election rally followed by a Santa Claus rally into the new year well above 2200 SPX.
Be careful out there… Wall Street looking to find a spot to sell/short.
Maybe the Fed will now start to normalize rates.
I believe the bubble must pop… cleanse, shake out and then rebuild for the new growth. After all this market is still way overvalued!
Trump has a great deal to do and get put into law. It will not be easy and may take some time. That will not begin until Jan 20th. The markets want everything done in a day and that is impossible.
Good morning Joe. I hope all those Remy Martins are not giving you a head ache today. I celebrate with you the victory of President-Elect Trump.
The bubble will burst. I suspect it will be in the 1st or 2nd quarter of 2017. Trump will get the blame, of course. But I also believe after the burst of the stock markets, the US economy will begin to revive and the markets will recover. I am going to have all my ammo ready for SPX 667 to buy as much as I can and then retire watching it grow for the final years of my life.
I did drink too much and I do still have a headache. But it was worth it.
It’s always the timing… and that continues to be the issue with me. I suspect we will know within a week or two, if it starts in 2016.
I know those headaches all too well. Fortunately for me I am safe at home because unlike me, my wife is a teetotaler. So I save my bourbon and coke for the mountains when I can relax and watch the stars of God’s good creation.
Enjoy the day and give thanks for the American people.
Low of 2032.1 in futures
Now 2109
Any thoughts would be appreciated.
Overnight trading does not go onto the cash charts. We are not using futures’ pricing either. It looks like we will open about 25 SPX points down which will keep us above the 2100 mark. At this point at least, I believe the Main count remains the main count.
Hey Rod, where would be a good validation point that might confirm the move up?
First of all, it is dangerous to ask me.
Second, look to Lara’s ‘confidence’ point as she has it on t he Main count daily chart at 2154.79.
Appreciate it
So Lara, has the bear market started? Will you be posting an update on what scenario we could be in now? Thanks in advance.
As long as price remains above 1,810.10, then a bull market will remain possible.
It is 10:30pm now and I need to sleep.
Clintons will now be in jail soon!
Congratulations President Elect Trump!!!!!!!
I don’t expect Trump to do all the right things. One thing I expect him to leave the US market alone so that TA can start working predictably again. That would be a great treat for us, traders.
Yes indeed! And I’m wondering, did Trump short this market?
Don’t worry, I did and that puts me in a great position for tomorrow morning.
Very well done Mr Rajesh. May you make much $$$
Mr. Trump is not much of a stock investor. Real Estate is always his focus.
A good point, thanks Joe.
President Trump!!!! *edited: Joe, I’m not going to allow that language here.
So much for the media asking Trump if he will concede if he loses… Hillary won’t concede! *edited: comment partially removed. Also, no violence of any form here please Joe.
This is mind blowing!!!!!!
The Clinton’s are low class with trash!!!!!!
The world will be in a better place without this corrupt classless trash!!!!!
I fully support your right to voice your views Joe.
I will ask that they are voiced in the most polite and decent of terms.
No use of vulgar language please. And remember, there are others here (including myself) who may disagree with you.
Let us all be the very best versions of humanity that we can be. Let us converse with each other about controversial topics with kindness, decency and the best of manners.
Thank you.
Call PA for Trump already you dishonest media!!!!!! 97% of the vote in!
99% in still Trump leading by over 50,000… desperate I guess
Google poll now showing he only needs 6 to win – and most states showing red with serious leads.
Seems will be a landslide as you stated earlier
A very gentle reminder to the membership:
Politics can be rather emotional, and this is a very big day for not only the USA but the rest of us as well.
Discussion is absolutely okay, as long as it is conducted with the best possible of manners, always very civil and polite. My standards are exceptionally high, and to date they are always met.
FWIW as a woman I could not support Trump. I have female relatives in Texas who will have their lived impacted by this decision, either way.
I know some members do support Trump and that is absolutely okay.
Discuss away.
An updated idea for primary 2. This is why I left the invalidation point at 1,810.10.
The fat lady hasn’t sung yet. For that bear wave count to be confirmed it needs a new low below 1,810.10.
Primary 2 could still be moving lower as a double zigzag.
The teal channel is copied over from weekly and monthly charts. If price is still in a bull market then it really should find strong support at that trend line. A breach of that line would be a big warning that the bear may be here.
Thank you Lara for the timely update. You are a good teacher as I was just thinking about the same possibility. If it turns out to be correct, tomorrow will be one heck of a buying opportunity.
Very exciting and anxious times for my country.
Whoever gets in is very likely cursed imho. It’s almost an impossible job to turn things around – EW is not predicting the long term will be an easy ride and whoever is in the White House will be blamed despite this being years in the making.
I’d rather social mood didn’t bring about WW3 though, so to me Trump is likely the better candidate in that regard. Clinton’s track record as Sec of State seriously worries me.
My general feeling is to go with anyone that the establishment hates as they rarely have anyones interests other than their own in mind.
that’s true, the foreign policy of Clinton would be awful for the rest of the world
only, I’m not so sure that Trump will be much better TBH. That remains to be seen….
The wee little NZ media reported yesterday that real estate searches from the USA for NZ property were up by 147%.
We may see more of you over here soon 🙂
“Canada’s immigration website crashes as Trump’s chances rise”
“As the odds of a Donald Trump presidency rose late Tuesday night, more Americans appeared to be looking for a way out. Literally. Canada’s immigration website crashed repeatedly, apparently from a surge in traffic.
The site first went down around 10:30 p.m. Eastern, and was functioning only intermittently after that. As of 12:30 a.m. Eastern, the site was back up.”
http://www.marketwatch.com/story/canadas-immigration-website-crashes-as-trumps-chances-rise-2016-11-08
Mr. Trump is not keen on war. That makes him different than Sect. Clinton who used the CIA to destabilize Lybia and Syria. I am sick of my country being involved in constant war. So I hope to have a President who will keep us out of such conflict.
I really hope you’re right Rodney. I hope he does recall all the US troops and stop making war. Pretty sure the world will be better off, and if some areas aren’t then that will be their issue to deal with.
But there’s an assumption here that Trump will do what he says he will do. I’m not sure I’d trust him.
Hello everybody, good to see you back Olga and Doc.
I’ll be joining you in the celebrations by opening up a bottle of bubbles shortly Joe.
I’ll be celebrating this market finally trending, and the probability of the bear increasing. I think it is long overdue for a wash out for this over hyped over inflated beast.
So six first and second waves eh. Now in the middle of one whopper of a third wave.
And this is all within either primary 1 or cycle I (if I move everything up one degree).
The bull isn’t completely dead though…. I have an idea I’ll work on and post a chart soon
New York Times just stated Trump’s chance of winning is 91%
Live BBC coverage in UK also now siding with Trump – just like they did when Brexit started swaying toward leave. They have no shame in jumping on the side of the person they have trashed for the last 6 months
Not sure the overweight lady is singing just yet – but the people have spoken.
But you are correct in that it is not over. Sect. Clinton could still win. In fact, several analyst are saying her road is still easier than that of Trump. All I know is that he is ahead and more than half way to the finish line.
No Way she wins!!!!! Its over… Honesty and Truth wins! God is Good!!!!!
Well, if the Cubbies and the Irish can do it so can Trump.
I don’t understand why they won’t call Florida for Trump! With more than 95% in.
NC called for Trump!
WOW! Joe you called it and one of our Davids shorted it. Good to you both.
At the moment DJI futures are down over 600 points and the SPX at 86 or a 4% drop. WOW.
And Hello to you Olga. Good to know you are well.
Lara still hasn’t changed the other David to David H.
I told you folks Trump in a Landslide!!!!!!!
The elites take it UP THE ASS!!!!!
Gotta say – it’s feeling alot like the Brexit results coming in all over again – very exciting!! Was proud of the Brits that night for going against the status quo (and very surprised).
Will be awake all night checking it out – whatever the result, the tide is turning.
BTW – Hi to you, Lara, Verne, Rodney, Doc et al – don’t post much atm as still SOH as far as the S&P is concerned but still lurk and read the comments. I don’t like to express an opinion unless I at least have some skin in the game 🙂
Still plenty of scores to settle with Mr M 🙂
The America Middle Class has awaken!!!
It took a Blue Collar Billionaire born in Queens NY to communicate how they were getting screwed by the Elites. Since I was born and raised in Brooklyn, NY and living in NJ … I understood him perfectly! Because he is just like me and talks like me.. minus the Billions though.
UK had their Independence and Now we have our 2nd Independence Day!
The Globalists can F..K Off!!!!
What amazes me is that the Media will NOT call any of these States for Trump!!! Unbelievable!!!!
If it was anyone else this would have been call already!!!!
Its like they can’t believe what they are seeing!!! It’s REAL!!!!
Media was the same over Brexit – even Farage thought he’d lost.
Just shows how absolutely rotten to the core the whole system is. The media is as corrupt as the politicians.
Olga… I have been drinking Remy Martins for three hours now and just cracked open another bottle. So let me Apologize now for anything I may say in a few hours.
WikiLeaks proved how corrupt the government & the media is… all of that was an eye opener for many! The Truth always comes out!
Trump will… Drain the swamp in DC!!!
LoL – no worries. I’m on the red wine 🙂
Hi Olga,, look at those futures, oh my
Oh… yes sir!
I may be SOH with S&P but heavily invested in PM’s – check out those lovely candlesticks lol 🙂
Looks to me like the bubble will finally pop!
It took from Jan of 1981 to August of 1982 for Reagans growth programs to take effect and start the greatest bull market ever… I would expect something similar for Trumps to kick in!
Problem is that its a long way down to cleanse before it starts.