
Downwards movement was expected for the main Elliott wave count, but it was noted that volume strongly suggested some more upwards movement for Thursday’s session.
Summary: Downwards movement should continue from here with lower lows and lower highs. A mid term target is 1,912.
Last published monthly charts are here.
New updates to this analysis are in bold.
BEAR ELLIOTT WAVE COUNT
WEEKLY CHART
Click chart to enlarge.
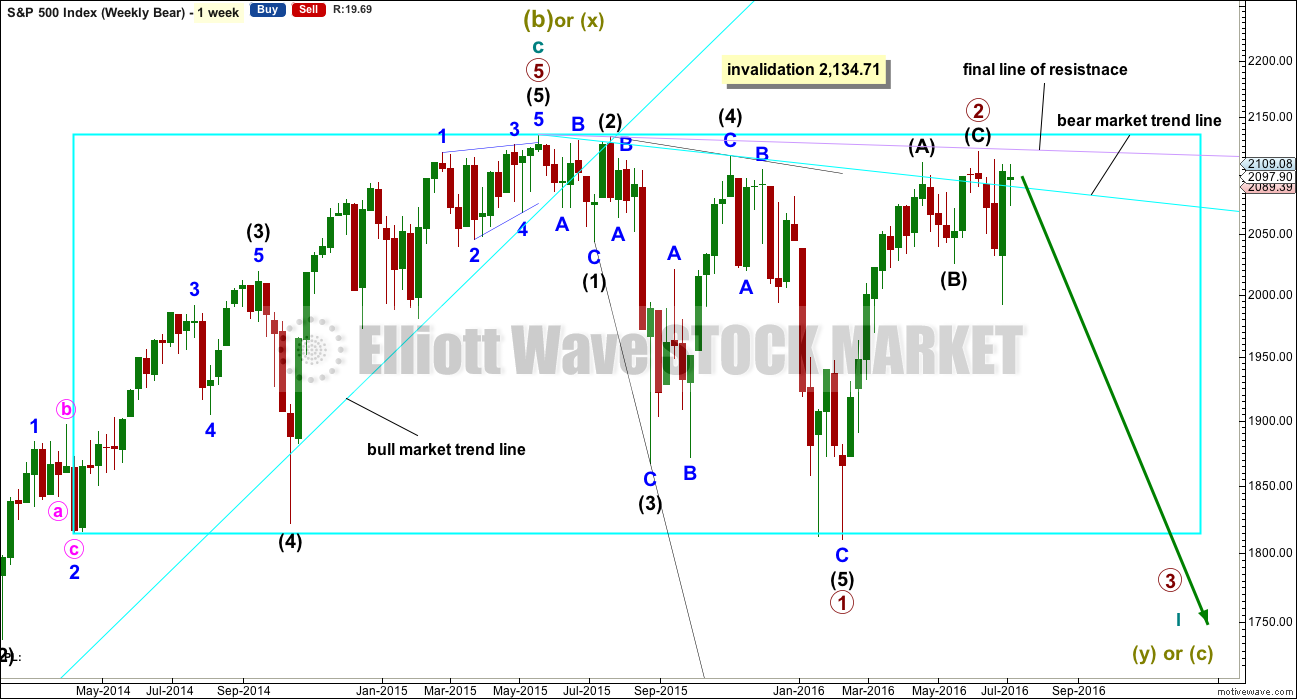
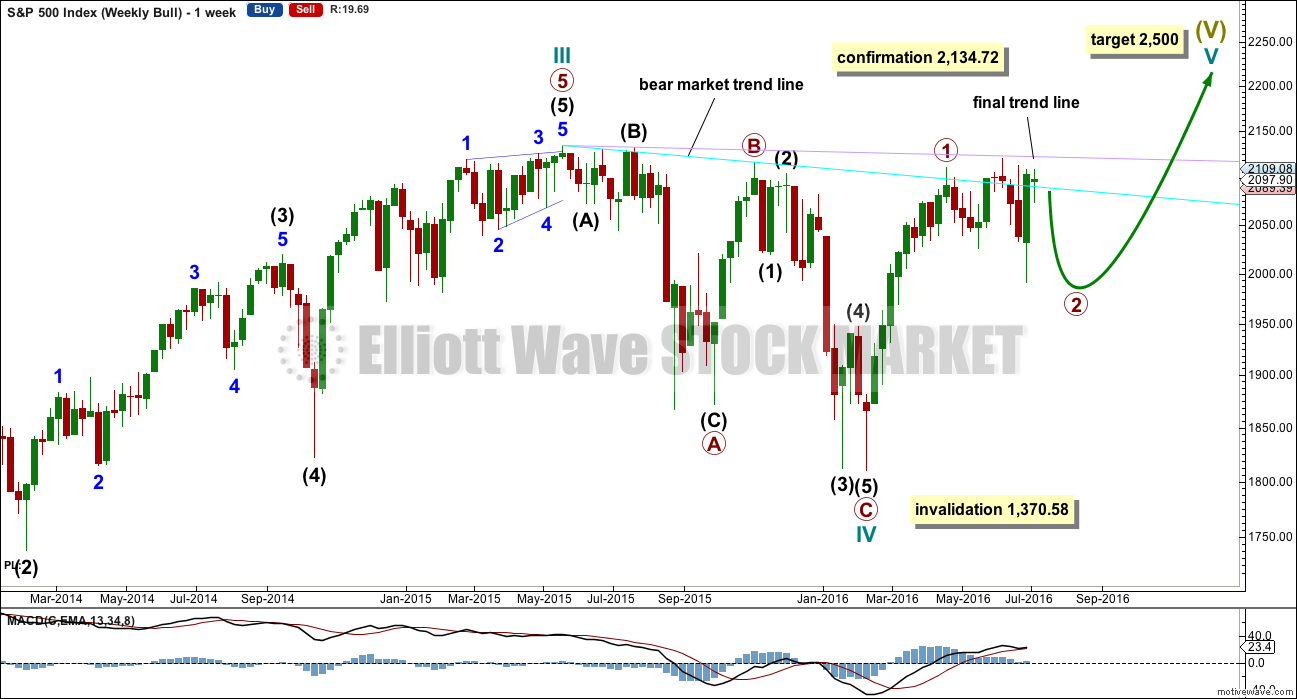
The box is added to the weekly chart. Price has been range bound for months. A breakout will eventually happen. The S&P often forms slow rounding tops, and this looks like what is happening here at a monthly / weekly time frame.
Primary wave 1 is seen as complete as a leading expanding diagonal. Primary wave 2 would be expected to be complete here or very soon indeed.
Leading diagonals are not rare, but they are not very common either. Leading diagonals are more often contracting than expanding. This wave count does not rely on a rare structure, but leading expanding diagonals are not common structures either.
Leading diagonals require sub waves 2 and 4 to be zigzags. Sub waves 1, 3 and 5 are most commonly zigzags but sometimes may appear to be impulses. In this case all subdivisions fit perfectly as zigzags and look like threes on the weekly and daily charts. There are no truncations and no rare structures in this wave count.
The fourth wave must overlap first wave price territory within a diagonal. It may not move beyond the end of the second wave.
Leading diagonals in first wave positions are often followed by very deep second wave corrections. Primary wave 2 would be the most common structure for a second wave, a zigzag, and fits the description of very deep. It may not move beyond the start of primary wave 1 above 2,134.72.
So far it looks like price is finding resistance at the lilac trend line. Price has not managed to break above it. If price continues higher, then look for upwards movement to end again if it comes up to the lilac trend line.
Only two daily wave counts will be published today. All three from yesterday remain valid, but the first alternate no longer has the right look. The main wave count and second alternate will be published today.
MAIN DAILY CHART
Click chart to enlarge.
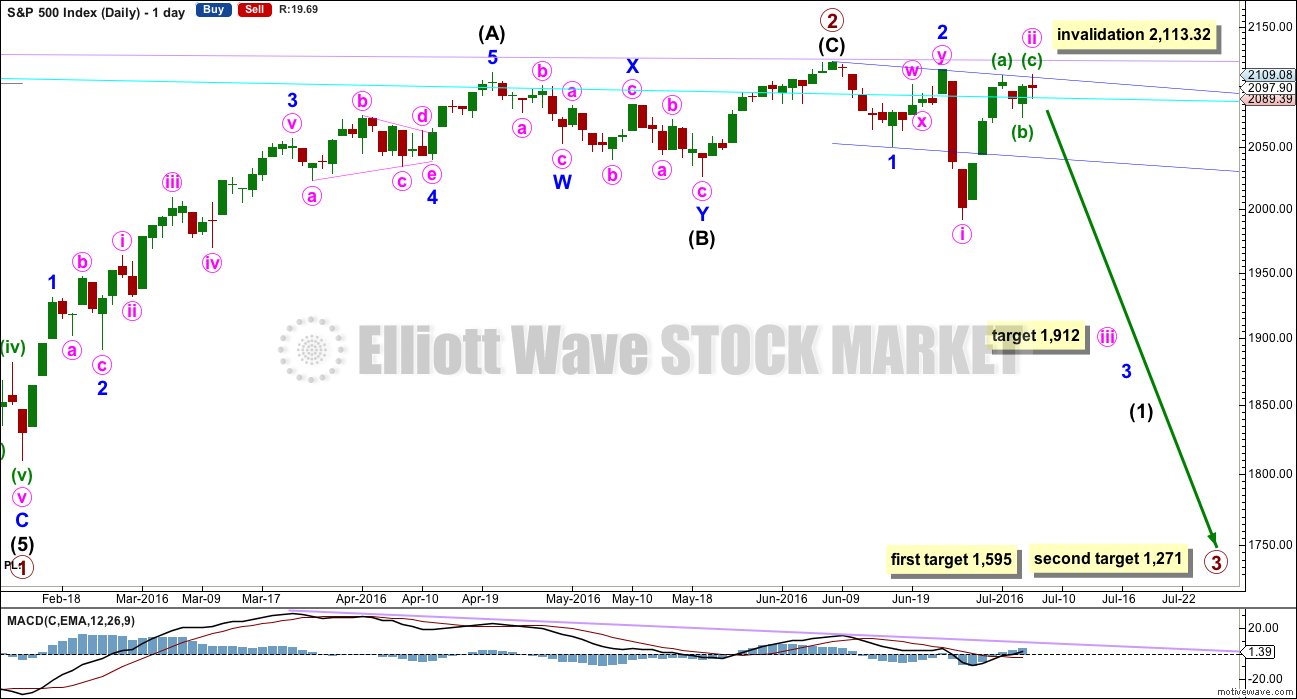
If primary wave 2 was over earlier on 8th of June, then primary wave 3 has begun. At 1,595 primary wave 3 would reach 1.618 the length of primary wave 1. At 1,271 it would reach 2.618 the length of primary wave 1. Primary wave 1 lasted 38 weeks and primary wave 2 lasted 17 weeks. Primary wave 3 may be expected to be longer in length and duration than primary wave 1. In the first instance, a Fibonacci 55 weeks is expected, but maybe also 89 weeks is possible.
Within primary wave 3, intermediate wave (1) may be incomplete. It may have begun with a series of two overlapping first and second waves for minor waves 1 and 2 then minute waves i and ii. This indicates minor wave 3 may be extending, which is common.
Within the middle of intermediate wave (1), a mid term target for minute wave iii is at 1,912 where it would reach 1.618 the length of minute wave i.
Minute wave ii may not move beyond the start of minute wave i above 2,113.32.
Minute wave ii today has a clear three wave look to it on the daily chart.
A base channel is added in blue to minor waves 1 and 2. Minute wave ii is finding resistance at the upper edge of this base channel.
HOURLY CHART
Click chart to enlarge.
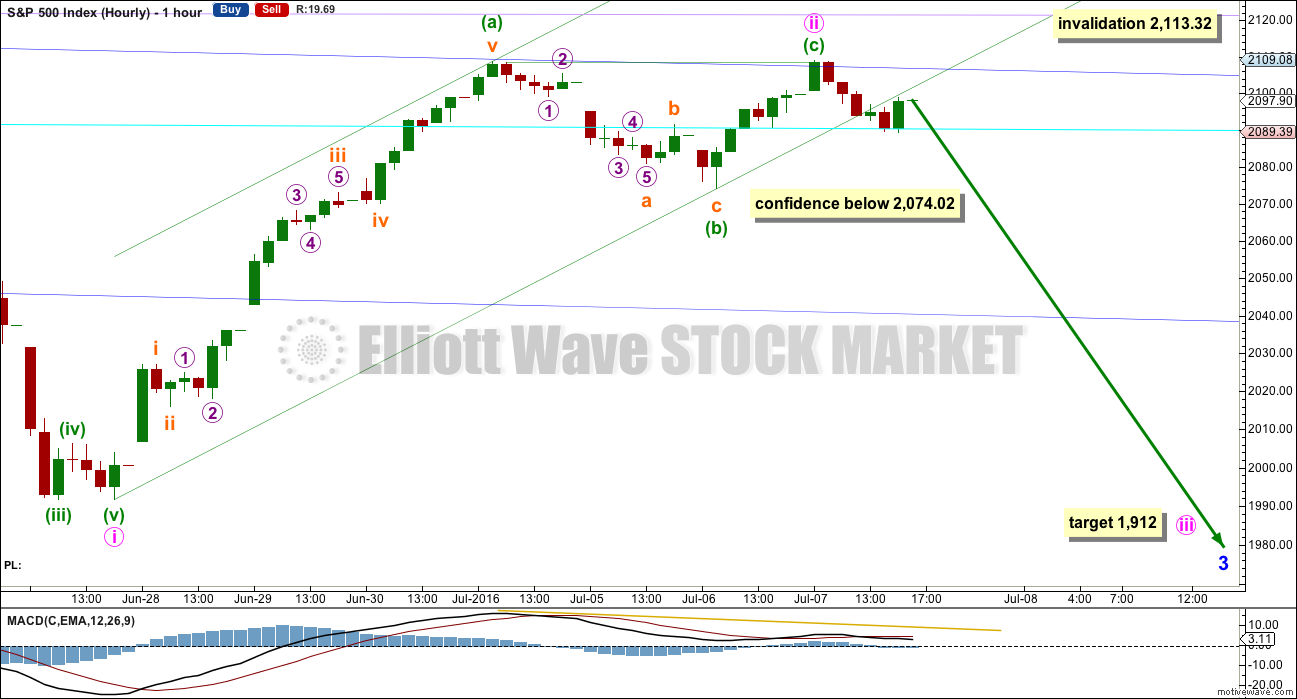
At 1,912 minute wave iii would reach 1.618 the length of minute wave i.
Minute wave ii fits as a zigzag on the five minute chart. There is no Fibonacci ratio between minuette waves (a) and (c).
A green channel is drawn about the zigzag of minute wave ii. At the end of Thursday’s session, price has broken below the lower edge of this channel providing earliest indication that minute wave ii may be over. Upwards movement is finding resistance at the lower edge of this channel for so far what looks like a typical throwback.
Price is finding support at the cyan trend line again. If this line is breached tomorrow, then expect to again provide resistance.
A new low below 2,074.02 could not be a second wave correction within minuette wave (c), so at that stage minuette wave (c) would have to be over. This would provide earliest price confidence that upwards movement is over and was a three wave structure.
After the lower edge of the dark blue base channel is breached, then expect it to provide resistance. First it may provide some support.
SECOND ALTERNATE DAILY CHART
Click chart to enlarge.
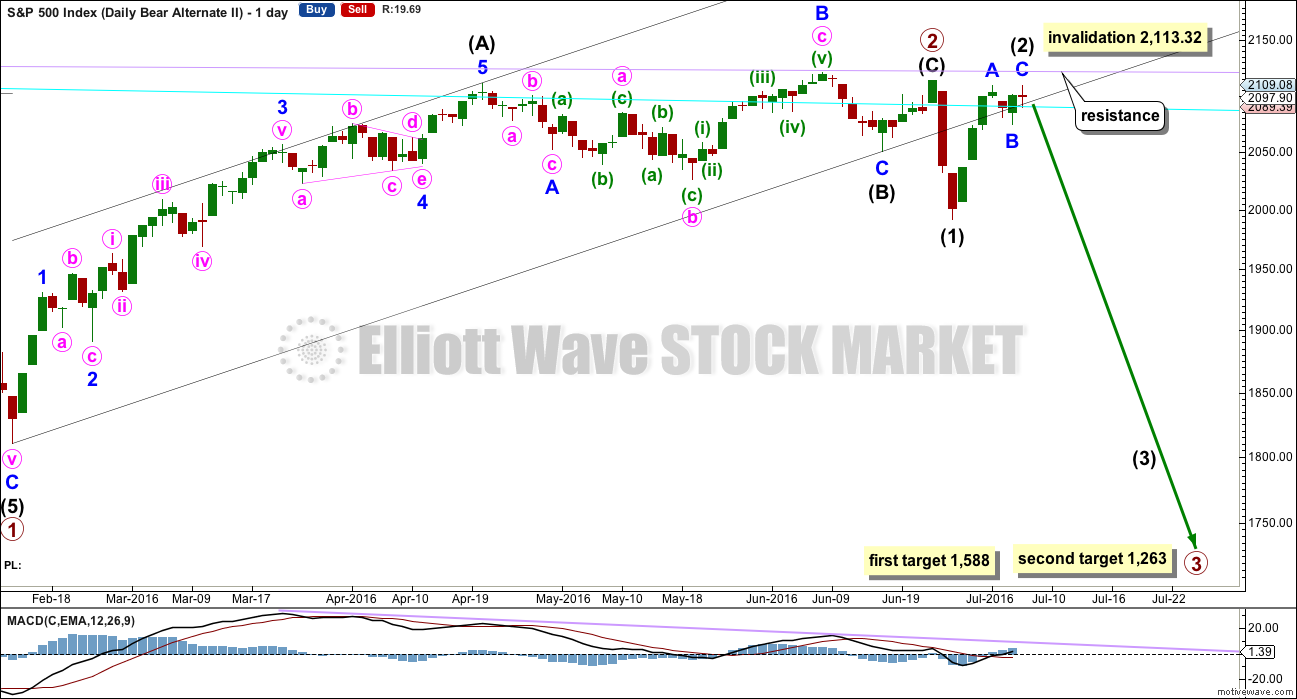
Primary wave 2 may have ended on 23rd of June. Primary wave 3 may have begun there.
Within primary wave 3, intermediate wave (1) may be complete. Intermediate wave (2) is now a clearer three wave structure. There is almost no room left for it to move in, so it is highly likely today to be over.
This wave count does not look right with the channel about primary wave 2. If that channel is correctly drawn, then intermediate wave (2) would most likely have ended when price came up to touch the lower edge for a typical throwback after a breach.
At 1,588 primary wave 3 would reach 1.618 the length of primary wave 1. At 1,263 primary wave 3 would reach 2.618 the length of primary wave 1. The lower target is more likely because primary wave 2 was very deep.
Intermediate wave (2) may not move beyond the start of intermediate wave (1) above 2,113.32.
BULL ELLIOTT WAVE COUNT
WEEKLY CHART
Click chart to enlarge.
Cycle wave IV is seen as a complete flat correction. Within cycle wave IV, primary wave C is still seen as a five wave impulse.
Intermediate wave (3) has a strong three wave look to it on the weekly and daily charts. For the S&P, a large wave like this one at intermediate degree should look like an impulse at higher time frames. The three wave look substantially reduces the probability of this wave count. Subdivisions have been checked on the hourly chart, which will fit.
Cycle wave II was a shallow 0.41 zigzag lasting three months. Cycle wave IV may be a complete shallow 0.19 regular flat correction, exhibiting some alternation with cycle wave II and lasting nine months. Cycle wave IV would be grossly disproportionate to cycle wave II, and would have to move substantially out of a trend channel on the monthly chart, for it to continue further sideways as a double flat, triangle or combination. For this reason, although it is possible, it looks less likely that cycle wave IV would continue further. It should be over at the low as labelled.
At 2,500 cycle wave V would reach equality in length with cycle wave I.
Price has now broken a little above the bear market trend line. This line is drawn from the all time high at 2,134.72 to the swing high labelled primary wave B at 2,116.48 on November 2015. This line is drawn using the approach outlined by Magee in the classic “Technical Analysis of Stock Trends”. To use it correctly we should assume that a bear market remains intact until this line is breached by a close of 3% or more of market value. Now that the line is breached, the price point at which it is breached is calculated about 2,093.58. 3% of market value above this line would be 2,156.38, which would be above the all time high and the confirmation point.
This wave count requires price confirmation with a new all time high above 2,134.72.
While price has not made a new high, while it remains below the final trend line (lilac) and while technical indicators point to weakness in upwards movement, this very bullish wave count comes with a strong caveat. I still do not have confidence in it. It is produced as an alternate, because all possibilities must be considered. Price managed to keep making new highs for years on light and declining volume, so it is possible that this pattern may continue to new all time highs for cycle wave V.
The invalidation point will remain on the weekly chart at 1,370.58. Cycle wave IV may not move into cycle wave I price territory.
This invalidation point allows for the possibility that cycle wave IV may not be complete and may continue sideways for another one to two years as a double flat or double combination. Because both double flats and double combinations are both sideways movements, a new low substantially below the end of primary wave C at 1,810.10 should see this wave count discarded on the basis of a very low probability long before price makes a new low below 1,370.58.
DAILY CHART
Click chart to enlarge.
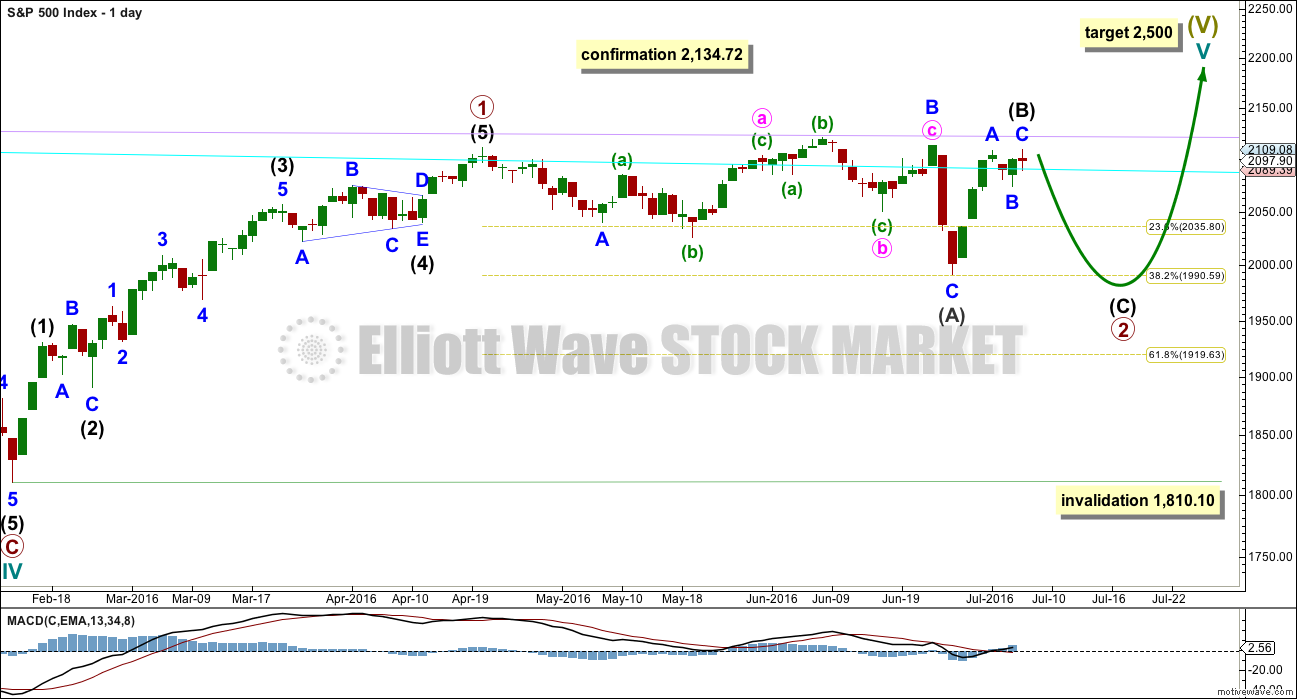
While primary wave 2 may be a complete regular flat correction over at the low of intermediate wave (A), with continuing weakness to upwards movement and price remaining range bound, it looks like for a bull wave count primary wave 2 may not be over.
Primary wave 2 may be continuing sideways as a longer lasting flat, with intermediate wave (A) a complete three and now intermediate wave (B) also a complete three. Intermediate wave (C) may end slightly below the end of intermediate wave (A) at 1,991.68 to avoid a truncation.
Intermediate wave (B) may now be complete; it is a clearer three wave structure.
Primary wave 2 may not move beyond the start of primary wave 1 at 1,810.10.
TECHNICAL ANALYSIS
DAILY CHART
Click chart to enlarge. Chart courtesy of StockCharts.com.
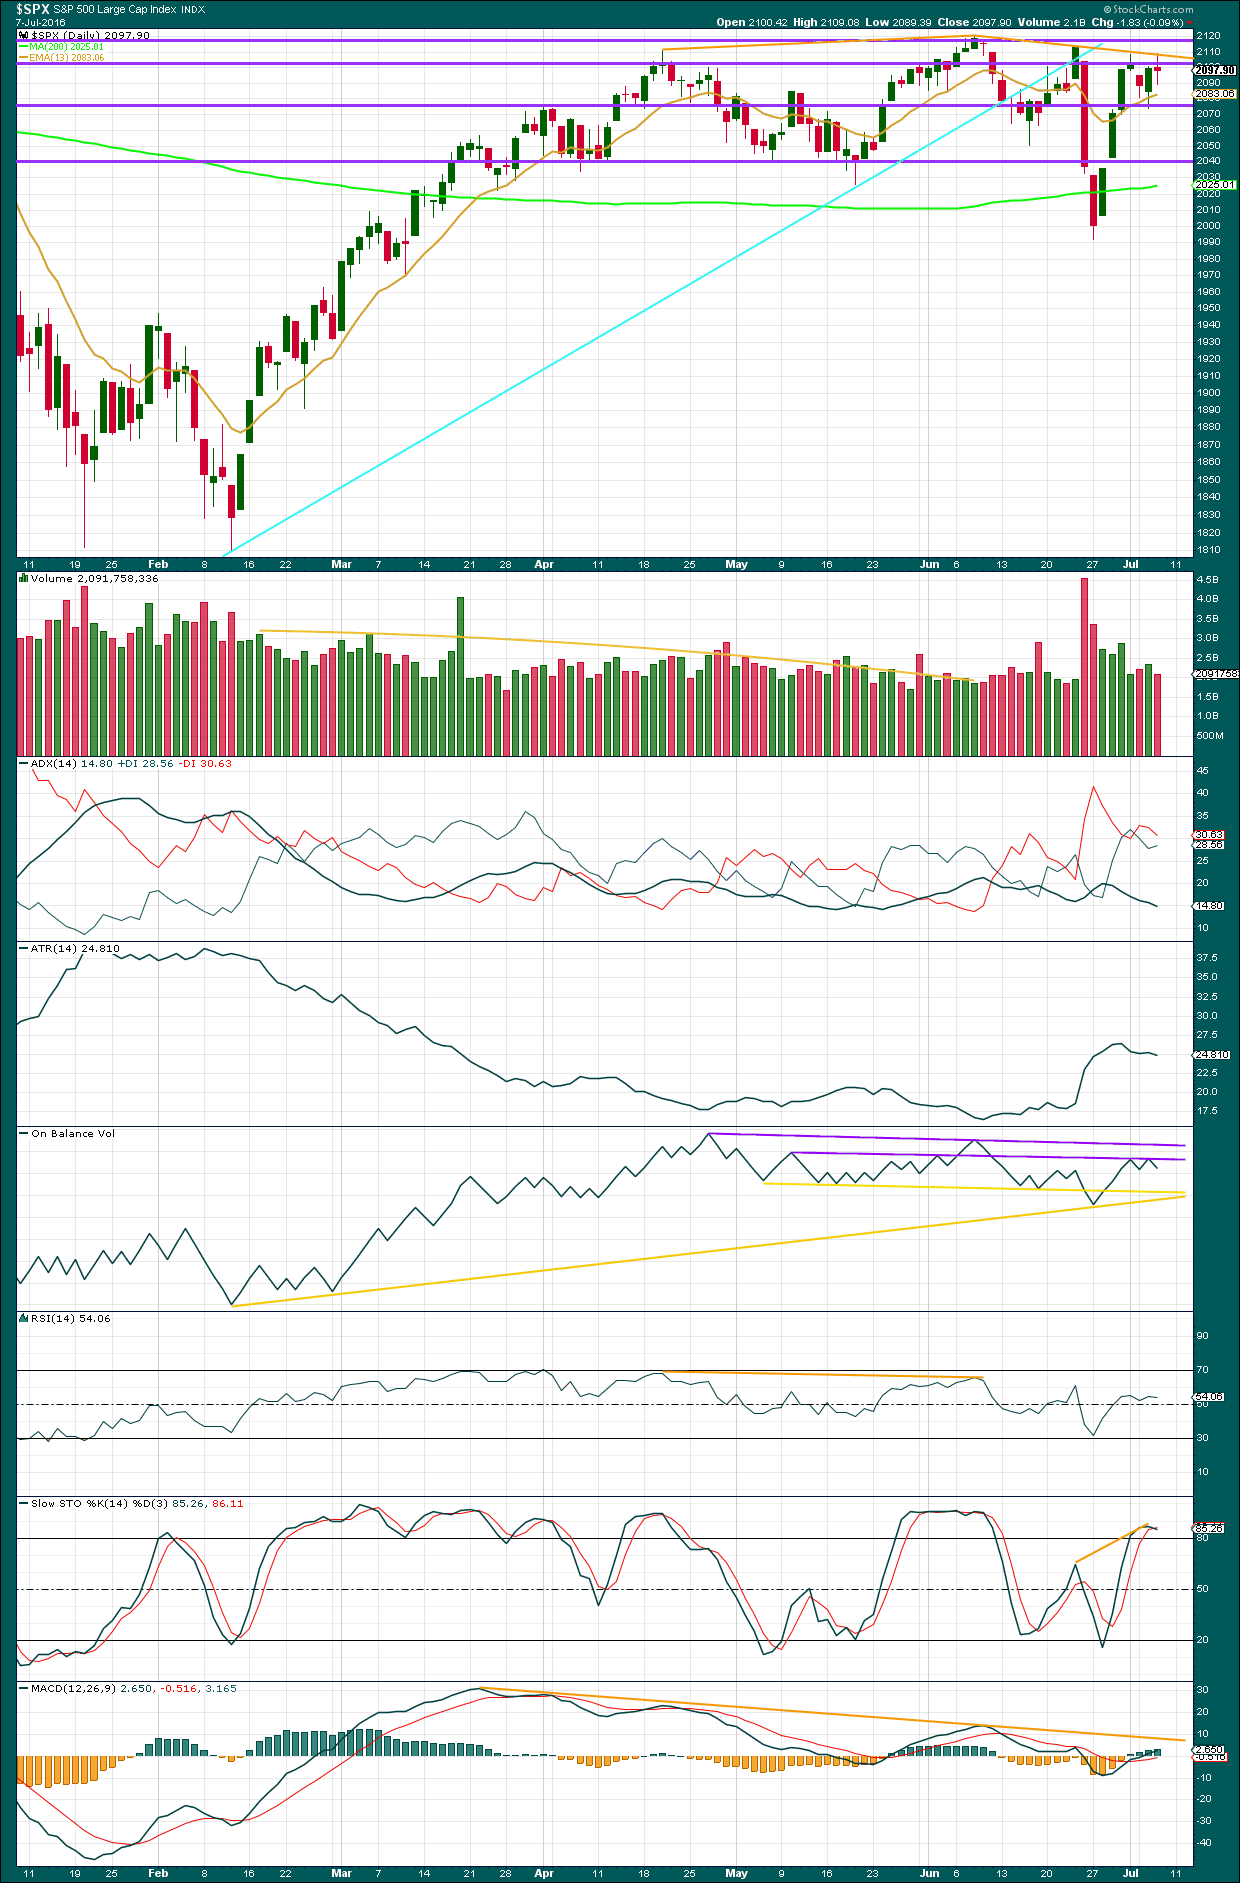
Thursday’s candlestick is a spinning top, representing a balance between bulls and bears. This indicates the trend may have changed from up to neutral.
Overall, the bears were slightly more in charge during Thursday than bulls as the colour of the candlestick is red. Volume did not support the slight fall in price though as it is lighter than the prior upwards day. This gives some cause for concern for the Elliott wave count, but in conjunction with a spinning top candlestick for the session the concern is only slight.
ADX is still declining indicating the market is consolidating. Price is range bound between about 2,120 above and 2,040 below. During this range bound movement, which began back in the end of March, it is three downwards days of 29th of April, 24th of June, and 27th of June which have strongest volume. This suggests a downwards breakout is more likely than an upwards breakout.
ATR is overall flat, mostly in agreement at this time with ADX. The market is consolidating.
On Balance Volume came up to find resistance at the first purple trend line again, and has today turned down from that line. This gives a weak bearish signal today from OBV.
RSI is neutral. There is plenty of room for price to rise or fall. Price and RSI showed bearish divergence at the last major high at 2,120 on 8th of June. Price has made lower lows and lower highs since that high. That bearish divergence was followed by reasonable downwards movement.
Stochastics shows some divergence today with price still. Between the two highs from 23rd June to 1st July, price has made a lower high while Stochastics has made a higher high. This is hidden bearish divergence and indicates weakness in price.
MACD also exhibits divergence with price at the two highs on 20th of April and 8th of June. MACD failed to make corresponding highs as price made new highs, indicating weakness to upwards movement. MACD may be held down by this trend line extended outwards.
VOLATILITY – INVERTED VIX MONTHLY CHART
Click chart to enlarge. Chart courtesy of StockCharts.com.
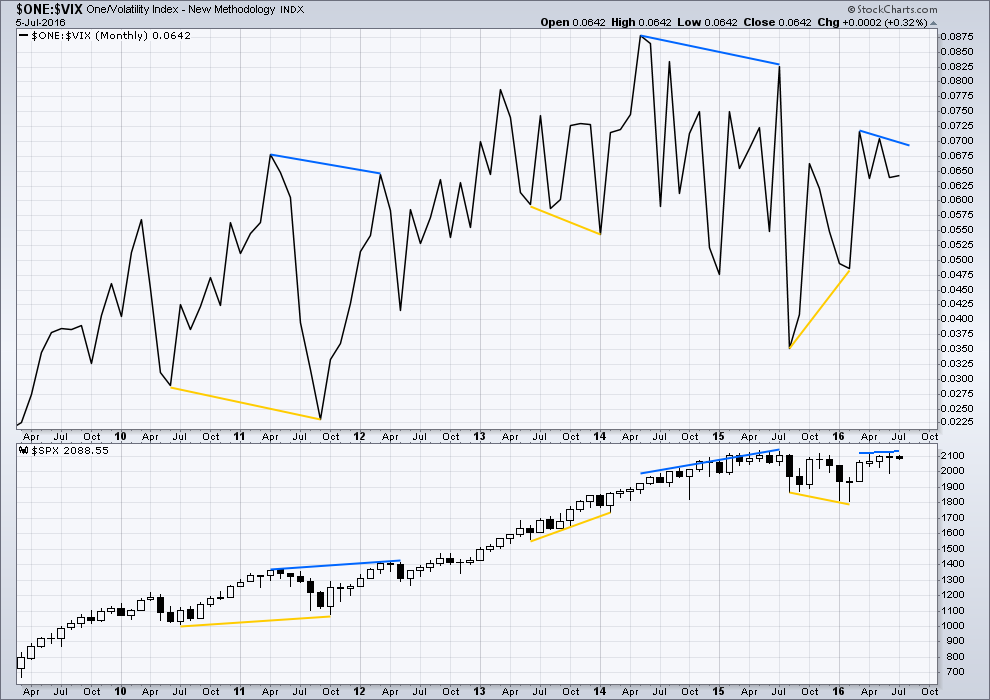
Several instances of large divergence between price and VIX (inverted) are noted here. Blue is bearish divergence and yellow is bullish divergence (rather than red and green, for our colour blind members).
Volatility declines as inverted VIX rises, which is normal for a bull market. Volatility increases as inverted VIX declines, which is normal for a bear market. Each time there is strong multi month divergence between price and VIX, it was followed by a strong movement from price: bearish divergence was followed by a fall in price and bullish divergence was followed by a rise in price.
There is still current multi month divergence between price and VIX: from the high in April 2016 price has made new highs but VIX has failed so far to follow with new highs. This regular bearish divergence still indicates weakness in price.
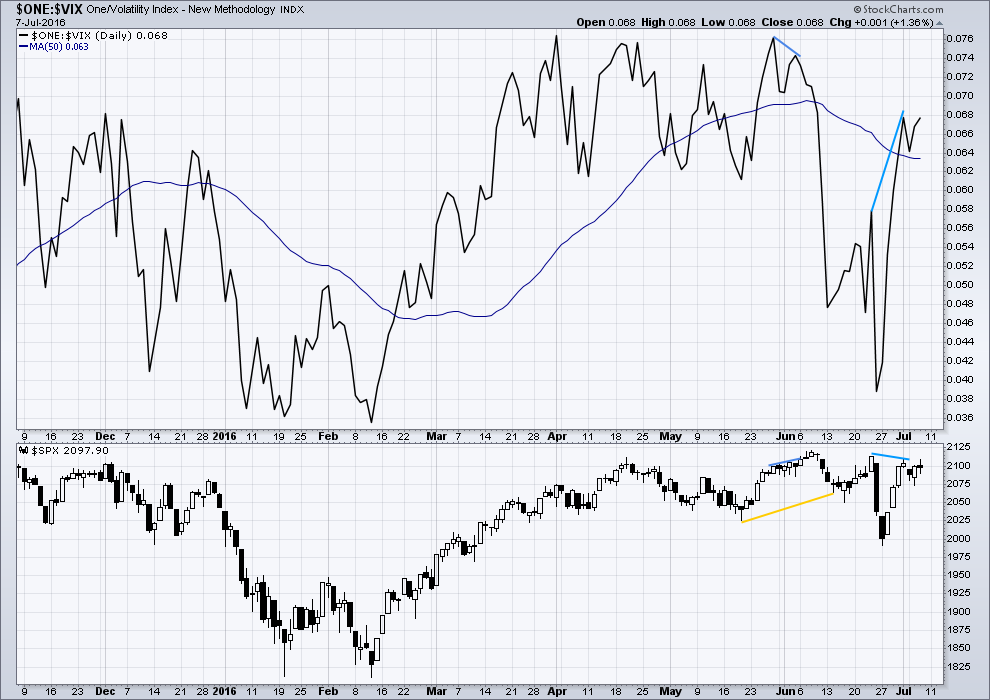
VOLATILITY – INVERTED VIX DAILY CHART
Click chart to enlarge. Chart courtesy of StockCharts.com.
VIX from StockCharts is inverted. As price moves higher, inverted VIX should also move higher indicating a decline in volatility which is normal as price moves higher. As price moves lower, inverted VIX should also move lower indicating an increase in volatility which is normal with falling price.
As price moved higher last week for four days in a row, inverted VIX moved strongly higher. Volatility declined last week to a point which was lower than at the last swing high on 23rd of June. This is hidden bearish divergence and indicates weakness in price.
I would give a lot of weight to price and VIX. It is usually a reliable guide to an impending trend change. So far, following this strong divergence between price and VIX, price has barely fallen. More downwards movement should still be expected to follow this divergence.
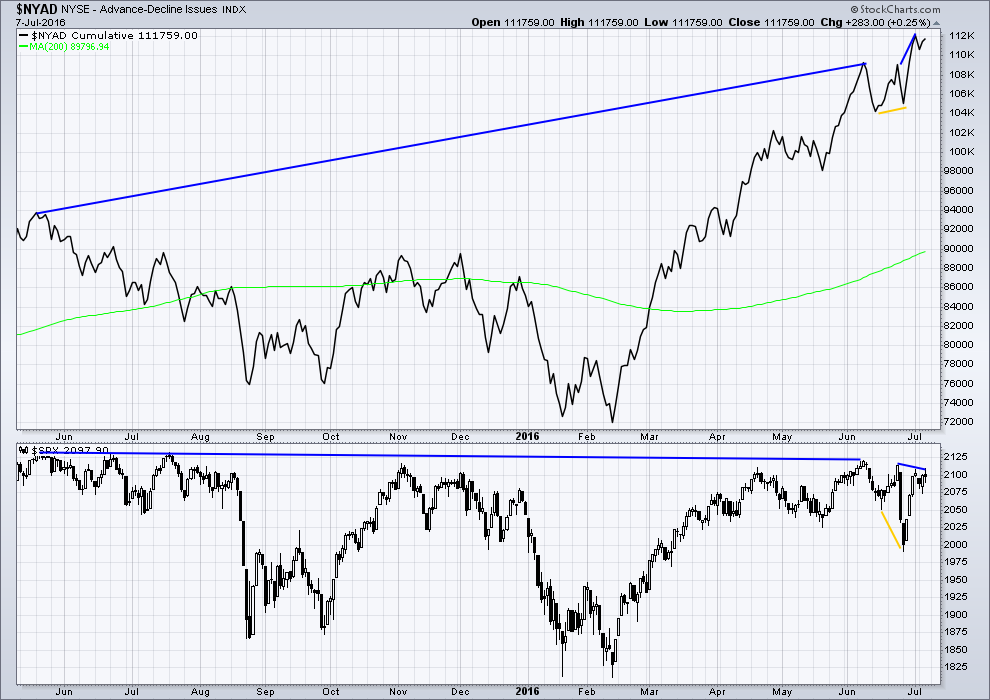
BREADTH – ADVANCE DECLINE LINE
Click chart to enlarge. Chart courtesy of StockCharts.com.
With the AD line increasing, this indicates the number of advancing stocks exceeds the number of declining stocks. This indicates that there is breadth to prior upwards movement.
Taking a look at the bigger picture, the AD line is making substantial new highs but price so far has not. While market breadth is increasing beyond the point it was at in May 2015, this has not translated (yet) into a corresponding rise in price. Price is weak. This is hidden bearish divergence (long blue lines).
There is divergence between price and the AD line indicated by short yellow lines. Price made new lows but the AD line failed to make corresponding new lows. This indicates some weakness to downwards movement from price. Upwards movement over four days may be enough to resolve this bullish divergence.
The AD line has now made a new high above its prior high of 23rd of June yet price has not made a corresponding new high (short blue lines). This divergence now is bearish. It indicates that price is weak.
DOW THEORY
The last major lows within the bull market are noted below. Both the industrials and transportation indicies have closed below these price points on a daily closing basis; original Dow Theory has confirmed a bear market. By adding in the S&P500 and Nasdaq a modified Dow Theory has not confirmed a new bear market.
Within the new bear market, major highs are noted. For original Dow Theory to confirm the end of the current bear market and the start of a new bull market, the transportation index needs to confirm. It has not done so yet.
Major lows within the prior bull market:
DJIA: 15,855.12 (15th October, 2014) – closed below on 25th August, 2015.
DJT: 7,700.49 (12th October, 2014) – closed below on 24th August, 2015.
S&P500: 1,821.61 (15th October, 2014) – has not closed below this point yet.
Nasdaq: 4,117.84 (15th October, 2014) – has not closed below this point yet.
Major highs within the new bear market:
DJIA: 17,977.85 (4th November, 2015) – closed above on 18th April, 2016.
DJT: 8,358.20 (20th November, 2015) – has not closed above this point yet.
S&P500: 2,116.48 (3rd Nobember, 2015) – has now closed above this point on 8th June, 2016.
Nasdaq: 5,176.77 (2nd December, 2015) – has not closed above this point yet.
It is a reasonable conclusion that the indices are currently in a bear market. The trend remains the same until proven otherwise. Dow Theory is one of the oldest and simplest of all technical analysis methods. It is often accused of being late because it requires huge price movements to confirm a change from bull to bear. In this instance, it is interesting that so many analysts remain bullish while Dow Theory has confirmed a bear market. It is my personal opinion that Dow Theory should not be accused of being late as it seems to be ignored when it does not give the conclusion so many analysts want to see.
This analysis is published @ 09:05 p.m. EST.
The Government has rejected a call for a second referendum after 4.1 million people signed a petition following the Brexit vote.
Yay! What was they thinking best of three?
Will this add any more weight to the markets I wonder!
That’s actually good to hear for democracy.
When the people have the opportunity to make their views and wishes known, the politicians need to listen. Especially when they don’t like the answer.
In New Zealand our politicians ignore the results from Citizen Initiated Referendum when they don’t like the results.
The main reason was that four million was not really four million. A number of “signatures” came from outside the UK, including some places where there are no people!
Yes they had no form of verification on the signature form! Not even a simple captcha, spam bot signatures….
Logged in for a quick peak, reading all below felt like I just got done reading ‘War and Peace’. : )
My TA: -Bear, Roar.
This would be the second 99% second wave we have seen this year if you are right Peter…. 🙂
LOL
We need the next analysis published…. Cesar’s proofing it now. I did finish but too late last night for him to proof for me.
My grammar is horrible, you’d be amused maybe Verne how bad it can be.
Anyway… going through some more charts and data on BarChart and StockChart, looking at more measures of strength to this market, this morning I am struggling to find much bullishness.
I noticed this from Bullish Percent on StockCharts. Triple negative divergence. As a measure of market breadth it’s quite telling.
He au kei uta e taea te karo, he au kei te moana e kore e taea.
It is certainly doing its job as a second wave…just listen to us!! 🙂
IKR!
A couple of weeks ago before the Brexit vote sentiment was not extremely bullish.
Now it is.
The rebound after the fall of price from Brexit has turned the majority very bullish. New all time highs are a certainty… apparently.
Let us see what Mr Market has to say about that on Monday.
Messing around with SPX Monthly with Pitchforks… What if?
(Either heads up the long established channel or heads down if it confirms a newly formed channel.)
http://stockcharts.com/h-sc/ui?s=%24SPX&p=M&b=5&g=0&id=p19569909111&a=466762968
P.S. It also might have started up a newly formed green channel.
Interesting that this last week’s movement helped complete the structure of a potential new bearish fork…not that this alone contributes to the bearish case, but just interesting. Thanks for posting.
It would be interesting to see how close to the outer tine the 2100 pivot falls…
If I did it right, 2100 Pivot the yellow line…
If it follows down the outer red line then October 3rd looks like when all the cross roads meet. Interestingly, those in the know geopolitical and economically are suggesting the “Fall” will happen in the fall.
I would imagine the powers-at-be would not want to see it happen until after the presidential election in November…
Interesting. Crashes have often come in the Fall, October being a favorite month. I expect that crash, if it takes place, would come in the form of a intermediate three of a primary three wave down. It does make one wonder about whether we are a bit ahead of the programme…I guess we could get an intermediate one of three down starting now, followed by a deep, protracted intermediate wave two , both lasting a few months…
Yes indeed, we could.
If primary 2 is 99% of primary 1 then it would seem reasonable to expect intermediate (2) to be very deep also.
Nice view of the VIX…
https://www.tradingview.com/chart/VIX/DAT7Z2MB-THIS-WEEK-IT-COULD-HELP-US/
The economics of the world is bad…
The Stresses of unsustainable debt is clearly evident…
Corporate Profit Margins have peaked and are contracting…
Revenue Growth has been stagnant to trending down for a couple of years and the revenue declines are accelerating…
Commodities have been and are in a deflationary period…
Many other markets have peaked and are trending down…
Etc., Etc. I can add another 10 to 15+ items but won’t bore you.
Nothing is signaling that to you more, that all the above is true, than the
30 Year US Treasury Bonds path to a current 2.101% Yield and possibly Sub 2% very soon. That’s 30 Year Paper Folks… 30 Years to maturity at a 2%ish or maybe soon SUB 2%!!!!!
How all that above can occur with in conjunction with New ATH’s and any of the EW Bull Counts… is Beyond Explanation and is mind blowing!
I hear John Maynard Keynes quoting from the grave “The market can stay irrational longer than you can stay solvent.” Hayek will have the last say in the end! 🙂 See video below for a delightful watch!
“Fight of the Century”: Keynes vs. Hayek Rap Battle Round Two
https://www.youtube.com/watch?v=GTQnarzmTOc
Yes… That is True until it isn’t true any longer.
The markets staying irrational for longer has been going on since 2011… that is now more than 5 years!
What is also True is that when it finally comes to an end you are looking at a crash… 20% to 30% down in one day! But this time it will continue to fad lower to finally break that buy and hold mentality of the last 50 to 80 years.
John Maynard Keynes theories of economics have been a complete failure! What he created is what is about to BLOW-UP!
Granted the CB and endlessly infuse the markets with liquidity, what is truly a mystery is that bullish sentiment continues to permit them to do so with great effect. Price action clearly confirms that folk are still bullish.
I was talking with a good trader I know and while I expect to be stopped out often when using a scalping approach to the market, he opined that if you are being frequently stopped out of trades before reaching your profit target it may be that the trend is not what you think it is. I mention this since a few folk on the forum have mentioned how frequently they have been stopped out of trades. I remain an agnostic for the moment. I almost wish we would get the new ATH over with if that is what is in store. I am not at all convinced a mere pullback next week will be sufficient to re-establish the greater bearish case. It seems folk on the forum are just about equally divided on what is coming next.
Here… David Stockman did the math on earnings and puts some of what I am saying into numbers…
“The boys and girls on Wall Street are now riding their bikes with no hands and eyes wide shut. That’s the only way to explain Friday’s lunatic buying spree in response to another jobs report that proves exactly nothing.
When the S&P 500 first hit 2130 back in May 2015, reported LTM earnings were $99.25 per share, and that was already down 6.4% from the cyclical high of $106 per share in September 2014. Thus, stocks were being valued at a nosebleed 21.5X in the face of falling earnings.
During the four quarters since then, reported LTM earnings have slumped by a further 12.3% to $87 per share. So that brings the “cap rate” to 24.5X earnings that have shrunk by 18% over the last six quarters. Wee!”
http://davidstockmanscontracorner.com/wall-street-monkeyshines-look-ma-no-hands/
BTW: That was an excellent video… Highly Recommend it.
At the end…. The media, academics and the political elite completely chose the wrong team!
Before that happens, they are going to do what China did and halt trading. As soon as the CBs learn they cannot arrest water-fall declines with massive cash dumps they are going to resort to authoritarian and arbitrary rules to try and regain control. Of course they will only exacerbate the situation until the market finds its true level. As long as we continue to see these sell-offs result in long lower wicks as the market is bought back into the close to move significantly off the days lows it will be short term bullish imho. Conversely, these cash dumps that issue in big retraces intra-day but still results in a close near the day’s lows is what happens when a decline gets going in earnest in my experience.
Great video! Prophetic. The war-mongers are already looking to fend off the coming deflationary depression by picking a fight with Russia. In addition to the incredible idiocy of putting NATO troops in Russia’s back yard, they have now upped the ante by giving ISIL surface to air missile capability and today shot down a Russian helicopter and killed two Russian pilots. The West is being led by an insane cabal. Anybody followed the story of the treasonous former NATO commander Admiral Breedlove and his agitating for conflict with Russia in Ukraine? You cannot make this stuff up!
As bewildered as you are my friend. TLT moved back below its upper BB and nonetheless posted a new 52 week high. SDS on Friday made a new lifetime low. Granted we have not yet made a new SPX ATH, we are close enough so that sentiment is not completely out of kilter with the price action. It seems to me in this case sentiment is less valuable as a contrary indicator The same is not true of precious metals however, which are seeing multi-year bullish extremes although nowhere near historical highs. Why both bonds and equities are on a tear is an absolute mystery. I have never seen a RTM trade ultimately fail so I continue to think that bonds are close to a reversal. I am quite prepared to accept that I could be wrong and that we are in uncharted waters.
Vern,
More money coming into equities as CME changed the margin requirements for SILVER on Friday and GOLD shouldn’t be far behind.
Usually sign of an impending trend change….but not before at least one more spike up….
I am convinced as to why the 30 Year US Treasury Bond is on a complete tear! Remember Bond money is the smartest money… Always has been and always will be. A certain group is running from something that is about to happen.
But the key here is they usually don’t buy 30 Year Paper if the something that is about to happen is a short term event! It will be a protracted event because the 30 Year UST is the choice! Usually they go 3 months to 5 years max!
Who “they” are and what that “event” is I can’t answer! But it is near!
Conventional wisdom is that declining long term bond rates usually herald sluggish economic activity and will telegraph where short term rates are heading. CBs do not have much control of these longer term rates as they are really set by the so-called bond vigilantes. It also therefore assumed that recessionary forces are necessarily going to result in long term yields continuing to decline. Few are considering what a mounting wave of bond defaults is going to do to this pardigm..
Tim Knight says it is not looking good for Bears except he says the “OBI-WAN KENOBE” predictor Oil is definitely Bearish now.
https://www.tastytrade.com/tt/shows/trading-the-close-with-tim-knight/episodes/trading-the-close-with-tim-knight-07-08-2016
Alcoa and JP Morgan earnings report on 7/11 and 7/14 respectively should prove insightful for a financial industry and industrial industry update.
I dunno. Folk are now so desperate to keep the party going I suspect much of the earnings report is going to be deeply massaged. We know for a fact that top and bottom line corporate earnings have been on the decline since 2014 yet they miraculously continue to beat estimates. Go figure….
Because it’s just Stupid to think that because you beat a “very bad estimate” with “actual bad earnings.. engineered earnings” that things for that company & the markets are wonderful! Look to the Revenue vs Market Cap. to see the real picture.
Just F_ _ _ ing… Stupid. But the markets believe the BIG CON!
That is why I don’t worship price! Years ago when NO Big Con was going on that would be true…. the markets would truly sniff out what is happening and about to happen.
That is NOT true anymore IMO! There is NO LONGER any Real Price Discovery happening!
Point well taken, but when it comes to making trades it matters not WHY price does what it does, only WHAT it does. I agree true price discovery is completely broken in these markets. People trade at their own risk, to say nothing of buying and holding….
Agree… but time frame matters. Certainly very short term trades.. day to couple of days. I agree with what you are saying when it comes to trading. I am skeptical as to what it means any longer to the larger trend, waves, Bull/Bear counts, etc., etc..
That is why I look to other indicators beyond technical. Because technicals and technical patterns work until they don’t work any more.
A critical point indeed. I think we all need an array of tools to help us determine likely market direction. I still struggle in those cases when my trader instinct and other indicators I like to watch, like pivot points, long wicks, Volatility, BB etc are saying something different from the expected EW count. Lara is generally so spot on I prefer to go with her analysis. Very early in the current move I had some big doubts about the minute two corrective count because of the way UVXY was acting. When a major move down begins, it rarely prints a red candle, but rather a series of fat green candles as the impulse down gathers momentum. That was the first red flag I noticed. Another thing was that long lower wick. Going back several months, that has in virtually every case been a clue of at least several days of upwards movement. I want to be always open to other possibilities when other indicators suggest something different may be developing. I certainly appreciate hearing other perspectives and hope I am always willing to learn from the experience of other traders on the forum.
Some folk are not only expecting new ATH, they are expecting former laggards to play catch up. Someone executed a very big trade on bullish 100/105 AAPL call spreads at 0.95 apiece with an August standard expiration. The lot was 10,000.00. AAPL has to move to a break-even price of 100.95 which is 4.4 % in just over a month to recoup the 950K in option premium. AAPL reports earnings July 26 so they must be expecting good news then. As we saw with the Brexit trades these don’t always turn out well (unless they held of for a few days!) but this one is particularly noteworthy as AAPL has been quite weak lately. it looks like some folk are expecting a helluva pump…
UVXY should signal early if the reverse split was a heads-up. What it does on Monday will be quite telling. As a matter of fact Sunday night futures may be an even earlier tell. Have a great week-end everyone!
That AAPL trade is fascinating, Apple is definitely a better value at these levels but how it behaves on earnings is pretty unpredictable. This isn’t a quarter I would make a big bet except for the fact their guidance was likely sand bagged so they could have a big beat this quarter. I would guess a trade that big is based on something solid, so I am tempted to follow with a small lottery ticket trade.
Yep. These guys rarely make these kinds of bets without good reason. I probably do a straddle just for fun….
Here is how they label Friday’s action on the 240 minute chart. Thanks for the feedback.
*Edit: Thank you Verne for sharing their count, but I must legally remove it from my website. It’s copyrighted material. Lara.
Vern,
Another projection has S&P hitting 2,177 and once 2,134.70 is taken out to the upside, it will act as support. This bullishness is predicted into early August 2016 for now and a much higher target around 1,810 ( compared to 1545 target that Lara) is projected heading into the election. I have gone through a number of analysis that label 1810 as a significant bottom.
Certainly not an easy market to trade.
Tough market indeed. As improbable as it seems to those of us who have been bearish for so long, we may indeed have to contend with new all time highs. One thing is clear; we can no longer make any bearish adjustments to the wave count. Next week will either firmly negate the idea of a previous top, or leave the door open that we have one in place. The problem I see is that a decline next week does not confirm the bearish count and it would be a huge mistake for traders to assume it does. As long as we stay above 2100 I think caution is warranted. These pivot battles, once won by either side, often see movement 3% or more past the pivot before a return for a test. When the pivots are not re-taken immediately, the market generally keeps going in the same direction.
This view does not in any way differ from what the bearish EW count requires. If a wave down at high degree does not commence immediately on Monday it would be difficult to maintain a bearish outlook for the immediate term imho…
To his credit, Prechter did insist that as long as the Feb lows held, we could not entirely rule out it was the start of a fifth wave up…we should soon know what Mr. Market has up his sleeve…
This is the EWI count they think will lead to new ATH…
*Edit: thank you very much Verne for sharing the chart, but legally I must remove it from my website because it’s copyrighted material. We can discuss the idea though. Lara.
In all fairness, they do show a bearish option with a complete cycle b wave, and a 1,2 intermediate of primary one down completed on chart inset…
I have been a EWI subscriber for a several years… I still am for a reason (but won’t get into that).
My decision point is determining who is right this time.
Lara saved me from turning losses into big losses a few years ago by subscribing vs just following the views & counts of EWI.
Her preferred bearish counts is one reason I remain neutral in the face of the current mania.
This EWI count is essentially the same count as another prominent EW analyst. He has a 2179 target for 3 and a 2246 target for (5). Then he has the bear market starting and heading down.
With the new swing high above 2120, he eliminated any immediate bearish option.
Yeah. Thanks for the post Rodney. The next move is critical and we have to get it right. Tough for us bears but you simply cannot argue with price action. The market is always right and one has to be willing to adjust when price action requires it. I realize we have not yet had the current count invalidated, so I am waiting for confirmation Monday. I am however expecting that odds are on the side of upwards movement continuing, possibly even after a pullback initially next week. It would take a substantial impulsive decline that decisively takes out SPX 2100 for me enter on the short side. I have to say I admire the conviction of those already positioned. I am sure hoping they are right so I can join them! 🙂
Correction – the target for 3 is 2185.
Yep. I figured that is what you meant.
I don’t like their long term counts at all, with those huge running flats. That looks so forced.
But essentially, apart from the degree maybe, their main wave count is the same as my bull wave count. A huge fourth wave has ended from the ATH to the low of 1,810 on 11th of February.
Now a fifth wave up begins there.
Sorry Lara. I thought “fair use” statutes allowed its posting on a private forum such as this…I may be mistaken but I did check with Steve about this kind of use in the past and he had no problem with such limited usage. I do understand that better safe than sorry on this kind of thing though…
Did a bit of checking and the two categories of permitted “fair use” are “commentary and criticism, and “parody” 🙂
It is interesting that Lara’s remaining bear count and EWI both see this move up as completing an intermediate wave. In the former case, since this third wave of intermediate C of primary two would be at minor degree, with minor four and five already complete as C of primary 2 has reached its absolute limit and cannot possibly go any higher without invalidating the count. The EWI view that this is the start of a minute three (off the 2074.02 low) of minor five of a terminal intermediate five means a new ATH is a certainty, with minute three to complete and minute four and five yet to come. We will have our answer on Monday, as the start of P3 down should not be in question. A continuing minute three however, should easily breach the 2134.71 ceiling on the way to a new ATH.
In either case the end is near, or nearer, according to both counts!
I’m changing my structure for primary 2 from a single to a double zigzag. With this upwards wave now intermediate (Y), not (C).
It has a slightly better fit.
I’m really struggling to understand the EWI wave count from your description. If any member would be kind enough to send me a chart outlining the idea I would be thankful.
Sent to your administrator email.
I am watching the DAX for clues to what is next.
DAX was up over 2% today. I am really starting to wonder if we are not seeing a global pump to distract from the ticking time bomb in Italy. I am remaining on the sidelines for now as something about all this seems quite eerie….a failure of Italy means a failure of the EU project. Their rules expressly forbid a bail-out of Paschi which has had two already….strange times…!
Seeing ‘Extreme Greed’ over at the CNN Fear & Greed Index (updated after market hours today, according to the timestamp on the site): http://money.cnn.com/data/fear-and-greed/
“During the last five trading days, volume in put options has lagged volume in call options by 39.09% as investors make bullish bets in their portfolios. This is among the lowest levels of put buying seen during the last two years, indicating extreme greed on the part of investors.” (-From the CNN Fear & Greed Index, CBOE 5-day average put/call ratio)
Geoff,
The put/call ration you mention is for the overall market or just stocks. The reason is if you look at the ETF instruments that are inverse of market, a call is not actually a call and a put is not a put. I thought MarketVolume website had some breakdown for these but will check that out later today.
Good question, Ris. I couldn’t find the answer on CNN Money site. That said, I guess it really doesn’t matter what data they use for a historical comparison. I did notice, for instance, that market turning points have generally coincided with extreme readings such as the one we see now.
#20 post this am… I put up another wave count idea? its easy to read.. there is an alt count that 2074 was a wave 2? just in case this wave 3 bull blows the upside..
or 3 -4 and a quick top Monday?.. 🙂
Yes. That will be the alternate bull wave count.
I think it is pretty clear we have been in a third wave up. I do not think we will have any confidence about what degree until we see if we get a new ATH. I personally also think it prudent to wait for confirmation….if the move up is the end of primary two and complete, the market has a long way to fall so there will be ample time to get short…price trumps all…and right now its direction is up….
Vern,
FWIW there are a number of folks calling for the ATH or significant top around July 22. It might drag for the next week if the timeline is correct.
I know. Lara’s view however is than any new ATH firmly and finally negates any bearish wave count one can offer based on her analysis, so I remain somewhat ambivalent. EWI does see the end of the bull market at the end of this minor five of intermediate five up by their count, but even that view should take upwards movement well in the month of August. Difficult, if not impossible to say who is right at this point. I expect we will know in a few days (although it seems as if we have been saying the same thing every week! 🙂 )
have to say looking at the 2min chart (posting of it below), oscillator is showing today’s high was the top of the little wave iii up. Little wave iv down yet, for 1-3 days, then little wave v back up to test the ATH 2134.72 area; and test that horizontal trend line from the May 2015 top, also test the sloping upward trend line too of the A-B-C-D-E pattern on weekly chart. If 2134.72 holds we would also have a double top of multi-year proportions. But as said, the second above it I’m a bull.
Big bearish price divergences though on the daily charts comparing all the various daily indexes, as Rodney pointed out.
That would give wave v only a 3 point window to go above today’s high and not make an ATH to keep the bear count…
Man, what a run we’ve had since the Tuesday after the Brexit vote. It does have a feel of a wave 3 rather than a wave 5. I really don’t know anymore…
but we are only talking about very small degree waves….
Stocks and Gold are moving in same direction, one of them is going to be very wrong and folks long that market are going to feel it.
Folks FWIW, there is another target that Lara had mentioned a while back above the 2,134 in the neighbourhood of 2,155 that will act as magnet for the indices over the coming week(s).
Yep, gold miners went up huge, TLT up too.
Strange, but hopefully – it is stocks that tank.
David,
I picked up some shorts on NUGT as the down trend in markets might need something much more than what we have seen so far. We shall see as a lot of new money will come into markets given this ramp over the last few days.
I was too early on my NUGT short. I think we have one more move up before a meaningful correction arrives…
Vern,
For that I had picked some GDX and will look to cash GDX on ramp up and make the profits work on NUGT short.
Sounds like a plan. NUGT still hovering close to upper BB since June 24. The bullish price action has been remarkable so no way to know how long it will stay pinned there. The last second close back below the BB in May resulted in another two week run-up toward the upper BB before a correction started. We may see the same thing here so I would be careful to get far enough out if you are using puts to short.
What goes up together may also go down together.
US 30 Year Treasury now up 30/32nd’s in price to Yield 2.096%
Sub 2% is near! That would be Insane! If you’re around my age you would never have believed would be possible.
Some folk actually think negative rates are coming Joe….
We have a potential negative divergence between SPX price and MACD on both the hourly and daily charts.
Thanks for pointing that out Rodney.
This upwards move does look weak… so far.
But then that’s the problem with divergence. It works…. until it doesn’t. Sometimes it just disappears.
Still, right now it’s there indicating weak momentum.
Once again the round number pivot proved prescient. When coupled with the engulfing candle and long lower wick there were good reasons for caution wrt to the immediate bearish case and I am glad I exited that spread. I am still quite cautious despite the apparent bearish divergences. Even the most casual observer sees that this market is not always driven by fundamental or even TA logic . I may have dismissed our friends at EWI prematurely. 🙂
It’s not over until the fat lady sings though Verne. The final invalidation point, the ATH for the bear, hasn’t been breached.
That’ the final line in the sand for the bear wave count.
And if it’s breached next week…. then we’ll use the bull. Wait for a correction and jump in long.
As for me, I’m fully short. The biggest position I’ve managed so far, because the stop was set just a few points away. Risking 5% of equity.
So far as its ability to foment feelings of frustration for bears, and frenzy for bulls, this would be, if confirmed, a P2 top for the ages…just what I would have expected…
Took a big position in SDS calls…$17 strike 9/16 expiration at .90 per contract. I’ll get out if we make new highs
I’ve just gotta jump in and say, that if that bear wave count is right then this is the biggest gift Mr Market will ever give us. The risk / reward ratio here is very big indeed. So jumping in short here could be the trade of a life time.
IF I’M WRONG and I could be, and if the bull wave count is right then price will surely be repelled here and now from the ATH.
So… jumping in with a short here with a stop just above the ATH should be profitable either way.
If price is in a bull market then a correction / reaction about here is so highly likely.
I’m taking the gift. I’m in all fully short. Now price is moving away I’ll move my stop to breakeven soon, and eliminate risk. Then just wait and see what Mr Market tells.
Bull or bear Mr Market?
As always, never ever invest more than 3-5% of equity on any one trade, and always use a stop loss.
1/vix at,.075….where previous tops were in…..
The EWI boys have us in a minute 3 up of minor 5 and intermediate 5 up. Should be clear in a few days which of these diametrically opposite theories is correct.
It is interesting they do not think new a ATH diminishes the bearish case. I think Lara’s fifth wave up they counted as a third wave so new ATH in DJI and SPX but not the other indices are expected.
Sounds similar essentially to my bull wave count?
They see this move up as an intermediate and final fifth wave, the current wave being minor three of intermediate five.
Ah. Quite different from my bull wave count then.
Yep.
Correction on that count. They actually see minor five of intermediate five up underway already, the current move up being minute three of minor five. They do anticipate new ATH in both DJI and SPX so early next week should clarify which count is correct. P2 should have run its course if the count is correct, with big a decline starting from here….
Once again, the Nasdaq, DJTA, NYA, and RUT do not confirm the new swing high. They still form lower highs and lower lows, unlike SPX and DJIA. Who is leading who?
For a long while I’ve thought it was DJT leading the pack. But I’ve not confirmed that empirically.
And yeah, true. All the others still have lower lows and lower highs. None of them are anywhere near their ATHs
The NYSE is the king (NYA), it did not breakout to a new high from its last four tops looking at a daily chart. It is way off from its all time high on a weekly chart. Meaning bearish price divergence. A “new bull market” my rear end.
Shall we brand that? 🙂
LOL
I’m being a bit cheeky (seeing as Doc’s not here ATM)
2134.71 holding…….for now
Peter earlier said something like the boys in Chicago would return from lunch, jack up the SPX and then sell it hard down for the close.
You pegged it Peter.
Yes, because I know some of them (live in Wisconsin remember). But also you can tell when it is them looking at a 1min candle chart. If most of the candles are short, not too many real long ones….it is the Chicago boys, especially on a Friday afternoon, on a day before a holiday too. After lunch note. If you see tons of very long 1min candles then it is the Algos. And this is general speak, but has truth to it. Oh – and the short candles? It is the Chicago traders one by one adding longs to their position, one does it, then the next, then the next, then the next, and you have an up market during that time. They “arrange” it, they are big monies, funds, private bankers, etc. They can do it.
If anyone is ever in Chicago, go down to the CME/other exchanges and follow the traders to lunch. Typically Pazzo’s, Lloyd’s, Rivers or One North restaurants. Sit next to them and listen, they are planning what they are going to do after lunch. No lie.
Wow. Thanks for the tip Peter! I’ve never been to Chicago, but if I ever do go then that’s what I’ll do. Just for fun 🙂
Even if you’re a bull, the ATH is going to repel price right here right now.
Even if you’re bullish there’s a quick buck (several) to be made on a scalp here.
Updated daily chart. This is the one I didn’t publish in this analysis, it was in last analysis. The third idea for the daily chart.
With the other two invalidated this is now the only one. By process of elimination. This and the bull wave count.
TBH I don’t like the three wave look to intermediate (C), and that’s why I didn’t publish this wave count in this analysis.
It will subdivide as a five on the hourly chart, and five minute chart. But that looks forced.
There’s just no room left for (C) to move higher and look like a five on the daily chart.
So now the bear has a problem of not looking right, and so does the bull. Both have problems.
Thanks for keeping us apprised on your latest thoughts. Would it be unusual for an intermediate (C) not to show up as a five on the daily charts? If so, does that substantially decrease the likelihood of the bear count?
15 min chart.
For the bear wave count it must stop here. If it doesn’t then the only wave count is a bullish wave count.
That would change everything in EW terms. It would mean that the big sideways consolidation of the last year or so was just a larger correction within an ongoing bull market, and price is on its way up to 2,500. and it may take a couple of years to get there.
would help if I actually put a chart up wouldn’t it 🙂
Wow. That’s surprising.
For the bear to be invalidated it must make a new ATH. Any amount, any time frame.
With price so close I’ve jumped in fully short. The risk / reward ratio is too good to ignore the possible opportunity.
Is it that easy…. you just buy a market and make money on the long side…..geeeez. Unbelievable!
Yep… Buy and HOLD! You make a fortune! Except when I do it. Yep any moron can do that! Be a perpetual Bull!
or we can sit around and talk about how the market is rigged and manipulated….either way
Yep! The new world… Go Long and go to sleep… wake up in 7 years a rich man. US Equities Never Ever Go DOWN and stay down! Always BTFD!
Last 14-15 months was just ONE BIG TEASE!
I am getting too old to be teased like that!
If it was that easy Marty then none of us would be spending all our time doing technical analysis, and we’d all be Billionaires.
30 Year Treasury NOT buying this nonsense… up 22/32nd’s to Yield 2.107%
shorting at next new high of today; Chicago boys had a fat Friday lunch, they’ll spike it up coming back from lunch now, then reverse it for the day.
adding first shorts here, will add more each basis point up; stop above ATH. Trading e-minis so will hold past closing hour of SPX.
EDIT: second short added, point higher.
Third shorts added; set then.
And, could one of you EW counters be kind enough to provide a count using a 20 or 30min chart? The price action up from the last low fits that time frame is why I ask. Thank you in advance,
And the weekly, alt count. Now my hands hurt (arthritis)!
The D area high trend line was draw with the 2134.72 point being hit today or the next day, so that is how I came up with the slope of the upper trend line.
Possible scenerio: 2min chart, if count is correct then we won’t see the high until next week. Will take a few days for wave iv to work itself out. Wave v then topping out along the expanding trendline on the daily chart i posted below, or at the ATH of 2134.72. Exception is if it hits the higher price target today.
The July 6th analysis with Lara’s first alternate is now squarely on the table. Better proportions, makes sense in light of the deep retrace, etc. If no new ATH is made in the S&P, then we will shortly begin our first wave down. Gold and bonds and oil are all diverging from stocks. Copper is a stone throw away from new 52 week lows.
If we can nail this first wave down, I do believe we’ll get 1 more chance at a second wave up to scalp and build profits for the big third wave.
This will all happen in the next few weeks. Be vigilant!
Also, if you haven’t been subscribed to Lara’s gold analysis – subscribe! We are about to launch into a major move.
Reading some of the comments below, if you’re going to use EW then follow it imo. We have been in a bear market since May of 2015 until price tells us differently. It is a bear because price, not to mention trend, has been going down for ~14 months now. If price invalidates it, then we have gone back to a bull market. There is nothing more to it than that.
Chins up, happy trading!
Maybe I am in the minority, but Lara’s whole picture analysis has convinced me to trust the bear count until I see final invalidation of the bear hypothesis. We are 10 points from there, but that doesn’t mean we will see invalidation. It actually makes me want to add to shorts because the risk/reward is in my favor as a bear. I can place the stop loss just above invalidation, and now I have a small potential loss versus a large potential gain. Just my two cents.
I’m with you on that! We arnt wrong until we are wrong and there is great risk reward ratio at this level.
Just gone *all in* with a stop at ATH 🙂
well look who is alive
Good luck!
Likewise Olga, if wrong I have extra large whisky ready to drown my sorrows!
I’m going to get with you going short, but waiting until it hits the broadening top trendline around 2027ish, per chart posted below. Noting though remember the cycle guy had a major date of July 13-14th, however that might play out.
Welcome back!
Me too Olga. Me too.
AGREE!
Given the strength of the move, I am expecting a close to 2,134 today setting up fresh money chasing the stocks come Monday morning.
The thing is that if you step back and look at the weekly chart of SPX, it has and does look like its just been a correction in the bull market. And the selloff in January was sufficiently deep as to cause me to think that it could have been part of a W1 down. But the rally since then has decimated any momentum that was there to the downside. We know that a W2 is supposed to make one think the prior trend is still on, only to be lead to slaughter, but there just has not been the weakness that the indicators indicate may be present. A W3 of the magnitude that is being presented should have, by now, exhibited some very strong swings to get it going. Laura has posted comparisons to the fall of 2008 and the fact that ATR was fairly stable in the beginning, but the QE’s weren’t in the market at that time, and this time I believe we should be seeing some very quick plunges and rallies back and forth. And I don’t see that. (notwithstanding Brexit)
Stuart made a similar argument recently.
Bottom line, we are all here to make money. Bull or Bear…why should it matter?
What EW theory is all about is trying to determine direction of main moves so that we can position ourselves in that direction. It too….like every thing in technical analysis …..has it’s short comings.
Yes, it has frustrated me too about all the central bank buying, but at the end of the day…markets are supply/demand driven. More buying, markets go up, more selling markets go down. The market doesn’t care if the buyer is you, me, Harry the Hedge Fund guy, or the New York Federal Reserve. As long as I’m positioned along the correct side, I don’t care who it is. The person who can recognize this earlier then the rest (e.g. Stuart), makes more money then the person who sees it later.
There are some really strong traders in this community. We should embrace everyone’s opinions, even if their opinions are different then ours.
I have said my peace, and now I am stepping down from my soap box.
GLTA!
Except there is plenty of weakness. There is divergence with price and VIX still, and most clearly weak volume. There is weak momentum, divergence with price and MACD.
If the wave count sees primary 2 only ending today at todays high, then you wouldn’t be seeing strength of primary wave 3.
Because it hasn’t started.
What you’d expect is everyone and his dog insisting on new all time highs.
Which would be p2 doing it’s job.
And of course, I could be wrong. That’s why we have a bull wave count for a road map if I’m wrong.
I subscribe to Lowry Research also. There is weakness in breadth to this upwards movement that they’re seeing too.
So weakness in breadth, volatility, momentum and volume.
That doesn’t mean price can’t make a new ATH. It just means the probability is that it more likely won’t.
And if the bull wave count is correct and is proven correct next week by a new ATH then we’ll use it. And expect a correction, into which we can all jump in long.
Because as Quang Vo points out, it doesn’t really matter if the market is bull or bear, we’re here to make money and we can do it in either direction.
Momentum still diverging with new highs.
I just want to reiterate that we are all so sufficiently disgusted that we must be very close to capitulation!
#&$^(*$(($_(~*_)*)_@*_)@*)@&)@((@&(&@^*@^)*^)*^)*@^*)@&)&)*@
I Can’t watch anymore…. I am out of here.
Have a Great Weekend…. OK where is the window?
some of us have been disgusted literally for years though. so.
2120.60 would be the next invalidation point for the daily, right. If that happens, I guess the next and maybe final number is going to be the 2134ish for the bearish case.
Well, all the bear counts as shown yesterday are invalidated. In order to keep a bear count going, I am guessing Primary 2 will be moved to today’s high. However, at this point it looks to me like we will see a new ATH early next week and the bull count will be confirmed. Nothing is certain though until we exceed 2134 to the upside or 2074 to the downside.
All I can say is #)&^%**@!%^$#!
Ketekete !!!!
That is a Nigerian magazine. Is that what you meant?
http://maoridictionary.co.nz/word/2582
Looks like a version of this count in play again?
How so? This count has been invalidated, right?
This one from yesterday has not, to my knowledge: http://elliottwavestockmarket.com/wp-content/uploads/2016/07/spx06jul16dailyalt.png
You got it. My concern is that if we continue to make significant changes to the counts and have a multitude of alternates, do we really have a grasp of what is happening?
Believe me, I sure hope the bear count proves true.
No. It is invalidated. Intermediate 2 cannot exceed Primary 2. Therefore, Primary 2 will need to be moved to the next swing high. That can only occur if we turn down before 2134.
The megaphone pattern on the SPX daily I posted a couple of days ago shows the high point, if reached today, at about 2127.
Noting the “(X)” should not be in there, forgot to take it out.
updated daily chart of 1min ago, (X) removed
There has not been any momentum to the downside since January. To kick off W3, there must be some sudden momentum to the downside. I believe absent that, we very well may go sideways until November,
Shock, event or exhaustion would stop stock market’s rise up. Here is a theory: FBI Jim Comey is a sly fox, he is not done yet. He got AG Loretta Lynch to declare to the world she will respect and follow what the FBI recommends against Hillary, he got the entire Democrat party to worship him in the last week. But there is a second FBI criminal investigation into Hillary Clinton and the Clinton Foundation. Who says Comey doesn’t come out next and announce he highly recommends charges, there is overwhelming evidence, against Hillary for those pay-to-play crimes? Comey has not mentioned anything about it, when asked he would not answer the question(s) by Congress or the news’ reporters.
Hillary has a boat load of damaging and incriminating information about everyone in Washington D.C. including the President. An insider has said she has threatened to use it if they indite her. She will never be charged.
Going by EW theory: no word (at all) from the FBI on the Clinton Foundation criminal investigation, thus it is still a possibility. The ‘count’ simply has not yet been invalidated.
I think you are onto something. I had a slightly different take. Rather than resign his post in disgust over what he saw developing, maybe Comey played along knowing how the American public would react to what they clearly saw unfolding, and vote accordingly. Maybe I am reaching. So sad to think he allowed himself to be so stained by this odious cartel.
Where is Eliot Ness when you need him 🙂
FWIW
My count has us in wave B of a final extended flat terminating around 2022 ish.
Should know later today if correct.
Would we be expecting that wC (hourly) would then be over today, assuming price doesn’t break above 2120?
So if the most recent C wave on the hourly chart is not over, what is the next best count?
No Counts are invalidated yet… that can only occur with a SPX print.
I know. However based on ES the open in SPX may be around 2117.
Still 25 min to open
I’d say its a distinct possibility that 2113 will be taken out. That’s what I’m saying. So just thinking what would be then next revised wave count based on that occurrence?
So who has the B _ lls to short ES Right here?
Shorting the sh*t out of it.
Bonds almost back to break even.
Also getting much longer gold.
Bond money isn’t buying the “BS” jobs report! 30Yr up 22/32’s to Yield 2.107%
UVXY below $8….no fear at all as Buy the Dip is back in full force..now hoping for a large correction in gold to wrap-up the week and some are calling for the top in the markets to be in place later this month…I know we have heard this story so many times that it is like a broken record.
Perfect way to negate the Europe banking issues short term atleast
So the no hike in rates till 2018 goes out the window.
September is Live for a rate increase.
The BIG CON continues!
WAFKING MESS! The Clinton data fudge… to win in Nov.
Joseph,
Now they will act cause it will be too close to the election so rate hike is really out till 2018…the game is rigged and masses are addicted to low interest rate. Like an addict, they just don’t want to see it changing anytime soon.
Blockbuster Jobs report, GOLD will likely feel the pain now..August gold tumbles $24.50, or 1.8%, to $1,337.60/oz.
its f–u Friday with the jobs numbers. anything might happen today
Possible preview of jobs report.
http://www.zerohedge.com/news/2016-07-07/what-expect-tomorrows-jobs-report-and-one-troubling-chart
Hello everybody, my name is Eric and I am quite new to the group. By the way thanks for all your useful comments. As Jim mentioned, I think something has to trigger wave 3. US Indices are indeed too high, and what it seems we should wait for the most is not ‘the drop too much’ which would cause the glass to overflow but the ‘ drop of water less’ which would let the gunpowder ignite. Some bank collapse? I agree with Lara, there is anyway something strange in the kingdom of volumes as well….
Where did the bus go? I had a nice comment! 🙂
Awaiting moderation ?!?
No, I just checked, released two comments, neither of which were yours Verne…
David’s bus is released
After the bus went AWOL I deleted my comment as it lacked context. Now that the bus is back I re-posted… 🙂
I realize the intermediate two count does not have the “right look”, but I am sure wondering about that new 52 week low in UVXY at the top of a corrective wave of only minute degree. Could we possibly be on the threshold of an intermediate three of P3 wave down that will be as protracted and extended as the one we saw on the way up? I had always thought that the years of bankster shenanigans would result in a swift unraveling of the house of cards once the decline got going and was somewhat convinced that the ferocity of minute one down, thanks to the Brexit brouhaha confirmed that viewpoint. If we are starting minute three and it behaves anything like minute one…it should be an exhilarating ride down…
Bull under the P3 wave 🙂
Hahahahahahaha
I just LOVE it!
I’m printing that, great art!
I think there needs to be another fear event to get this third wave going. Maybe a germany bank failure (Deutsche Bank) or BREXIT real estate ETF insolvency. Another domino to drop. Something yet to emerge. I used to trade Oil a lot and when one got good at the technicals it was eerie how some event or news item would match what the technicals predicted in terms of oil moving bullish or bearish. By the way the SPX is easy compared to oil IMO except of course right now within consolidation…
P.S. Based on indicators/ratios I have collected that are forward predictive of the S&P 500, I rate it on a weekly view that there is a 70% chance that we head down from here over the next month. This is unrelated to other option work I have posted that I was experimenting with. These signals used at the monthly level caused me to go to cash and buy long term option shorts for the S&P 500 on June 2015 that I still hold.
I wholeheartedly agree.
We need an exogenous shock.
The banksters will continue to play silly pump games and frustrate the impatient until it arrives .
The next black swan’s name may well be
Banca Monte Dei Paschi Di Siena….
The Italian Job
The world’s oldest bank happens to be the worlds most messed up bank 🙂
(well, with the possible exception for DB)
http://www.economist.com/news/leaders/21701756-italys-teetering-banks-will-be-europes-next-crisis-italian-job
Sienna is lovely, btw.
Give ‘er a shove will ya…? 🙂
LOL 🙂
Considering what is going on in the financial realm, it is absolutely the height of insanity that US markets are trading this close to all time highs. If ever there was a ripe for picking RTM trade, it has got to be US equity markets…remarkable this has gone on for this long a time…
Vern,
Don’t forget that things were no different in terms of market moves during the internet bubble and it came down in a hurry. The event has to come from outside of markets to trigger the next meltdown. Otherwise, these banksters and FED will continue to play the markets to their liking.
Its funny you mention that. I thought last week that weakness in the price of oil itself would bring the equities markets down. But today there was a 5% move down on crude, and stock indices barely budged… I have no idea what news will get this wave down going…
Could the consolidation we are experiencing be masking signs of the Hiddenburg Omen? Market is unusually undecided which in of itself is indicating something big is coming.
SPHB continues to respect the fork. Let’s see what happens tomorrow…
what is the appropriate way to draw that fork?
http://www.pitchforkplayground.com/drawing-an-andrews-pitchfork/
http://www.pitchforkplayground.com/5-rules-using-andrews-pitchforks/
Jim – wouldn’t you draw the second fork with the beginning point at the highest point back from where you have it? Knowing your way is also acceptable.
Second 🙂
1