
A little more upwards movement was expected as likely, but a warning was given that price looked weak. Downwards movement was not expected but was allowed for.
Summary: Downwards movement should continue from here with lower lows and lower highs. A short term target for tomorrow is 2,047. A mid term target is 1,912.
Last published monthly charts are here.
New updates to this analysis are in bold.
BEAR ELLIOTT WAVE COUNT
WEEKLY CHART
Click chart to enlarge.
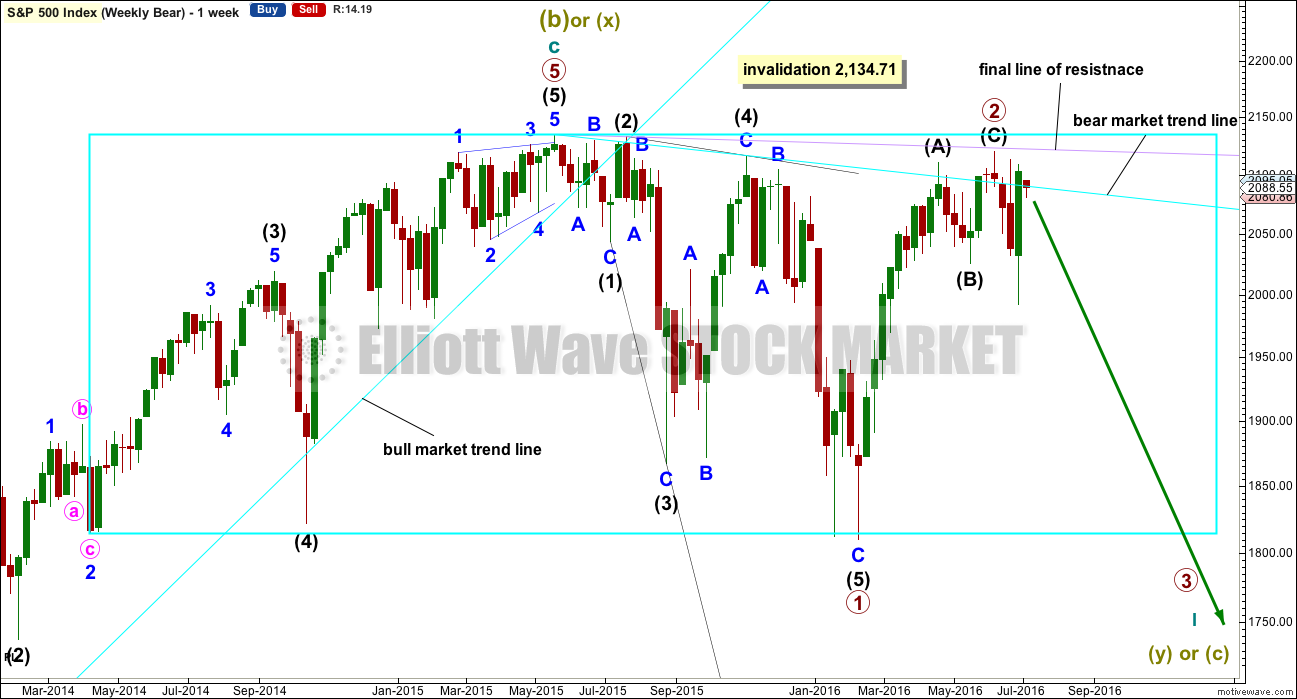
The box is added to the weekly chart. Price has been range bound for months. A breakout will eventually happen. The S&P often forms slow rounding tops, and this looks like what is happening here at a monthly / weekly time frame.
Primary wave 1 is seen as complete as a leading expanding diagonal. Primary wave 2 would be expected to be complete here or very soon indeed.
Leading diagonals are not rare, but they are not very common either. Leading diagonals are more often contracting than expanding. This wave count does not rely on a rare structure, but leading expanding diagonals are not common structures either.
Leading diagonals require sub waves 2 and 4 to be zigzags. Sub waves 1, 3 and 5 are most commonly zigzags but sometimes may appear to be impulses. In this case all subdivisions fit perfectly as zigzags and look like threes on the weekly and daily charts. There are no truncations and no rare structures in this wave count.
The fourth wave must overlap first wave price territory within a diagonal. It may not move beyond the end of the second wave.
Leading diagonals in first wave positions are often followed by very deep second wave corrections. Primary wave 2 would be the most common structure for a second wave, a zigzag, and fits the description of very deep. It may not move beyond the start of primary wave 1 above 2,134.72.
So far it looks like price is finding resistance at the lilac trend line. Price has not managed to break above it. If price continues higher, then look for upwards movement to end again if it comes up to the lilac trend line.
For today’s analysis, the main and first alternate daily wave counts in last analysis are swapped over again. All three daily wave counts remain valid and all expect the same direction next: down. They will begin to diverge in coming weeks, so at that stage the differences will be important. Eventually, price behaviour will tell us which one is correct.
MAIN DAILY CHART
Click chart to enlarge.
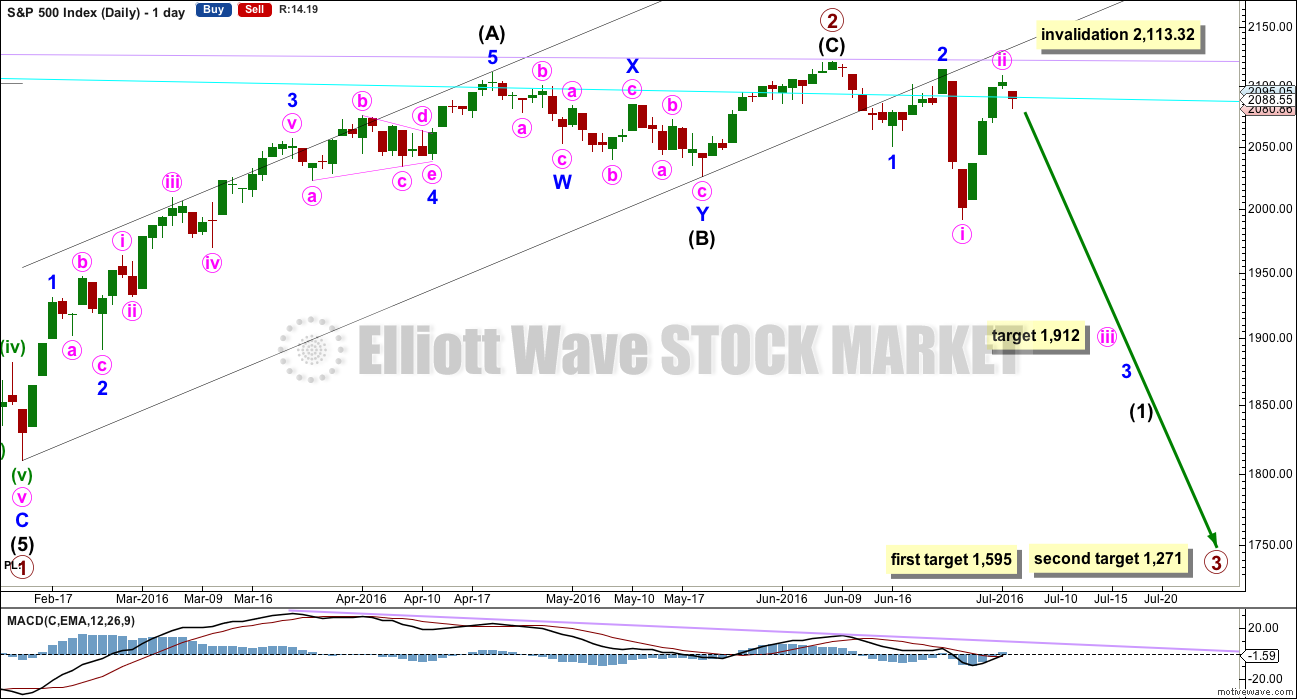
This was the main wave count up to very recently and it will be so again today, mostly through the alternates now reducing in probability.
If primary wave 2 was over earlier on 8th of June, then primary wave 3 has begun. At 1,595 primary wave 3 would reach 1.618 the length of primary wave 1. At 1,271 it would reach 2.618 the length of primary wave 1. Primary wave 1 lasted 38 weeks and primary wave 2 lasted 17 weeks. Primary wave 3 may be expected to be longer in length and duration than primary wave 1. In the first instance, a Fibonacci 55 weeks is expected, but maybe also 89 weeks is possible.
Within primary wave 3, intermediate wave (1) may be incomplete. It may have begun with a series of two overlapping first and second waves for minor waves 1 and 2 then minute waves i and ii. This indicates minor wave 3 may be extending, which is common.
Within the middle of intermediate wave (1), a mid term target for minute wave iii is at 1,912 where it would reach 1.618 the length of minute wave i.
If minute wave ii moves any higher (and it may), then it may not move beyond the start of minute wave i above 2,113.32. If minute wave ii continues higher, then it would have a clearer three wave look to it. It may end if price again comes to almost touch the lilac final line of resistance.
HOURLY CHART
Click chart to enlarge.
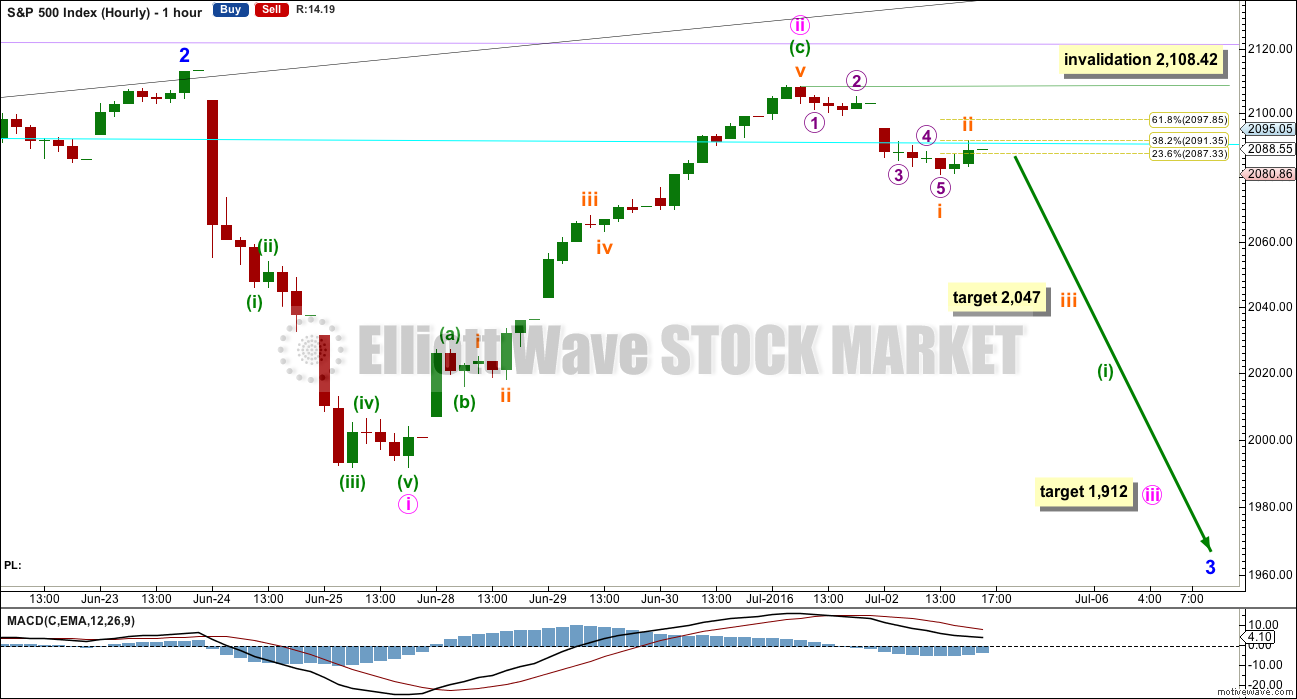
Upwards movement subdivides 5-3-5 and fits as a complete zigzag. But it may also be seen as an impulse, so it is ambiguous and cannot be determined with certainty which structure it is. If the invalidation point here is breached tomorrow or the day after, then minute wave ii may be moving higher. Expect it to end if price comes close to the lilac trend line.
If minute wave ii is over, then at 1,912 minute wave iii would reach 1.618 the length of minute wave i.
So far within minute wave iii the first wave of minuette wave (i) would probably be incomplete. Downwards movement for the first day of the new trading week may be only subminuette wave i. Subminuette wave ii may be over finding resistance at the cyan trend line. If subminuette wave iii begins here, then at 2,047 it would reach 1.618 the length of subminuette wave i.
If subminuette wave ii moves higher, it may not move beyond the start of subminuette wave i above 2,108.42.
At the end of Tuesday’s session, it looks like the cyan trend line is being respected as an area of resistance. I have labelled subminuette wave ii complete for this reason.
ALTERNATE DAILY CHART
Click chart to enlarge.
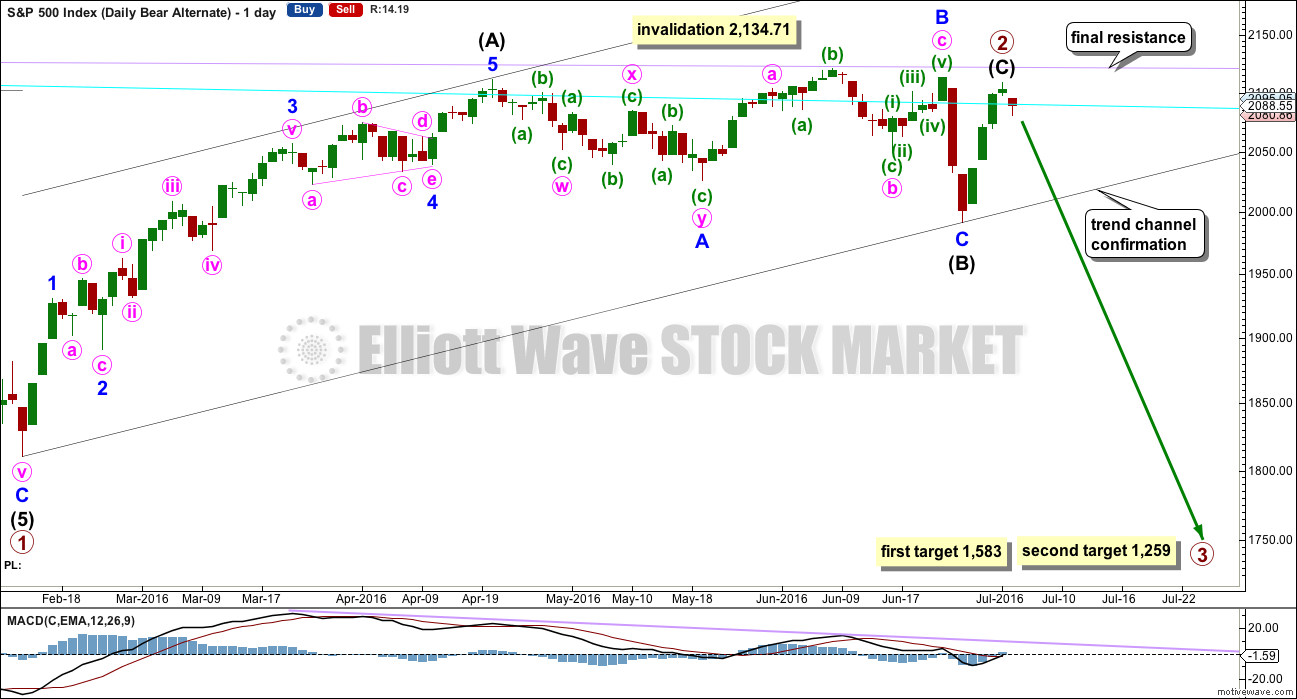
Primary wave 2 may be a complete zigzag, but intermediate wave (C) would be truncated by 2.34 points. This is possible right before a strong third wave down, but the truncation does reduce the probability of this wave count today. The small red candlestick looks like intermediate wave (C) for this wave count should be over.
Intermediate wave (B) may have been over at the last low as a regular flat correction. Minor wave B within it is a 1.02 length of minor wave A, shorter than the 1.05 requirement for an expanded flat but longer than the minimum requirement of 0.9. There is no Fibonacci ratio between minor waves A and C; minor wave C is shorter than 1.618 the length of minor wave A and was not truncated.
This wave count still has better proportions than the other two wave counts. Intermediate wave (C) may be over in a few days. This is more acceptable for a C wave within a zigzag than it would be for a second wave within a new trend. Overall, primary wave 2 would have lasted months as a primary degree wave should. This proportion looks about right.
The cyan line has been overshot a few times. It continues to provide some resistance and then support after price breaks above it. The lilac line has been tested only twice, last time at the high of 8th of June. If price comes up to it again, then it should be expected to offer very strong resistance, and that should be where upwards movement ends if a bear market is intact.
At 1,583 primary wave 3 would reach 1.618 the length of primary wave 1. At 1,259 primary wave 3 would reach 2.618 the length of primary wave 1. The lower target should have a higher probability because primary wave 2 was very deep.
SECOND ALTERNATE DAILY CHART
Click chart to enlarge.
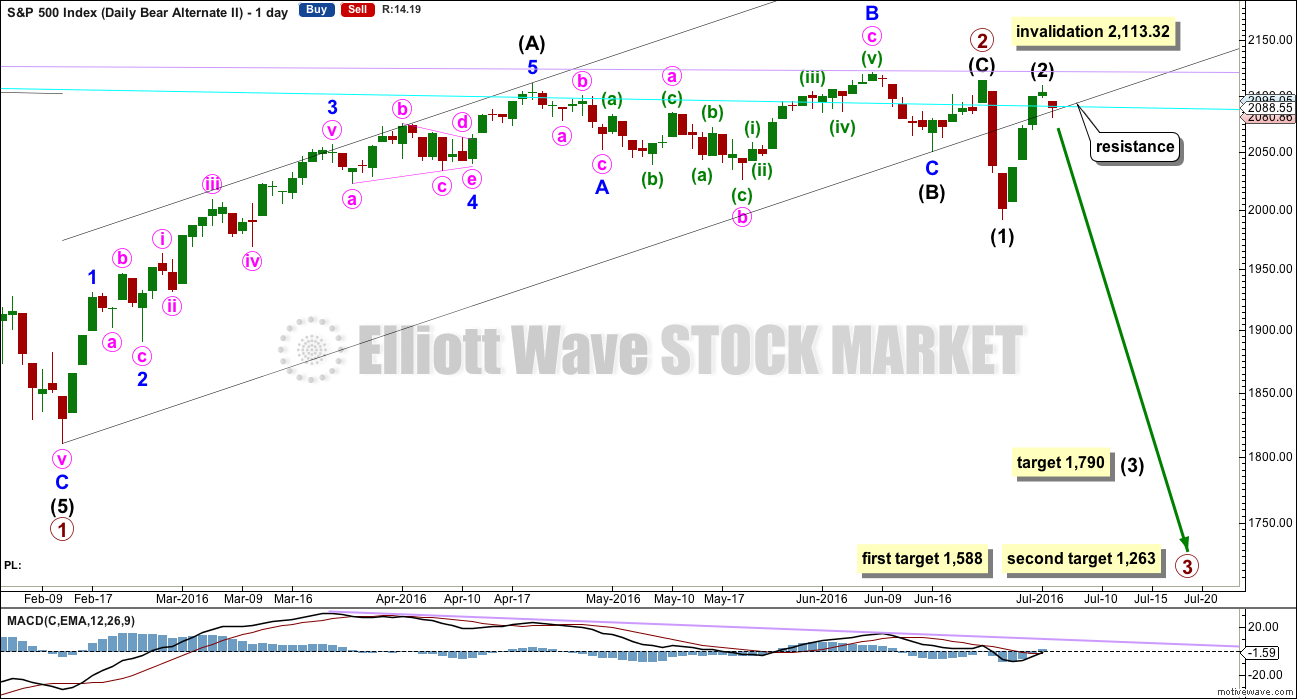
Primary wave 2 may have ended on 23rd of June. Primary wave 3 may have begun there.
Within primary wave 3, intermediate waves (1) and now (2) may be complete.
If upwards movement does not move above 2,111.05, this may be the preferred wave count.
If price begins to move strongly lower this week, then a target would be 1,790 for intermediate wave (3) to reach 2.618 the length of intermediate wave (1). This is the appropriate ratio to calculate the target in this instance because intermediate wave (2) is 0.96 of intermediate wave (1).
This wave count does not look right with the channel about primary wave 2. If that channel is correctly drawn, then intermediate wave (2) would most likely have ended when price came up to touch the lower edge for a typical throwback after a breach.
At 1,588 primary wave 3 would reach 1.618 the length of primary wave 1. At 1,263 primary wave 3 would reach 2.618 the length of primary wave 1. The lower target is more likely because primary wave 2 was very deep.
Intermediate wave (2) for this alternate wave count should be over here. It may not move beyond the start of intermediate wave (1) above 2,113.32.
BULL ELLIOTT WAVE COUNT
WEEKLY CHART
Click chart to enlarge.
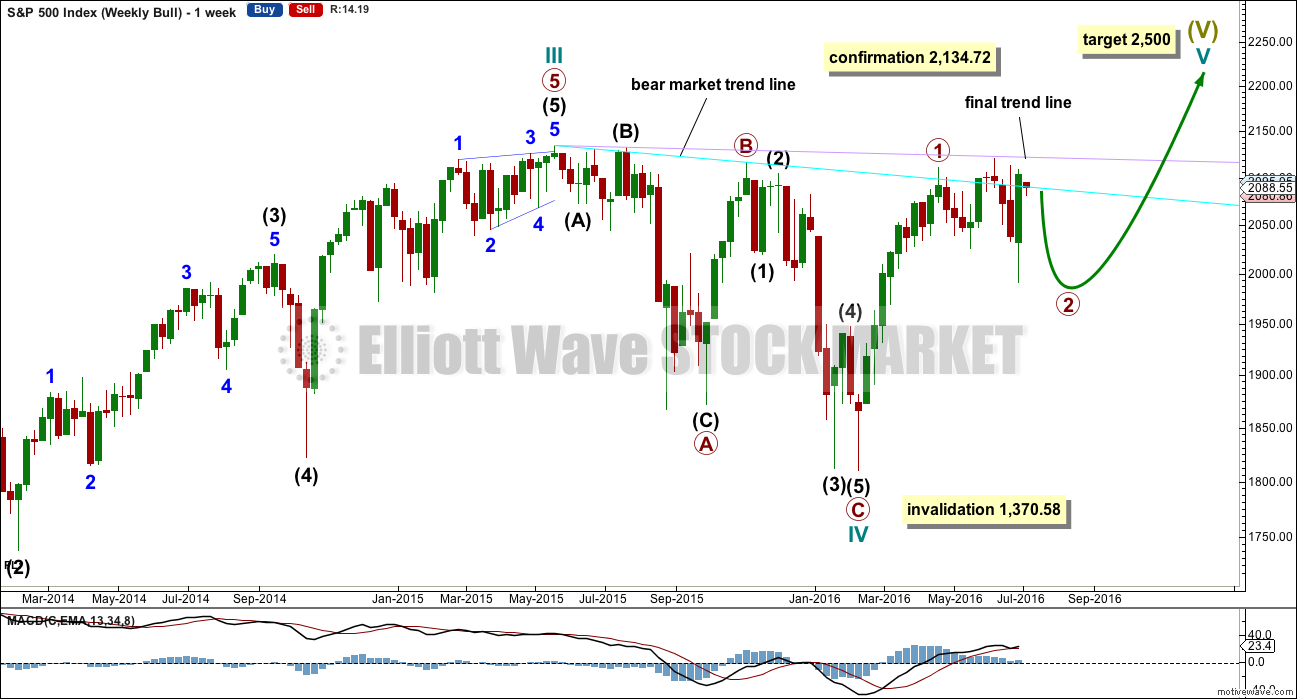
Cycle wave IV is seen as a complete flat correction. Within cycle wave IV, primary wave C is still seen as a five wave impulse.
Intermediate wave (3) has a strong three wave look to it on the weekly and daily charts. For the S&P, a large wave like this one at intermediate degree should look like an impulse at higher time frames. The three wave look substantially reduces the probability of this wave count. Subdivisions have been checked on the hourly chart, which will fit.
Cycle wave II was a shallow 0.41 zigzag lasting three months. Cycle wave IV may be a complete shallow 0.19 regular flat correction, exhibiting some alternation with cycle wave II and lasting nine months. Cycle wave IV would be grossly disproportionate to cycle wave II, and would have to move substantially out of a trend channel on the monthly chart, for it to continue further sideways as a double flat, triangle or combination. For this reason, although it is possible, it looks less likely that cycle wave IV would continue further. It should be over at the low as labelled.
At 2,500 cycle wave V would reach equality in length with cycle wave I.
Price has now broken a little above the bear market trend line. This line is drawn from the all time high at 2,134.72 to the swing high labelled primary wave B at 2,116.48 on November 2015. This line is drawn using the approach outlined by Magee in the classic “Technical Analysis of Stock Trends”. To use it correctly we should assume that a bear market remains intact until this line is breached by a close of 3% or more of market value. Now that the line is breached, the price point at which it is breached is calculated about 2,093.58. 3% of market value above this line would be 2,156.38, which would be above the all time high and the confirmation point.
This wave count requires price confirmation with a new all time high above 2,134.72.
While price has not made a new high, while it remains below the final trend line (lilac) and while technical indicators point to weakness in upwards movement, this very bullish wave count comes with a strong caveat. I still do not have confidence in it. It is produced as an alternate, because all possibilities must be considered. Price managed to keep making new highs for years on light and declining volume, so it is possible that this pattern may continue to new all time highs for cycle wave V.
The invalidation point will remain on the weekly chart at 1,370.58. Cycle wave IV may not move into cycle wave I price territory.
This invalidation point allows for the possibility that cycle wave IV may not be complete and may continue sideways for another one to two years as a double flat or double combination. Because both double flats and double combinations are both sideways movements, a new low substantially below the end of primary wave C at 1,810.10 should see this wave count discarded on the basis of a very low probability long before price makes a new low below 1,370.58.
DAILY CHART
Click chart to enlarge.
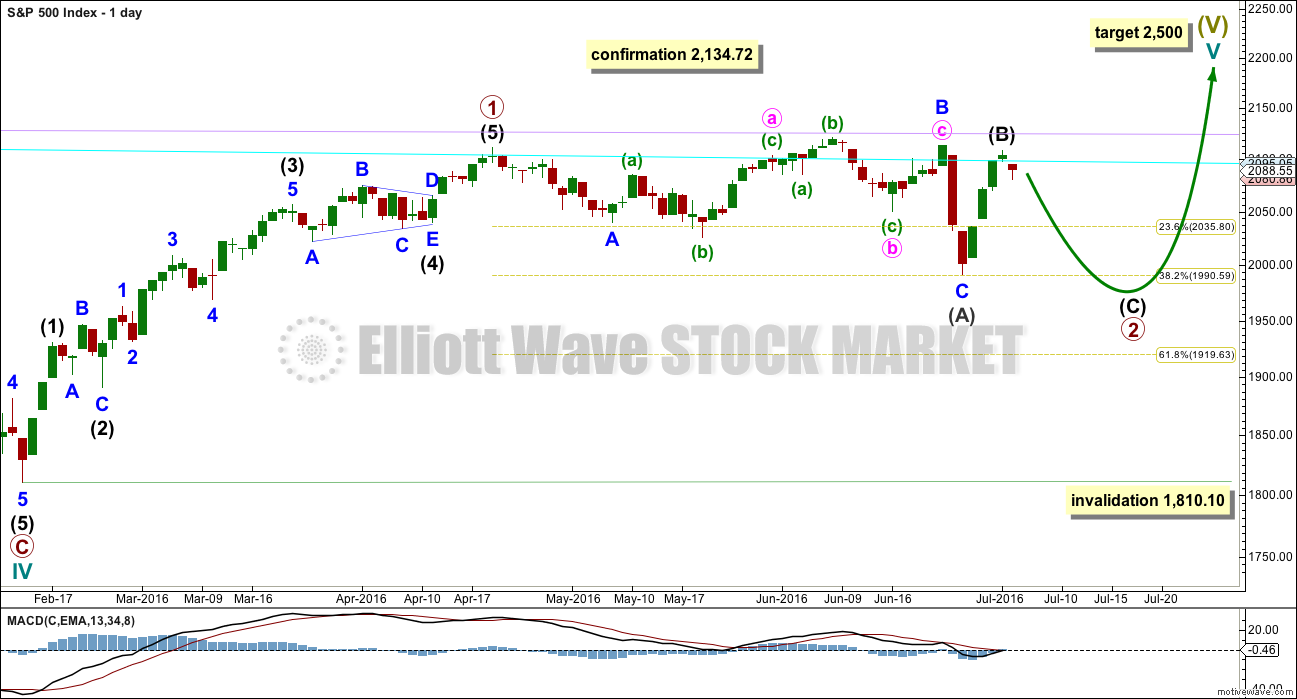
Two changes are made today to the bull wave count at the daily chart level.
The degree of movement is moved up one degree for the impulse now labelled primary wave 1. This fits better with the final target of 2,500 for cycle wave V to end.
The second change is to the correction now labelled at primary degree. While primary wave 2 may be a complete regular flat correction over at the low of intermediate wave (A), with continuing weakness to upwards movement and price remaining range bound, it looks like for a bull wave count primary wave 2 may not be over.
Primary wave 2 may be continuing sideways as a longer lasting flat, with intermediate wave (A) a complete three and now intermediate wave (B) also a complete three. Intermediate wave (C) may end slightly below the end of intermediate wave (A) at 1,991.68 to avoid a truncation.
Primary wave 2 may not move beyond the start of primary wave 1 at 1,810.10.
TECHNICAL ANALYSIS
DAILY CHART
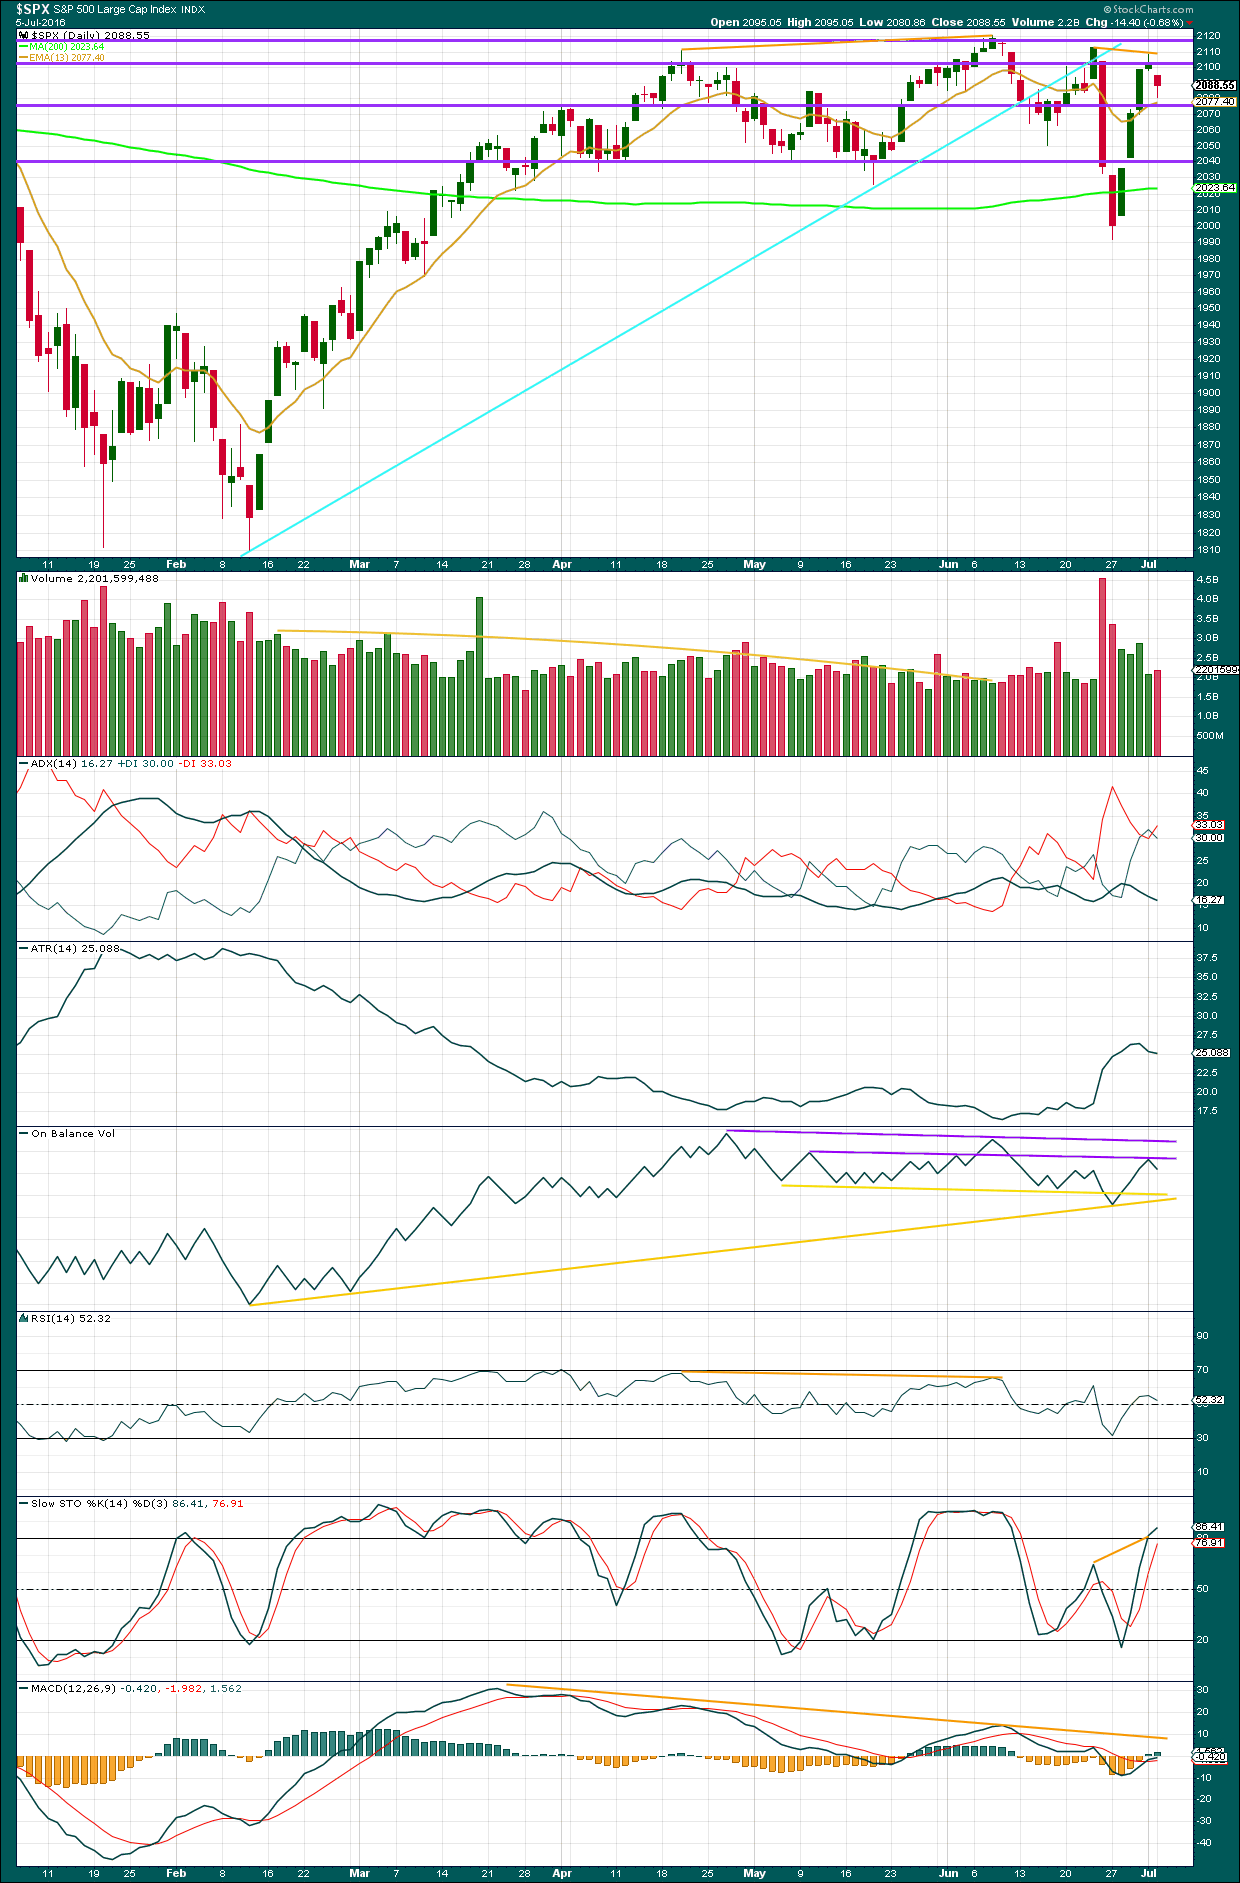
Click chart to enlarge. Chart courtesy of StockCharts.com.
Volume analysis is very important, so I will give it a lot of weight. If the volume profile does not give us a picture we want to see, then we gloss over the message it is giving us at our peril.
So what has volume been telling us?
For the period prior to this chart see analysis of volume on the monthly chart level here.
For the bull market spanning 2009 to 2015, volume very clearly declined as price rose to the all time high. That is not normal for a bull market. It indicates weakness and it is unsustainable. It is possible that this situation could occur again, and the Elliott wave bull wave count looks at this possibility but the probability must be judged to be low. At some stage, the rise in price will prove itself to be unsustainable by turning into a fully fledged bear market.
Now, since the all time high, (almost) each time price falls volume rises. Each rally has not managed to make a new all time high and has consistently shown declining volume as price rises. Here, a yellow trend line has been added to the volume profile for the rally from February to June 2016.
The rise in price from February to June also came with declining ATR. Again, this is not normal for a sustained rise in price. It indicates exhaustion from bulls. The bulls were only able to push it up by a smaller and smaller range as price moved higher.
There is divergence with price and RSI at the high in June, with price and MACD and with price and On Balance Volume. This indicates a lack of strength, weaker momentum, and weakness in volume at the high. Price has made a series so far of lower lows and lower highs since that high.
Price has been range bound on a smaller time frame since about March, delineated by purple lines providing resistance about 2,120 and support about 2,040. During this time, it is three downwards days of 29th April, 24th June, and 27th June which have strongest volume (ignoring the options expiry date of 17th June). Volume indicates that a downwards breakout from this consolidation is more likely than upwards.
Currently, ATR is declining and the +DX and -DX lines are whipsawing about each other. This indicates the market is not currently trending. ATR overall agrees, as currently it is also declining.
On Balance Volume today gave a weak bearish signal with a turn down from the purple trend line. This line was weakened in June when OBV moved above it only to then turn back below it. A break below the lower yellow line would be a strong bearish signal from OBV.
RSI is neutral. There is plenty of room for price to rise or fall.
Stochastics has reached overbought. In a range bound market, a downwards swing may be expected from here as price reached very close to resistance while Stochastics reached overbought. A downwards swing may continue until price finds support and Stochastics reaches oversold.
VOLATILITY – INVERTED VIX MONTHLY CHART
Click chart to enlarge. Chart courtesy of StockCharts.com.
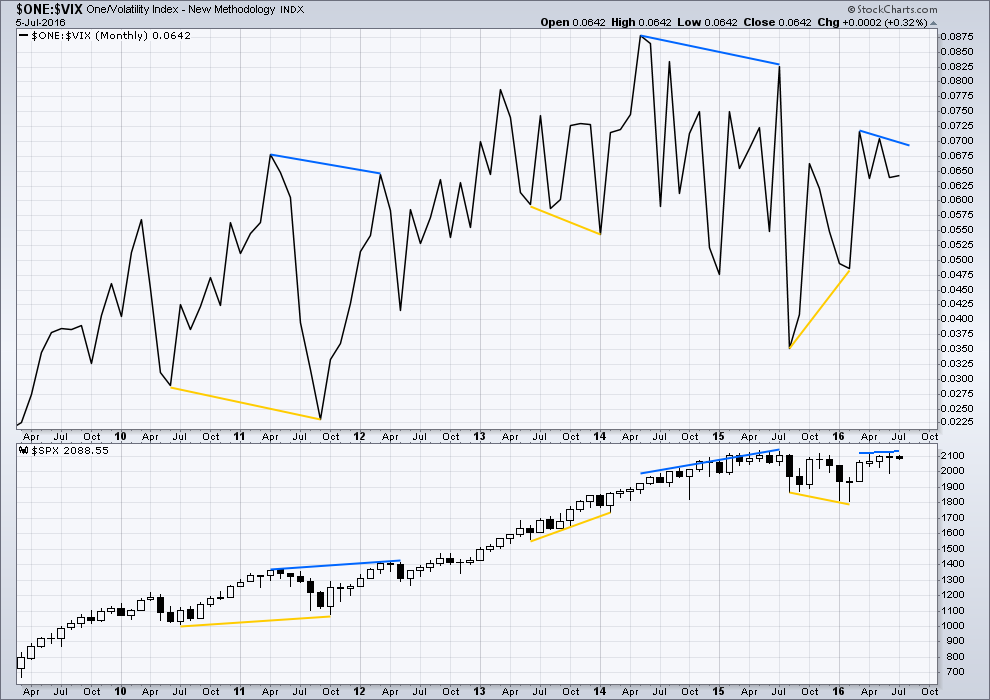
Several instances of large divergence between price and VIX (inverted) are noted here. Blue is bearish divergence and yellow is bullish divergence (rather than red and green, for our colour blind members).
Volatility declines as inverted VIX rises, which is normal for a bull market. Volatility increases as inverted VIX declines, which is normal for a bear market. Each time there is strong multi month divergence between price and VIX, it was followed by a strong movement from price: bearish divergence was followed by a fall in price and bullish divergence was followed by a rise in price.
There is still current multi month divergence between price and VIX: from the high in April 2016 price has made new highs but VIX has failed so far to follow with new highs. This regular bearish divergence still indicates weakness in price.
VOLATILITY – INVERTED VIX DAILY CHART
Click chart to enlarge. Chart courtesy of StockCharts.com.
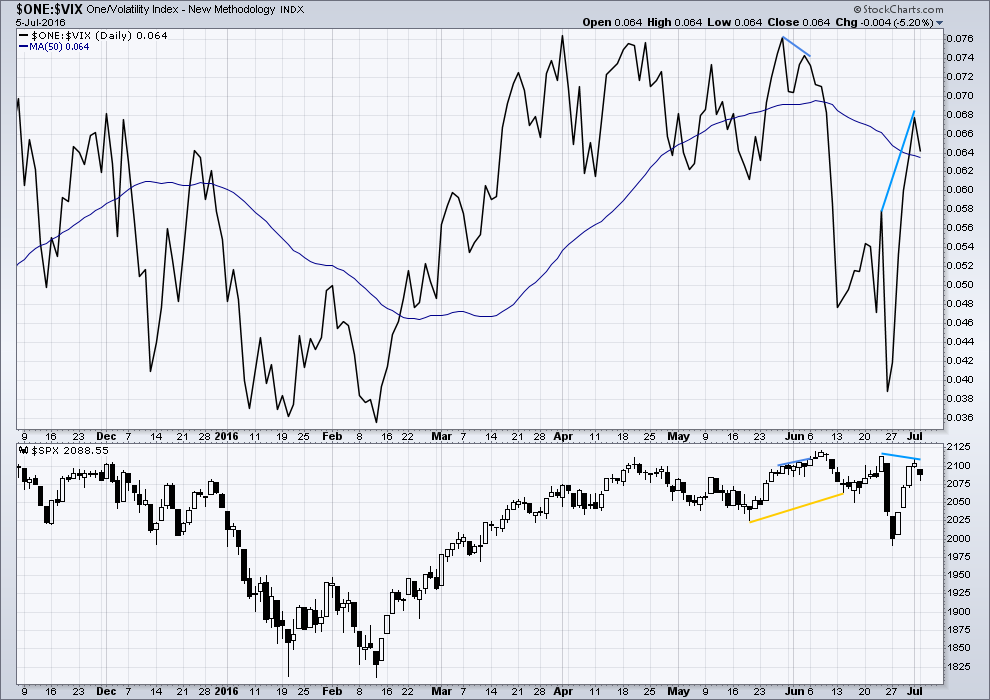
VIX from Stochastics is inverted. As price moves higher, inverted VIX should also move higher indicating a decline in volatility which is normal as price moves higher. As price moves lower, inverted VIX should also move lower indicating an increase in volatility which is normal with falling price.
As price moved higher last week for four days in a row, inverted VIX moved strongly higher. Volatility declined last week to a point which was lower than at the last swing high on 23rd of June. This is hidden bearish divergence and indicates weakness in price.
I would give a lot of weight to price and VIX. It is usually a reliable guide to an impending trend change.
BREADTH – ADVANCE DECLINE LINE
Click chart to enlarge. Chart courtesy of StockCharts.com.
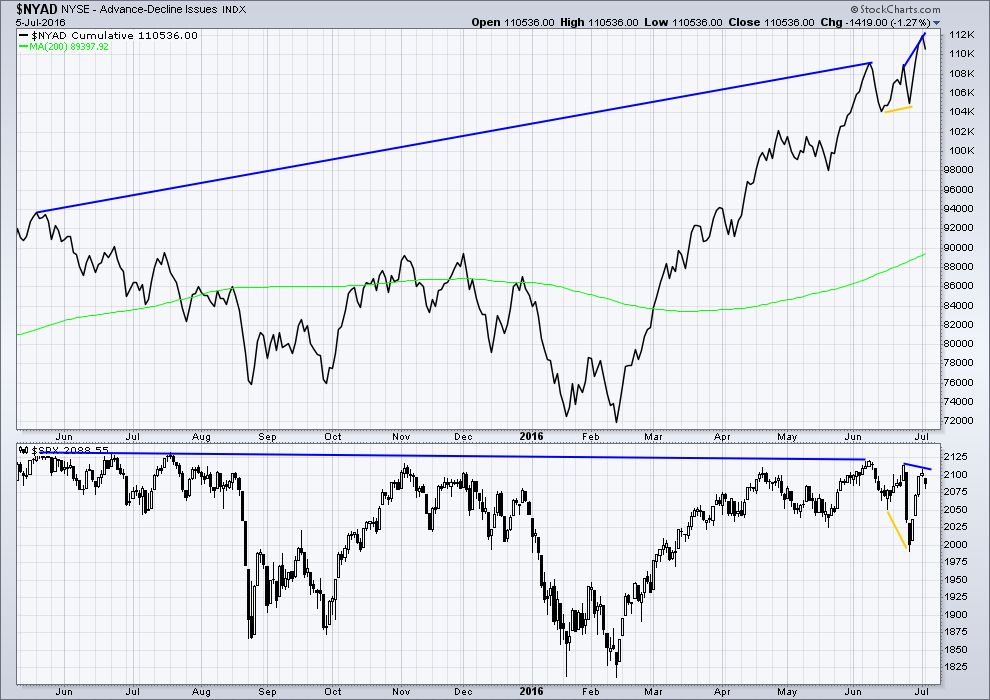
With the AD line increasing, this indicates the number of advancing stocks exceeds the number of declining stocks. This indicates that there is breadth to prior upwards movement.
Taking a look at the bigger picture, the AD line is making substantial new highs but price so far has not. While market breadth is increasing beyond the point it was at in May 2015, this has not translated (yet) into a corresponding rise in price. Price is weak. This is hidden bearish divergence (long blue lines).
There is divergence between price and the AD line indicated by short yellow lines. Price made new lows but the AD line failed to make corresponding new lows. This indicates some weakness to downwards movement from price. There is less breadth to downwards movement this time. This divergence is bullish and also supports the hourly Elliott wave count. Upwards movement over the last four days may be enough to resolve this bullish divergence.
The AD line has now made a new high above its prior high of 23rd of June yet price has not made a corresponding new high (short blue lines). This divergence now is bearish. It indicates that price is weak.
DOW THEORY
The last major lows within the bull market are noted below. Both the industrials and transportation indicies have closed below these price points on a daily closing basis; original Dow Theory has confirmed a bear market. By adding in the S&P500 and Nasdaq a modified Dow Theory has not confirmed a new bear market.
Within the new bear market, major highs are noted. For original Dow Theory to confirm the end of the current bear market and the start of a new bull market, the transportation index needs to confirm. It has not done so yet.
Major lows within the prior bull market:
DJIA: 15,855.12 (15th October, 2014) – closed below on 25th August, 2015.
DJT: 7,700.49 (12th October, 2014) – closed below on 24th August, 2015.
S&P500: 1,821.61 (15th October, 2014) – has not closed below this point yet.
Nasdaq: 4,117.84 (15th October, 2014) – has not closed below this point yet.
Major highs within the new bear market:
DJIA: 17,977.85 (4th November, 2015) – closed above on 18th April, 2016.
DJT: 8,358.20 (20th November, 2015) – has not closed above this point yet.
S&P500: 2,116.48 (3rd Nobember, 2015) – has now closed above this point on 8th June, 2016.
Nasdaq: 5,176.77 (2nd December, 2015) – has not closed above this point yet.
It is a reasonable conclusion that the indices are currently in a bear market. The trend remains the same until proven otherwise. Dow Theory is one of the oldest and simplest of all technical analysis methods. It is often accused of being late because it requires huge price movements to confirm a change from bull to bear. In this instance, it is interesting that so many analysts remain bullish while Dow Theory has confirmed a bear market. It is my personal opinion that Dow Theory should not be accused of being late as it seems to be ignored when it does not give the conclusion so many analysts want to see.
This analysis is published @ 09:44 p.m. EST.
So I took at the top 10 high beta (>1.5) and high market cap (> 10 Billion) Nasdaq stocks and looked at their performance in the last month. Hard to call that bullish…
PerfChart of PCLN, BIDU, NFLX, LBTYA, NXPI, AMAT, CTRP, PCAR, AMTD, MU
http://stockcharts.com/freecharts/perf.php?PCLN%2C%20BIDU%2C%20NFLX%2C%20LBTYA%2C%20NXPI%2C%20AMAT%2C%20CTRP%2C%20PCAR%2C%20AMTD%2C%20MU
Here is an update of SPHB (S&P High Beta Portfolio) which still shows orderly downward movement…
Well this is certainly confusing…. I see the bear case more than the bull especially after 7 years of run up. However, I am not certain of Elliot wave applies like it use to with all this central bank buying in the markets. Hopefully I am wrong! Everyone see the bigger picture… Weekly/Monthly going down… I certainly do. Please share your thoughts?
I made this comment below but I think it applies here as well “Until the S&P 500 stops consolidating it is consolidating and therefore analysis can get whipsawed until the S&P 500 breaks above or below the consolidation range. “
Marty & Jim,
I while back I had asked the same question. I agree over a long (very Long) term things will play out like EW predicts but the majority folks here are expecting profits from EW based reading over a period of 12 months or so. I personally use this analysis to gauge the technical influences on the market as there are a number of other factors that decide the direction and trend. I am not sure how many EW readers here caught the major dips in the past.
This is my view on that oft stated problem.
Bankers and their activities are part of the market. They operate as they do with our social consent. Were that consent to be withdrawn they could not operate.
What the government does, the FED, all of it, is part of social mood which moves the markets.
Large players with very big pockets can make short term movements more extreme, but they cannot alter the long term trend. If this bear wave count is correct then large players would not be able to force a new ATH and once the bear gets underway they can’t stop it.
Notice that when the Chinese markets crashed (beginning about a year ago and continuing earlier this year) nothing the CCP did was able to stop it. They pumped money in, forced regional branches (not sure that’s the right term) to put money into the market, and halted trading. They used the weight of security apparatus to implement measures they thought could halt the crash.
Nothing they did worked. Price still fell.
I’ve said this before but it bears repeating. The CCP is the closest to a God of Markets there ever will be. It’s not a democracy, the CCP has a high level of control over the Chinese economy and can intervene in the markets to a degree that other countries central governments cannot. Yet with all that power they could not stop a bear market.
Once fear takes hold price will fall. Sometimes the process of turning from extreme greed (a tired bull market) to full blown fear is a long slow curve.
scrap that idea – I think it is more like a deep sub minuette II. I am surprised at the depth of the retrace though given we are supposed to be in a wave 3.
Yeah. Once again they’ve got me sweating! 🙂
That move at the close was as aggressive a “shake the trees” dump as I have seen in some time. I noticed it got smacked down with a big red candle at the close to push SPX back under 2100.
VIX saying it’s a tempest in a teacup….
Vern,
I had been watching high beta stocks like PCLN all day yesterday and today. There was no urgency or lineup of sellers on these stocks. If you recall the behaviour after Brexit was completely opposite as sellers were lining up over each other. I think analysis of S&P in isolation from NASDAQ might not lead to profitable outcome.
I took a quick look at PCLN and there is nothing bullish about that chart. Today’s move clearly a three wave corrective move and did not even manage to enter gap area from last Friday. I think it is done and a great short candidate after today’s move up FWIW…. 🙂
Vern,
I expect a throw over to approx. 1300 to 1331 range but agree on excellent short if the timing works out. Last time it dropped over 150 points on one day…agree this and few other will be great short candidates
The last two times it was in the regions of the upper BB was a great shorting opportunity. Catching a good entry here in the middle of the bands is a lower probability set up but it does look like a second wave to me. If that is the case the next wave down should take it over a hundred points to the downside. I like selling premium against these high flyers ahead of a prospective impulsive move.
Huge cash dump underway into the close. What’s up with that??!!
Normal behaviour? It’s still only just above the 0.618 Fibonacci ratio.
To me, this looks like part of intermediate c of primary 2 of the bull count. So should still get some down movement soon.
There is something very, very strange going on. It sure looks like we are about to print a bullish engulfing candle in SPX which would support the idea that yesterday’s move down was corrective and we are about to see a move higher. VIX is not behaving the way it should ahead of a strong wave higher though so something does not add up imo….
Lara – just for clarification, as you posted this yesterday, on my expanding triangle alternative thought:
“Now this idea, yes. This is a good alternate for the bull wave count.
The subdivisions all fit and it meets all EW rules. Cycle IV would have alternation as an expanding triangle with the single zigzag of cycle II.”
So I am confused because yesterday you thought it could be possible (and under a bull count for you), and today you ruled it out. ? Or are we talking about 2 different things?
I’m sorry Peter, you posted two expanding triangle counts
yesterday one with a triangle for X
prior to that one with a big expanding triangle for cycle IV
my comment below refers to the chart posted yesterday, a triangle for X
or…. maybe I’m just talking a bunch of rubbish and I’ve got something here completely wrong?
there were two expanding triangle ideas, right?
Okay, got it. The cycle IV as an expanding triangle, yes, that’s just fine. It works.
The chart you posted yesterday with an X as an expanding triangle, as part of a lager combination for cycle IV, no, that’s the one I have a problem with.
Sorry Peter. As you were.
This expanding triangle idea is entirely valid, it’s a good count.
This idea is not okay.
Your devoted Rapscallion,
Today’s bullish engulfing candle and lower wick a big problem imo. Hopefully it turns into a bearish engulfing candle before the close…
I wouldn’t be reading it as a bullish engulfing candlestick pattern. For it to be a reversal pattern, there has to be something to reverse.
From Nison, Japanese Candlestick Charting Techniques page 43:
“the market has to be in a clearly definable… downtrend (for a bullish engulfing pattern), even if the trend is short term”
I don’t think yesterdays small red candlestick fits a clearly defined downtrend.
In fact, this market is consolidating still with resistance above about 2,120 and support below about 2,040. I wouldn’t be putting much weight at all on candlestick reversal patterns within a consolidation.
We need a breakout, on high volume.
Thanks for that clarification. Just banksters at work! 🙂
Maybe that is the most salient concept said to date. Until the S&P 500 stops consolidating it is consolidating and therefore analysis can get whipsawed until the S&P 500 breaks above or below. Therefore, we all need to pull an Olga and join her on break and chill 🙂
LOL
As soon as the wind here goes offshore, I’ll be riding waves in the ocean. Then I’ll get my Zen back on 🙂
Expanded flat.
Good morning every body 🙂
Ata Pai! 🙂
Kia ora Verne
From Lara’s words above of the weekly bear chart: “Leading diagonals are not rare, but they are not very common either. Leading diagonals are more often contracting than expanding.” Just triggered the cobwebs in my mind and ‘leading diagonals are commonly mistaken for 1-2, 1-2’s’. I Google’d those words and the web page was:
http://elliottwavepredictions.com/wave-notes/
Which gives EW rules/tips from 6 or more EW counters such as Kennedy, Allman. And the exact words are “Beware: what appears to be a leading diagonal is usually a 1-2-1-2 instead.”
Is the pattern from the May 2015 top a 1-2-1-2 down? Or am I just being a rapscallion?
My first wave count saw that move down as 1-2, 1-2.
That was invalidated when the second 2 went above the start of its 1. That price point which was breached was 2,116.48.
So….. yeah. You’re being a rapscallion 🙂
Incidentally, Sid Norris was a member of my first EW site, ElliottWaveForex, way back when, when he was still learning EW.
Oh sure, take my late idea and trash it 🙂
Wasn’t me, it was Mr Market. Honest!
Wedge broken…
SPX making another run at the 2098.07 target…
Now past the target…
yep, 2001ish and then 2108ish the next resistances. Go higher to one of these at least,
2102.50 is the top of the gap – so it might want to fill that, minimum
Reloading July 29 UVXY 10/6 bullish put spread for 2.00 per contract….
we could keep looking for bear signs but it never seems to materialise
as posted a week ago the last big drop in 2015 really took 9 weeks to get to the top where it plunged from; then the last plunge in Jan. 2016ish it took 8 weeks from that last top of November 2015. Thinking this plunge will take less than 8-9 weeks but we are only in week 4, thus can’t rule out it could take another 1-4 weeks yet for the top before the next plunge. And, if the broadening top/expanding triangle pattern as charts posted in yesterday’s forum show wave E down would really see a high back up around 2120 first.
No Peter, you can’t use that expanding triangle idea. It looks completely wrong. It makes absolutely no sense.
One of my jobs here is to teach members Elliott wave. And I would be doing a horrible job if I didn’t address this problem with that wave count.
If I saw that count published on another site online I’d think the person who did it had almost zero understanding of EW. It would be a completely amateur attempt which makes zero sense.
I would encourage you to put labels on your triangle, then you’ll start to see what I mean. Watch my video on the education page on triangles, it really should help you figure out how to label it. I’m not going to do it for you though, that’s not a good way to learn.
Until you’ve done that and figured out how the possible triangle works, and the implications of that, then I’m going to ask you don’t refer to it as an idea.
When you’ve done it then hopefully you’ll see exactly why it’s such an awful wave count.
This comment refers to the possible expanding triangle for X that you posted yesterday.
Not a possible expanding triangle on a monthly chart (which has a better look, but has a small problem)
Your right, but the main idea is the classic broadening top idea. But get your point. My thought is to constantly look for alternatives due to the tricky market since the 2015 top.
Thank you.
And yes, alternates are essential. When the S&P forms these slow rounding tops it gets really tricky, generally a few viable wave counts in play.
Just not that one.
Just so we’re all clear here, my comment above refers to this chart only.
Not this chart. This one is just fine.
Looks like the target is the SPX hourly GAP from 7/1 – 7/5 (7-5 was next trading day).
Here 2097.04 to 2097.97 is considered filled IMO.
Bear signs are everywhere?! However no one can deny the existence of PPT now. I mean with the EU melting down and treasuries yields at all time lows, but the SP is near all time highs? Really?!
Rising Wedge?
A little factoid: John Maynard Keynes proposed a theory in his book “The General Theory of Employment, Interest and Money” promoting government monies be injected into the economy for the purpose of, in layman’s terms ‘to get it going’. With one goal of reducing high unemployment. However, it was not then or even now based on ANY empirical research, studies, fact based data or historical research. Nada. Keynesian economics is nothing more than a postulation by John in 1936. I’ll declare his theory has never proven to be true; in fact it has been repeatedly proven to be false, flawed. A little evidence – Presidents Nixon and also Carter used it, how did the 1970’s work out? Disutility of labor, the wrong incentives such as force versus voluntary free market carrots, funny money creation, government intervention, etc. are all wrong.
Yet the right kind of politician loves Keynesian Economics because it hands more power and control to the government. 2014 Bloomberg article “John Maynard Keynes Is the Economist the World Needs Now”. 2009 headline of another liberal publication “Obama Gives Keynes His First Real-World Test”.
So who you ask is using Keynesian economic theory today? Italy, Japan, Germany, France, Spain, the UK, Puerto Rico and the good ole USA among others. Coming around full circle to EW and the markets here, Japan began toying with Keynes’ theory in the 1990’s. They went whole hog Keynes in the 2000’s. Watch Japan (EU countries next, then us) to provide clues as to where the EU and USA is going, i.e. next events. The Nikkei is down 61% (Fib. number interestingly) from its all time high. It is down 25.5% from its most recent July 2015 high. Last, with tremendous amounts of money pouring into the USA from many investors/funds around the world even that has not propelled us to new highs. Steers be warned.
Just read Japan is planning on actual helicopter money. Everyone gets a check. Yea.
I have been reviewing Keynesian Economics since the late 1970’s… It’s a complete failure. But not for it’s measures.
The times that you can say it worked was when a country that had minimal debt during a recession & put Keynesian Economics into play… yes helped to move the country out of recession earlier that it otherwise would have and into the next growth cycle.
But that country must pay down the debt created using these measures in that recession early on in the very next growth cycle so that you can build up a reserve to repeat this when the country enters the next recession.
There in lye’s the problem with Keynesian Economics and the political class that employ’s it’s measures.
The debt created to get out of recession is NEVER , EVER… paid down! It’s just stacked upon stacked and pilled on… and then stacked again and pilled on…. THEN to one day get where we are today. At a point where NO COUNTY can afford to (or has the free cash flow) to meet it’s debt service and all the promises it has made to it’s populations (Budgets+Un-Funded Liabilities).
The BIG HAIR CUT is here and this time will be a BIG ONE!
Looks like another dud of a day… watching paint dry again!
Time for lunch… back later.
Anyone know what these UK Property Funds are all about?
Seems that any Institution that runs one is now placing a freeze on all redemptions. Soon all will be frozen.
best I can see if we got minuette w(1) down and working on w(2) up. Not in love with this…
Always much appreciated, Gary
Yes. Ditto!
Yep! That is also my take…
Gary – how about moving your green (i) over to the low of today? Then (ii) up now?
Keeping a sharp eye on the IWM canary short term trend-line…
Humm?
Not too happy about that gap open being filled…
Let’s see if this is a huge head-fake or something else entirely…
but looks good though: a wave five of wave i (or 1) down completed this morning and presently in wave ii (or 2) up.
And this morning’s low too could be the end of wave three down of the larger wave i (or 1). All good so far…..Roar.
You are probably right; the malingering around the SPX 2100 pivot makes me a bit suspicious. I would have really liked to see the first pause a greater distance South of here…
It’s just a matter of time..Euro banks are crashing…they can’t save this one.
That sure is one big hole to fill! Please refer to the video Peter posted just below!
Should take out 2085.80 to avoid C wave truncation if it is an expanded flat…almost there…
Looks like yet another expanded flat for a corrective wave…the BTFD crowd should be salivating just about now…. 🙂
Oops! That could have been just a ZZ…
Three minute video on European debt, it is a must watch imo:
http://forbiddenknowledgetv.net/world-economy-collapse-explained-in-3-minutes-27744
OMG… Is that Ted Koppel?… LOL
You know what? Great short & sweet explanation!
LMAO… That was funny.
Thank you. Hilarious!
LOL
Yep. Seems legit.
We are right at the 13, 34, and 50 day moving averages. This is strong support and needs to be taken out. That will clear us to about 2024 where the 200 dma is currently.
They will not go gently…(nor quietly)…
We may need a few more wooden stakes… 🙂
Interesting subtle change in market dynamics; bears are waiting for the pump and selling it hard; quite different from recent price action…
Judging from the size of those candles on the five minute charts, it would appear the bears are in no mood for brooking any bulls _ _t from the banksters; at least not today…
Waiting for UVXY to clear 10 to become a true believer… 🙂
“Feels like” the bottom is about to fall out of the ES market.
Sure would welcome a real 3 wave and get a -3% + move today.
Uh Huh! 🙂
I have noticed & feel that too…
But the trap door just won’t open yet! Seems to be stuck. Maybe bounce up and down on it a few times to jar it loose!
European Banks are taken to the woodshed as defaults mount.
PPT and the banksters fighting tooth and nail, interesting times.
PPT yes. for sure. Zero price discovery with gap ups that should never be happening.
That was quick. Deploying dry powder… 🙂
SPX “stacking” gaps to the downside. These should all remain unfilled during this third wave down…
Just like all the GAPS not filled on the way up from SPX 1050! Yes… one thousand 050… 1050
Yikes! Them are a lot of gaps!! 🙂
Yep… I remember “every” “single” one of them! Looking for all to close asp!
Thanks Vern – interesting comments
No Problem.
When banksters are fighting the tape the way they have in the US futures market, the initial decline at the market open tends to be violent, followed by a protracted re-trace during the session as the PPT goes to work. I suspect they are going to try and prop the market up all day with the decline resuming toward the close. I plan on rolling short positions shortly after open and saving a bit of dry powder for the PPT.
As some point we should see run-away action to the downside but I don’t think we are quite there yet…these banksters are tricksy… 🙂
Trading a super-cycle degree bear market is turning out to be quite nerve-wracking! Last week’s action was a great example of how banksters can distort waves but not ultimately dismantle them. Many of us had dismissed the possibility of a minute degree correction because of the ferocity of the rebound and we can now see that view was not necessarily so. Shorting bear market rallies is absolutely the most counter-intuitive thing one can do and is what ultimately separates the men from the boys (no offense to the lady traders on the forum). I was really sweating with my huge UVXY bull spread and was just about ready to bail until I watched that video David posted of Tim Knight with those amazing fib numbers, and was reminded that for months now, shorting these kinds of manic rallies has been the money trade. These kinds of moves are almost never seen in true bull markets. Tim said he ‘wasted no time” in shorting that run up. I too, should have added to my short position based on the abundant evidence. Maybe I was bamboozled by the “Other Guys” who were insisting that a third wave up had begun. Having watched them be reliably wrong all these years you think I would have known better! The announcement of the UVXY reverse split certainly added to my jitters. Well, in the left side, right side- of- brain battle, the left side won out and I held the spread until yesterday, until the right side started whining again that UVXY was going to go to 5, even though it had not broken my line in the sand of 8.50; came close, but no cigar. A great reminder that good trading takes discipline as well as skill.
Bottom line, if this is a third down developing, UVXY is going much higher and contrary to someone opining that the short sellers will not need to cover even if it goes to 50, I beg to differ. The level of bullishness in this market is truly astonishing and there is an elastic limit that is going to make it clear to every one that the BTFD crowd is about be carried out on a stretcher. The kind of relentless decay we have seen in UVXY in the past has undoubtedly been the result of the persistent bullish sentiment in the market, even in the face of dramatic, water-fall declines. Last week’s action went a long way toward convincing the crowd it does not matter how far the market falls – BTFD!!
If decay was the name of the game in a persistently bullish environment, what do you think this derivative is going to do in a persistently BEARISH environment? We had a little preview of the kind of explosion that can take place last September 1 when UVXY exploded higher long after VIX made its capitulation high on August 24. That folks, was short sellers panicking en masse!
Get ready for a repeat performance. Here’s the good news; I expect the reverse split to be executed just about the time UVXY is blowing through its upper BB band and it will present a big fat shorting opportunity.
As someone said, plan you trade, and trade your plan. 🙂
Tim Knight is on vacation this week, when he goes on vacation the market crashes – like clockwork 🙂 a great indicator
BTW David, many thanks for posting that link. I was felling a bit of pressure and it was exactly what I needed last week! 🙂
You’re most welcome. And thanks for your comments and ideas, always interesting and useful.
Didn’t know how many saw the link – posted late in the day.
Tim Knight is a beacon of reason out there in the wilderness. His daily show (off this week) is live at 2:15 daily on tastytrade.com. And his (delightfully named) website slopeofhope.com is also worthy of a visit.
Yes, thank you again from me too David. I really like calm, solid technical analysis like he does. Adds another little bit of information, helps me see bits I may miss.
Thanks for your comment and forthrightness. I completed my UVXY purchases this morning.
Yeh, but SPX does not look too impulsive at the moment.
Banksters at work. They have been buying futures like there is no tomorrow. They can “manage” all they want; it will ultimately make no difference to where the market is ultimately headed imho…
I would not be surprised to see current wave morph into an expanded flat as they try to bamboozle the crowd…
Both FTSE and DAX down, with DAX down another 2% atm.
30 Year US Treasury Bond Yield is now close enough to 2.00% to be able to go deep sub 2.00% on an impulsive larger degree wave down!
Now at a 2.109% Yield! 1.80% or lower is within reach.
The dollar continues to get stronger! The dollar will hurt current quarter earnings and future guidance if any given. Analysts were estimating a weaker dollar for quarter end and beyond.
“If primary wave 2 was over earlier on 8th of June, then primary wave 3 has begun. At 1,595 primary wave 3 would reach 1.618 the length of primary wave 1…”
going forward, we may want to keep the following in mind:
– SPX 2000 top was 1552.87 on March 24 (orange dashed line)
– SPX 2007 top was 1576.09 on October 11 (orange dashed line)
Very interesting on those two previous highs and it should be keep in mind.
But to be clear Philip, what is your specific meaning for pointing that out?
it is obviously related to the cited quote from Lara’s analysis…
Ah… sorry I didn’t realize that was a quote. Thanks.
Thanks Philip for the charts. I am interested in knowing what are the oscillators on the bottom three graphs. It is notable that all three oscillators are started a downward move even though price is still near ATH. I think this is another indication we are in the very early stages of a bear market. Thanks again.
the black/red indicator, the blue indicator, and the orange/blue indicator are proprietary indicators developed by me…all three are indicators overlaid with other indicators…the red indicator is the standard RSI(14)…it is interesting to note that you picked up on how the indicators are displaying significant negative divergence with price…in my view, it is just a matter of time before price aligns with the indicators…
SPX broke from that triple top back in April 2013. I suspect it is going to take a return to close to those levels to jolt the bulls awake from their optimistic slumber. We may get there faster than most folk expect…!
Yep… but this time I will believe it only when we get there. Way too many teases!
To finally break the BTFD’ers…. need to strongly break below those two previous peaks.
Lara,
I made a comment late in the day on July 5th. I want to make sure your see it. So I reprint it here. You asked “Will I do?” when the comment of missing Olga was made. You also mentioned that you don’t make comments until your early morning coffee does its job.
——————————————————————————–
Rodney
July 5, 2016 at 6:39 pm
That is probably very wise. I know it is for me.
And I agree, “Yes” you will always ‘do’. You are why I am here. Everyone and everything else is frosting on the cake.
———————————————————————-
And Olga if you read this, I too miss your participation. Hope all is well with you.
Thanks Rodney, I did see it 🙂
When you’re ready to jump back in Olga I think you’ll receive a warm reception.
Thanks Lara. It looks like all reasonable possibilities are covered. With the after hours SPX futures currently down 14+ points, it looks like the ‘gap and go’ I mentioned earlier today must just materialize.
Nice. That would be two in a row.
Third 🙂
30 Year UST at all time lows again tonight at 2.132% Yield… Could this be what is about to blow up????
Time To Take The Fed’s Warning Seriously: CMBS Has “Greatest Ever Monthly Delinquency Increase”
15 loans totaling $221MM became newly delinquent in June. In total, 71 loans with a balance of $760.6MM were delinquent in June, resulting in a delinquency rate of 32bp. The $142MM month-over-month increase in the volume of delinquent loans was the greatest ever – it eclipses the $116MM increase in March 2016 and compares to an average monthly increase of $40.7MM.
http://www.zerohedge.com/news/2016-07-05/time-take-feds-warning-seriously-cmbs-has-greatest-ever-monthly-delinquency-increase
This is certainly out of the blue! What else is about to blow up???
30 Year UST at all time lows again this morning at 2.099% Yield
It amazes me how “all” “everyone” is using BREXIT as an excuse for economic weakness. Hey folks… this economic weakness is NOT BREXIT!
The world was this weak well before this BREXIT vote took place a week ago. AND you know what??? NOTHING has yet changed in regards to BREXIT… NOTHING! That exit is a 2+ Year process and it hasn’t started yet.
If nothing else BREXIT is the catalyst the trigger to the awareness of existing economic weakness… NOT the cause of it! The media & press is playing right into the propaganda!
Well that’s my Rant for today… oh wait… IT has now been proven out… there is one set of laws for US Citizens and another set of Laws for the Clinton’s & other elites!
First?
Ae. Tahi.