
Upwards movement was expected for Friday’s session.
Price moved higher to complete a small green daily candlestick.
Summary: In the short term, price may move yet a little higher early next week. Upwards movement looks to be very weak though, so it may end sooner rather than later. If it continues, it may be with a very small range and light volume. If it touches the lilac trend line, then it is highly likely to stop there. Look out for surprises to the downside, the next wave down may be very strong.
Last published monthly charts are here.
New updates to this analysis are in bold.
BEAR ELLIOTT WAVE COUNT
WEEKLY CHART
Click chart to enlarge.
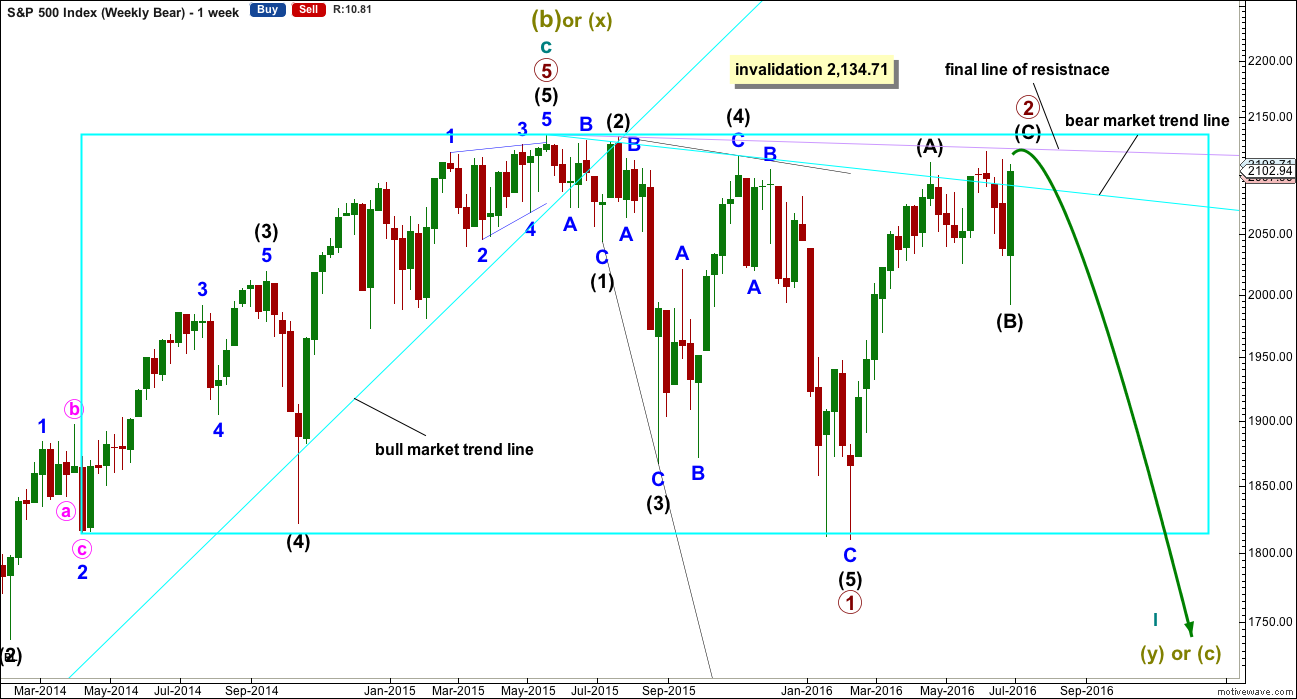
The box is added to the weekly chart. Price has been range bound for months. A breakout will eventually happen. The S&P often forms slow rounding tops, and this looks like what is happening here at a monthly / weekly time frame.
Primary wave 1 is seen as complete as a leading expanding diagonal. Primary wave 2 would be expected to be complete very soon indeed.
Leading diagonals are not rare, but they are not very common either. Leading diagonals are more often contracting than expanding. This wave count does not rely on a rare structure, but leading expanding diagonals are not common structures either.
Leading diagonals require sub waves 2 and 4 to be zigzags. Sub waves 1, 3 and 5 are most commonly zigzags but sometimes may appear to be impulses. In this case all subdivisions fit perfectly as zigzags and look like threes on the weekly and daily charts. There are no truncations and no rare structures in this wave count.
The fourth wave must overlap first wave price territory within a diagonal. It may not move beyond the end of the second wave.
Leading diagonals in first wave positions are often followed by very deep second wave corrections. Primary wave 2 would be the most common structure for a second wave, a zigzag, and fits the description of very deep. It may not move beyond the start of primary wave 1 above 2,134.72.
So far it looks like price is finding resistance at the lilac trend line. Price has not managed to break above it. If price continues higher next week, then look for upwards movement to end again if it comes up to the lilac trend line. This line may be a better guide for when and where upwards movement may end than any target which could be calculated.
At the end of this week, all three ideas at the daily chart level will be published in the order I prefer them. Members may make their own judgements as to which daily wave count is more likely.
MAIN DAILY CHART
Click chart to enlarge.
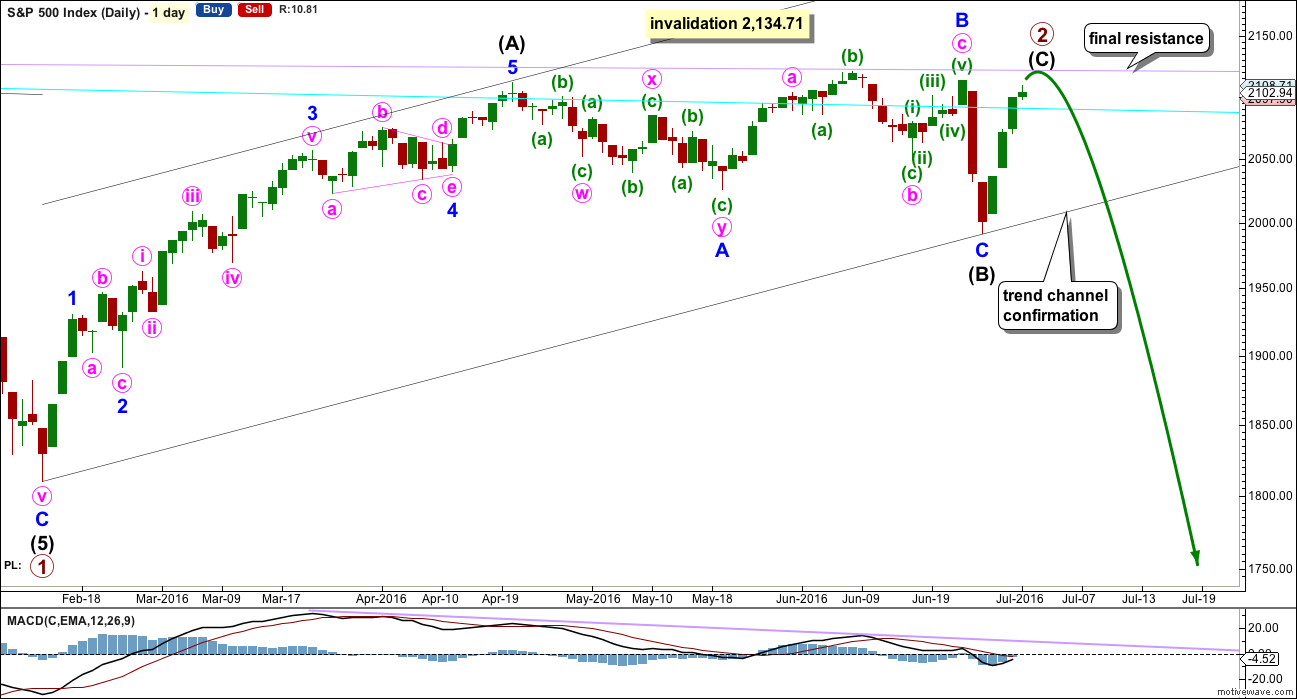
Primary wave 2 may be an almost complete zigzag.
Intermediate wave (B) may have been over at the last low as a regular flat correction. Minor wave B within it is a 1.02 length of minor wave A, shorter than the 1.05 requirement for an expanded flat but longer than the minimum requirement of 0.9. There is no Fibonacci ratio between minor waves A and C; minor wave C is shorter than 1.618 the length of minor wave A and was not truncated.
Intermediate wave (C) would be likely to end at least slightly above the end of intermediate wave (A) at 2,111.05 to avoid a truncation.
This wave count has better proportions than the two alternates below. Intermediate wave (C) may be over in a few days. This is more acceptable for a C wave within a zigzag than it would be for a second wave within a new trend. Overall, primary wave 2 would have lasted months as a primary degree wave should. This proportion looks about right. If intermediate wave (C) ends in one more day it may total a Fibonacci five days.
The cyan line has been overshot a few times. It continues to provide some resistance and then support after price breaks above it. The lilac line has been tested only twice, last time at the high of 8th of June. If price comes up to it again, then it should be expected to offer very strong resistance, and that should be where upwards movement ends if a bear market is intact. It will be my personal trading strategy to open a short position if price touches that trend line again, risking my maximum 5% of equity.
When the end of primary wave 2 is known, then a target may be calculated for primary wave 3 down. That cannot be done yet. The expectation would be for primary wave 3 to be either 535 or 850 point in length, with the longer length more likely as primary wave 2 is very deep.
HOURLY CHART
Click chart to enlarge.
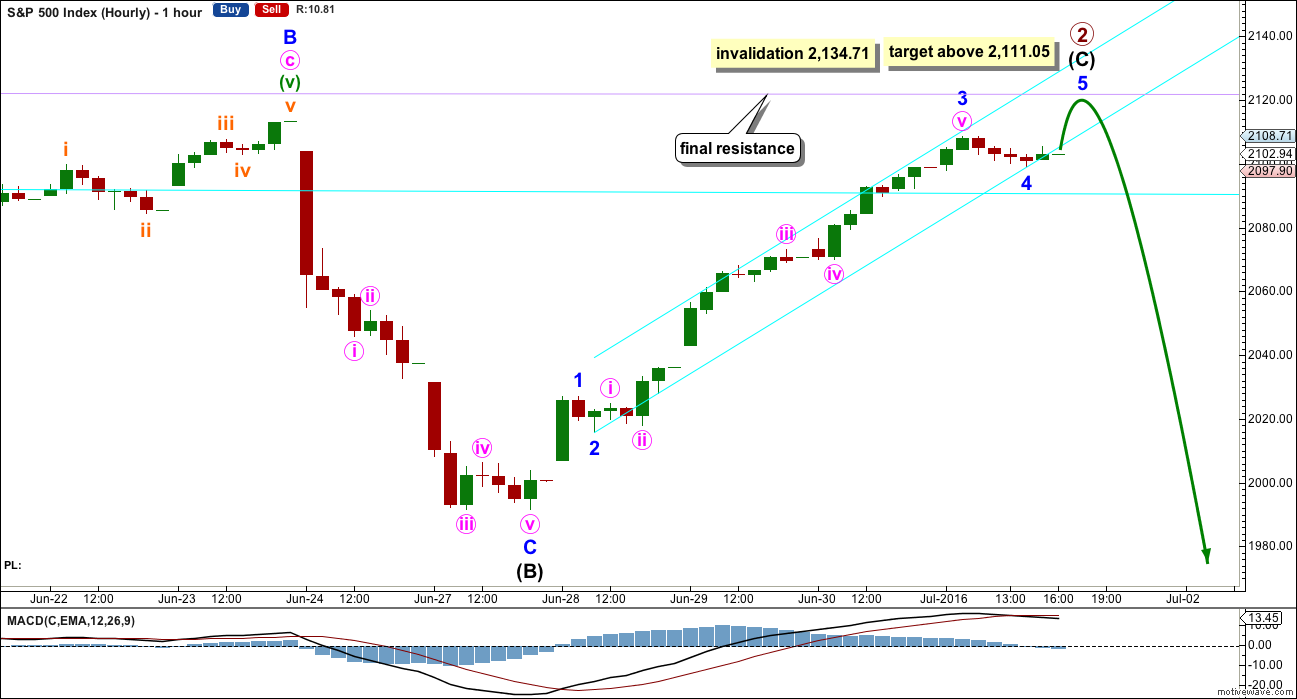
Upwards movement no longer fits within the small cyan trend line as it was drawn on the last hourly chart. If sideways / downwards movement at the end of Friday’s session was a fourth wave, then that may explain the channel breach. Fourth waves are not always nicely contained within channels, and the S&P does not always respect channels (particularly narrow steep ones on low time frames). The channel is redrawn using Elliott’s second technique.
Minor wave 3 may have ended at the high for Friday. Here, it is just 0.02 longer than 2.618 the length of minor wave 1. The labelling within intermediate wave (C) was determined on the five minute chart. The middle of minor wave 3 has the strongest momentum.
This wave count expects one final upwards wave to complete the structure. At 2,121 minor wave 5 would reach 0.618 the length of minor wave 1 (equality with minor wave 1 would breach the invalidation point). This target may be too high though; it would expect a slight overshoot of the lilac trend line which is unlikely.
Intermediate wave (C) is still very likely to make at least a slight new high above the end of intermediate wave (A) at 2,111.05 to avoid a truncation. As soon as upwards movement breaks this point, then look out for a trend change.
ALTERNATE DAILY CHART
Click chart to enlarge.
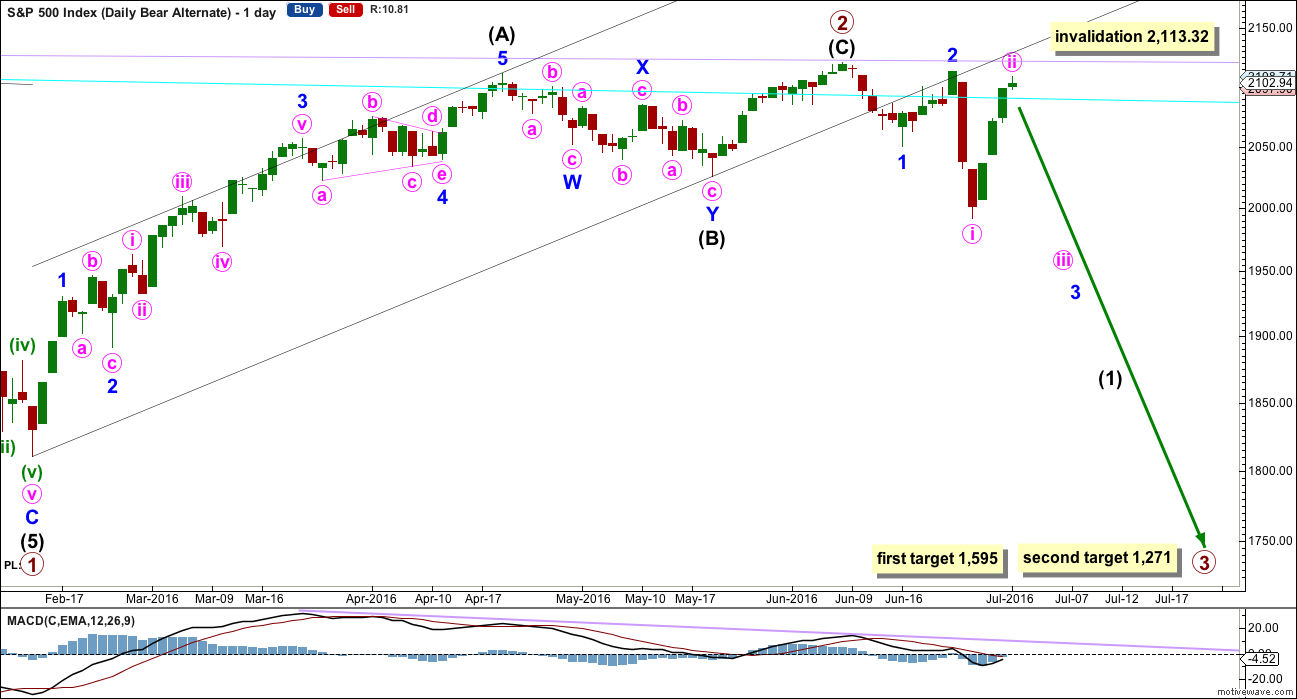
This was the main wave count up to very recently. It is now relegated to a less likely alternate and will remain possible while price remains below 2,113.32. It is possible that upwards movement could end above 2,111.05 and below 2,113.32 which would leave both wave counts valid.
If primary wave 2 was over earlier on 8th of June, then primary wave 3 has begun. At 1,595 primary wave 3 would reach 1.618 the length of primary wave 1. At 1,271 it would reach 2.618 the length of primary wave 1.
Within primary wave 3, now intermediate wave (1) would most likely be incomplete. The middle of it would be extending, now with two overlapping first and second waves.
Minute wave ii may not move beyond the start of minute wave i above 2,113.32.
The problem today is still the size and depth of minute wave ii. Minute wave ii looks too large and too deep for a lower degree correction.
SECOND ALTERNATE DAILY CHART
Click chart to enlarge.
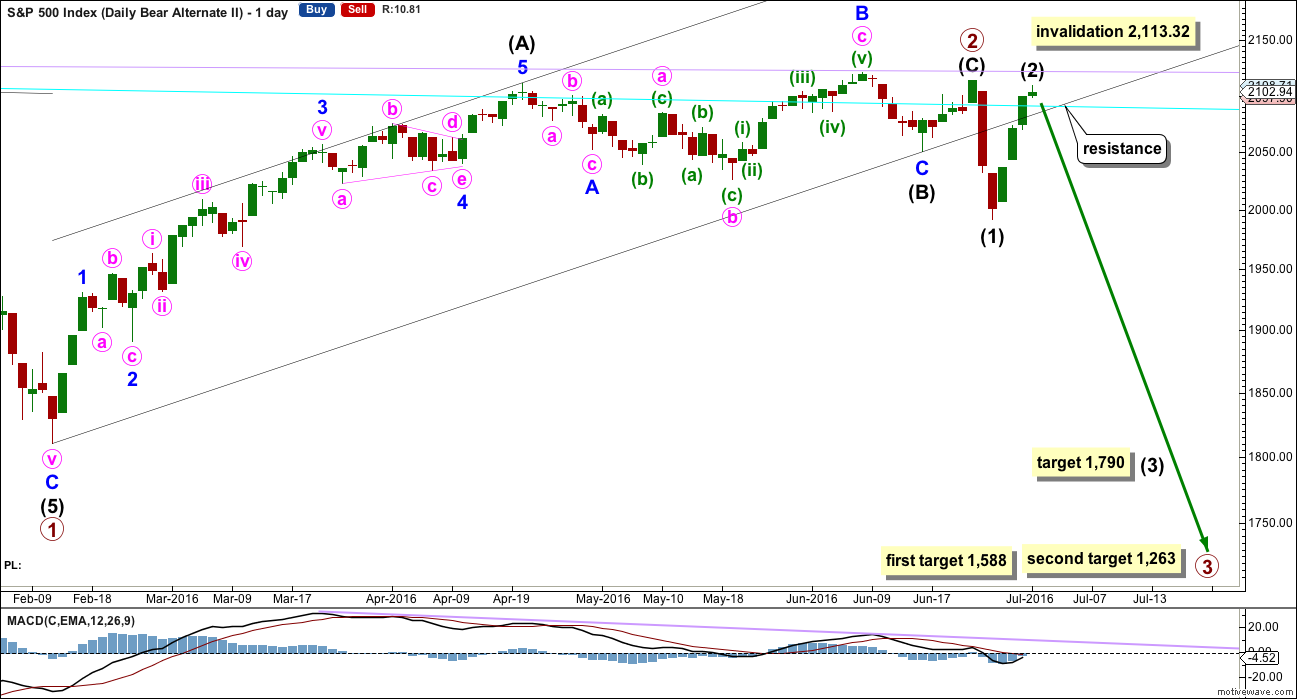
Primary wave 2 may have ended on 23rd of June. Primary wave 3 may have begun there.
Within primary wave 3, intermediate waves (1) and now (2) may be complete.
If upwards movement does not move above 2,111.05, this may be the preferred wave count.
If price begins to move strongly lower when markets open for the new week, then a target would be 1,790 for intermediate wave (3) to reach 2.618 the length of intermediate wave (1). This is the appropriate ratio to calculate the target in this instance because intermediate wave (2) is 0.96 of intermediate wave (1).
This wave count does not look right with the channel about primary wave 2. If that channel is correctly drawn, then intermediate wave (2) would most likely have ended when price came up to touch the lower edge for a typical throwback after a breach.
At 1,588 primary wave 3 would reach 1.618 the length of primary wave 1. At 1,263 primary wave 3 would reach 2.618 the length of primary wave 1. The lower target is more likely because primary wave 2 was very deep.
Intermediate wave (2) for this alternate wave count should be over here. It may not move beyond the start of intermediate wave (1) above 2,113.32.
BULL ELLIOTT WAVE COUNT
WEEKLY CHART
Click chart to enlarge.
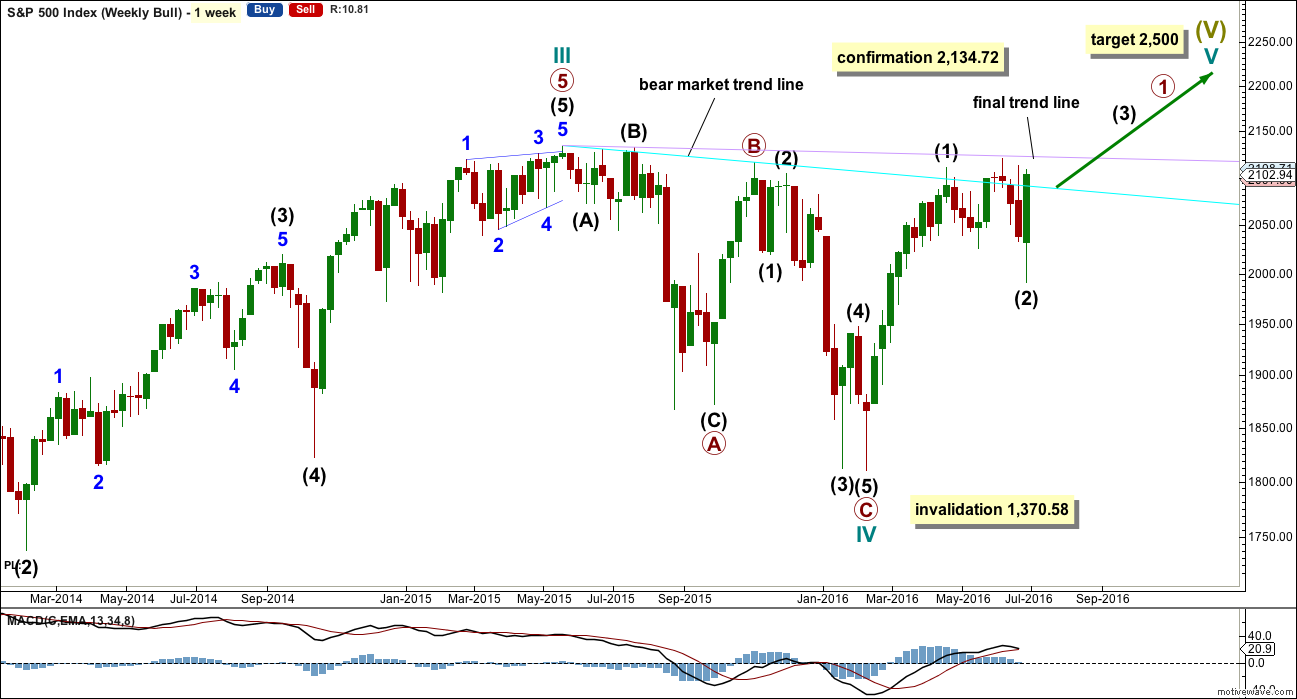
Cycle wave IV is seen as a complete flat correction. Within cycle wave IV, primary wave C is still seen as a five wave impulse.
Intermediate wave (3) has a strong three wave look to it on the weekly and daily charts. For the S&P, a large wave like this one at intermediate degree should look like an impulse at higher time frames. The three wave look substantially reduces the probability of this wave count. Subdivisions have been checked on the hourly chart, which will fit.
Cycle wave II was a shallow 0.41 zigzag lasting three months. Cycle wave IV may be a complete shallow 0.19 regular flat correction, exhibiting some alternation with cycle wave II and lasting nine months. Cycle wave IV would be grossly disproportionate to cycle wave II, and would have to move substantially out of a trend channel on the monthly chart, for it to continue further sideways as a double flat, triangle or combination. For this reason, although it is possible, it looks less likely that cycle wave IV would continue further. It should be over at the low as labelled.
At 2,500 cycle wave V would reach equality in length with cycle wave I.
Price has now broken a little above the bear market trend line. This line is drawn from the all time high at 2,134.72 to the swing high labelled primary wave B at 2,116.48 on November 2015. This line is drawn using the approach outlined by Magee in the classic “Technical Analysis of Stock Trends”. To use it correctly we should assume that a bear market remains intact until this line is breached by a close of 3% or more of market value. Now that the line is breached, the price point at which it is breached is calculated about 2,093.58. 3% of market value above this line would be 2,156.38, which would be above the all time high and the confirmation point.
This wave count requires price confirmation with a new all time high above 2,134.72.
While price has not made a new high, while it remains below the final trend line (lilac) and while technical indicators point to weakness in upwards movement, this very bullish wave count comes with a strong caveat. I still do not have confidence in it. It is produced as an alternate, because all possibilities must be considered. Price managed to keep making new highs for years on light and declining volume, so it is possible that this pattern may continue to new all time highs for cycle wave V.
The invalidation point will remain on the weekly chart at 1,370.58. Cycle wave IV may not move into cycle wave I price territory.
This invalidation point allows for the possibility that cycle wave IV may not be complete and may continue sideways for another one to two years as a double flat or double combination. Because both double flats and double combinations are both sideways movements, a new low substantially below the end of primary wave C at 1,810.10 should see this wave count discarded on the basis of a very low probability long before price makes a new low below 1,370.58.
DAILY CHART
Click chart to enlarge.
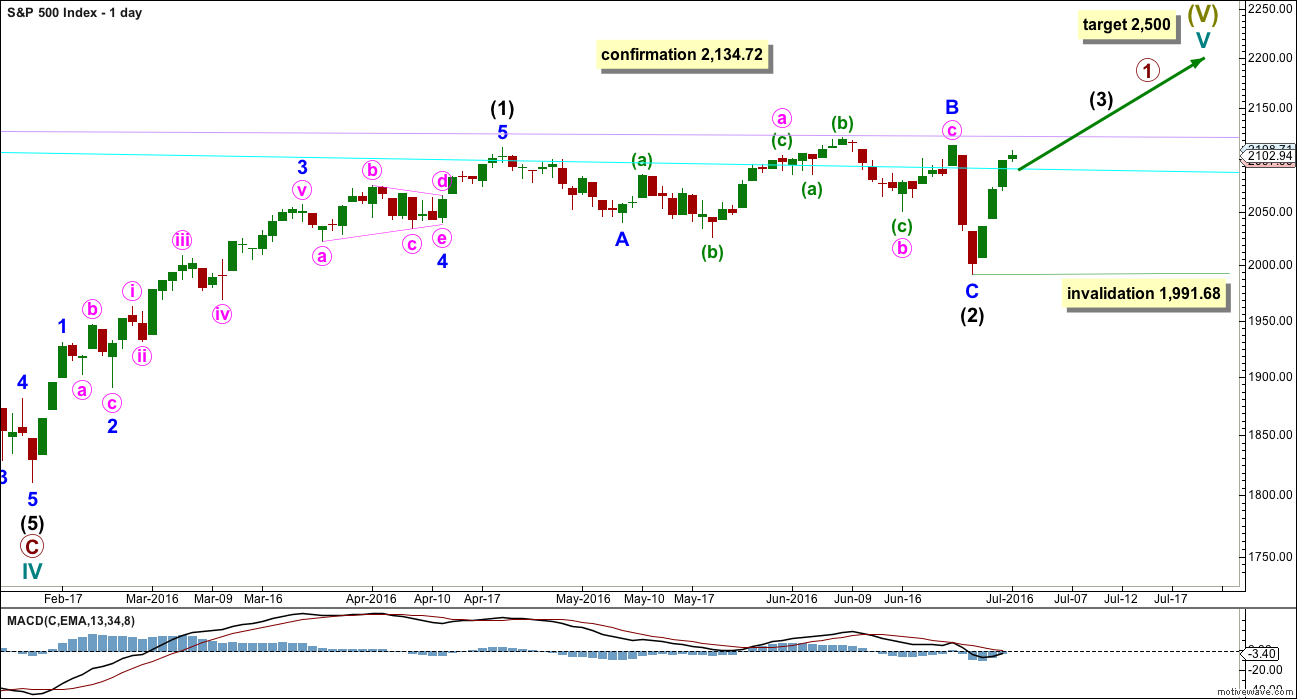
Intermediate wave (2) may be over, so intermediate wave (3) upwards may be underway. Within intermediate wave (3), no second wave correction may move beyond the start of its first wave below 1,991.68.
Intermediate wave (2) now has better proportion in terms of duration to intermediate wave (1), but it is still more shallow than the first second wave within a new bull trend normally is. Here, it would be only 0.40 the length of intermediate wave (1).
This wave count absolutely requires a new all time high before any confidence may be had in it.
TECHNICAL ANALYSIS
MONTHLY CHART
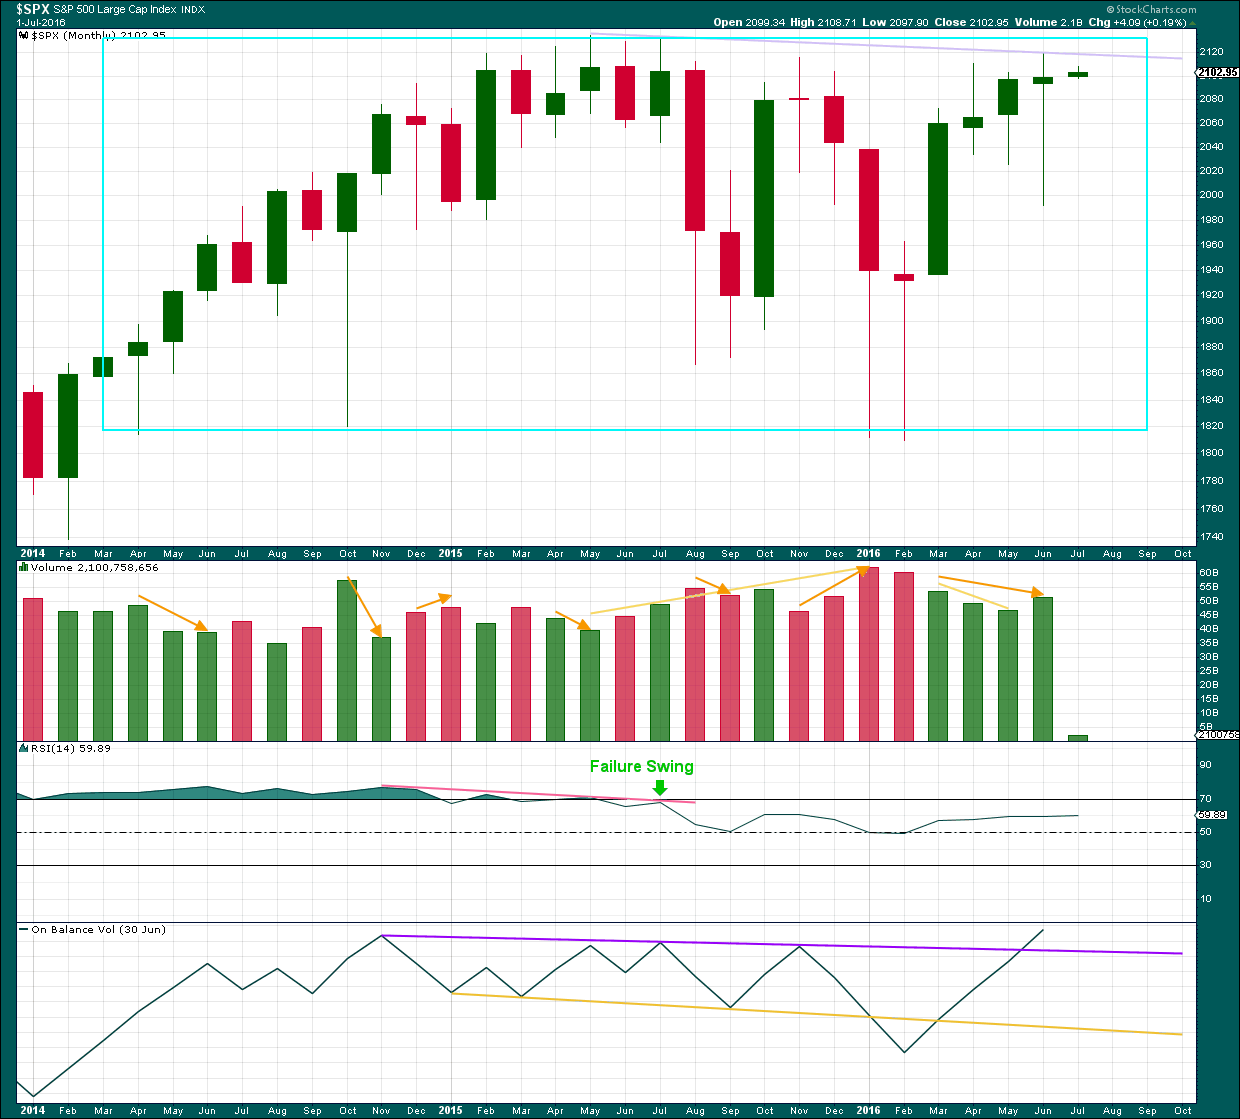
Click chart to enlarge. Chart courtesy of StockCharts.com.
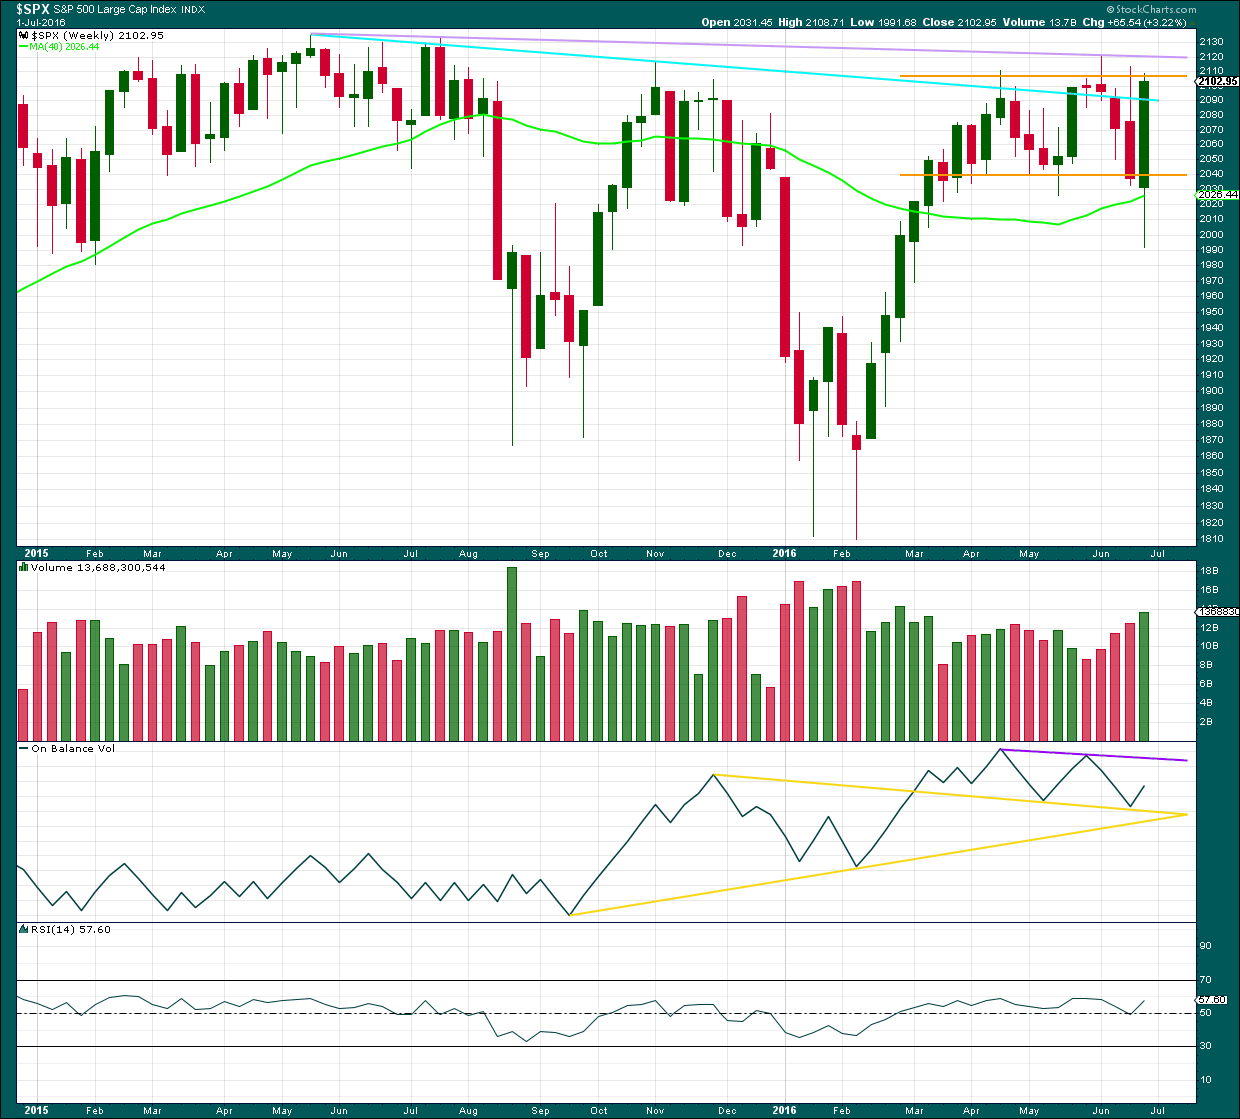
The S&P has been range bound for a remarkably long period of time, illustrated by the large cyan box. Price will break out of the box eventually and volume may offer a clue as to which direction that may be in. During this sideways range, it is the two downwards months of January and February 2016 which have strongest volume. This indicates a downwards breakout is more likely than upwards.
During this range bound movement, price came on declining volume (look at a longer time frame to see how clear this is from July 2009 to May 2015) as price moved up to the all time high. The rise in price was not supported by volume, so it was suspicious.
During this range bound movement, each multi month instance of upwards movement comes on declining volume. All but one multi month instance of downwards movement came with increasing volume. The volume profile at the monthly chart level is bearish.
The month of June is now over and saw some increase in volume. This includes an options expiry date though, so to properly analyse volume for the month of June look inside the month at the daily time frame.
June’s monthly candlestick completes a long legged candlestick with a small real body. The body is a little too big for this to be considered a doji (this is entirely a subjective opinion though; members are free to disagree with my judgement here), and the upper wick is too long for it to be considered a hanging man. The long lower wick is bullish as is the body colour of green. Coming after two smaller real bodies, the significance of this very small (almost doji) real body is lessened. It does not look like a reversal pattern; it looks more bullish than bearish. However, it would require confirmation before it could be viewed as a strong bullish signal, because it comes at an extremely important point close to the all time high.
On Balance Volume broke above the purple trend line in June. This is also a bullish signal. However, the last strong bearish signal from OBV with a break below the yellow line was not as significant as first thought. OBV moved back above that line and now has broken above the purple line. This break should be viewed as a weak bullish signal.
There is now hidden bearish divergence between OBV and price from the all time high. OBV has made a higher high but price has not. This indicates weakness in price.
WEEKLY CHART
Click chart to enlarge. Chart courtesy of StockCharts.com.
This week closes with a very strong Bullish Engulfing candlestick pattern, but there are two problems with this. This candlestick pattern comes within a trading range. Candlestick patterns during consolidations are not reliable reversal signals. It could be interpreted as bullish, but for more confidence that it is bullish a breakout above resistance (orange lines) on a day with increased volume should be seen.
The long lower wick of this candlestick is also bullish.
Price is back well within the range delineated by orange lines, with resistance about 2,107 and support about 2,040. To see what volume is doing during this period, because it includes one options expiry date and the strong volume of two downwards days within the last week, volume analysis would be better done at the daily chart level.
On Balance Volume is still constrained below the purple line and above the yellow line. A breakout by OBV may precede a breakout by price.
There is no divergence between price and RSI at this time to indicate weakness either way.
DAILY CHART
Click chart to enlarge. Chart courtesy of StockCharts.com.
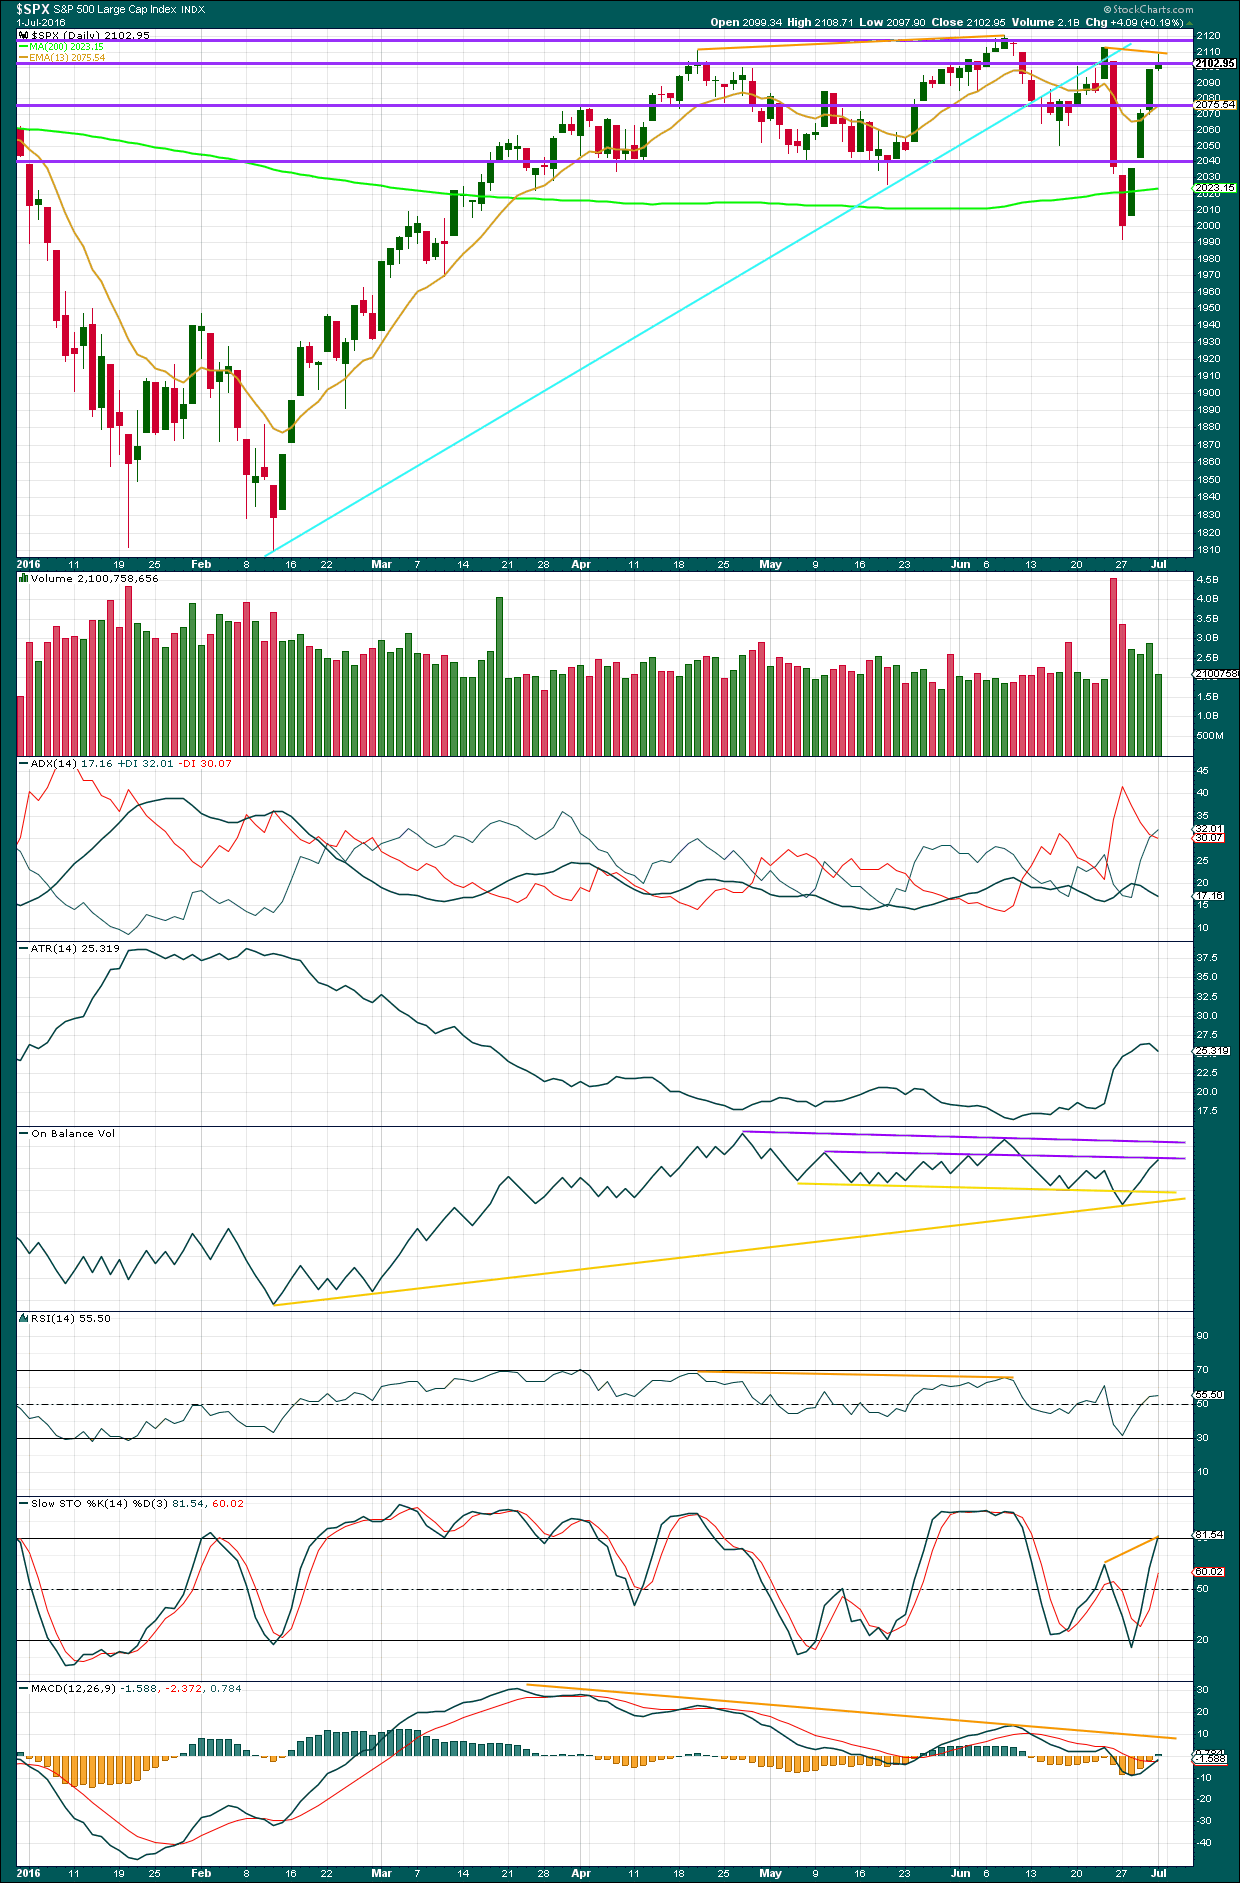
Volume for Friday’s session is very light. Volume for the last four upwards days is lighter than the prior two downwards days, and at the end of the week volume is declining. The volume profile continues to be bearish.
During the consolidation which began back in about March, it is three downwards days which have strongest volume. This suggests a downwards breakout is more likely than upwards.
The break below support on high volume looked like a downwards breakout, but it was false as price is now back within the consolidation zone.
The small real body and relatively long upper shadow on Friday’s candlestick indicates the bulls are tiring.
Price may be expected to find strong resistance about 2,120.
ADX is declining indicating the market is not trending. The -DX line has crossed below the +DX line indicating a possible trend change from down to up. ATR is in agreement at the end of the week; it too is beginning to decline. It is indicative that again as price rises ATR begins to decline; this is not normal of a trending market.
On Balance Volume has come up to touch the first purple line. This may offer some resistance, but this line has been breached before only for OBV to then return back below it. A break above this line would be only a weak bullish signal. A break above the upper purple line would be a strong bullish signal. A break below the lower yellow line would be a strong bearish signal.
RSI is close to neutral and exhibits no divergence with price at the end of the week to indicate weakness in either direction. There is plenty of room for price to rise or fall.
Stochastics is entering overbought and does exhibit divergence with price. Stochastics made a new high above the prior swing high of 23rd of June, but price did not. This indicates weakness in price.
There is divergence between price and MACD and RSI between the highs of 20th of April and 8th of June. This indicates weakness in upwards movement. So far price has made lower lows and lower highs since the high of 8th of June.
Overall, there is again more bullishness at the end of this week. But, on balance, the picture is still bearish, particularly volume.
VOLATILITY – INVERTED VIX MONTHLY CHART
Click chart to enlarge. Chart courtesy of StockCharts.com.
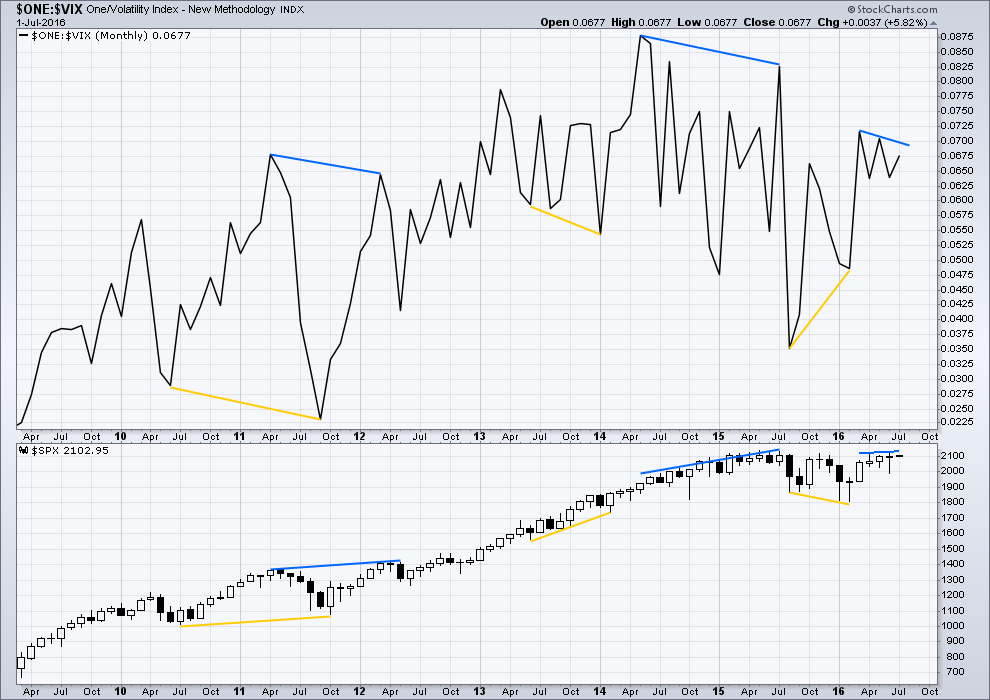
Several instances of large divergence between price and VIX (inverted) are noted here. Blue is bearish divergence and yellow is bullish divergence (rather than red and green, for our colour blind members).
Volatility declines as inverted VIX rises, which is normal for a bull market. Volatility increases as inverted VIX declines, which is normal for a bear market. Each time there is strong multi month divergence between price and VIX, it was followed by a strong movement from price: bearish divergence was followed by a fall in price and bullish divergence was followed by a rise in price.
There is still current multi month divergence between price and VIX: from the high in April 2016 price has made new highs but VIX has failed so far to follow with new highs. This regular bearish divergence still indicates weakness in price.
VOLATILITY – INVERTED VIX DAILY CHART
Click chart to enlarge. Chart courtesy of StockCharts.com.
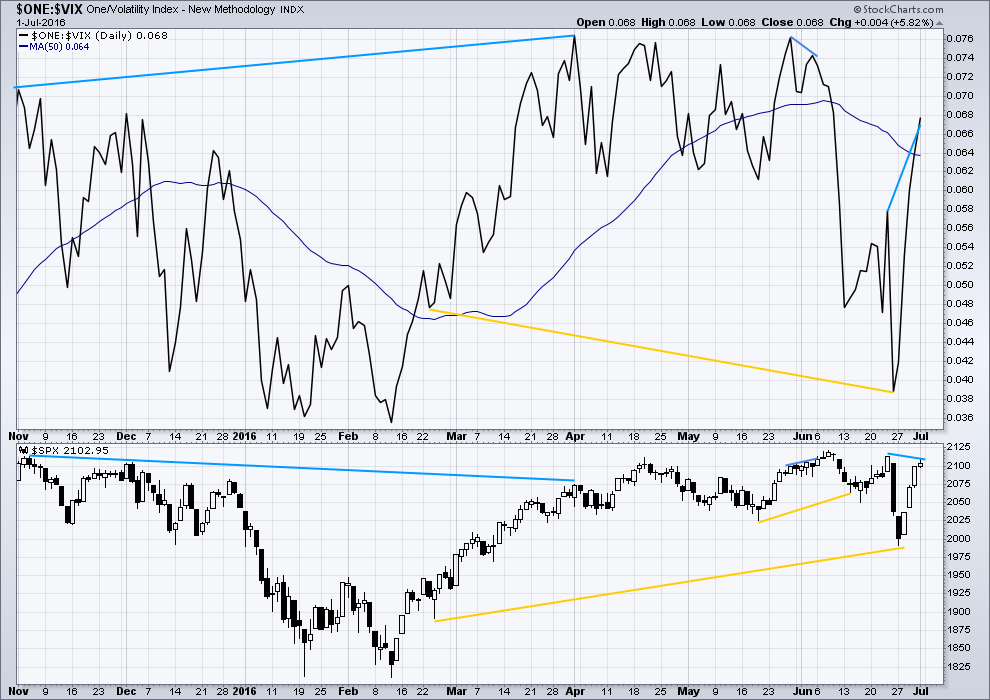
There is an instance of longer term possible hidden bullish divergence noted here between price and inverted VIX with longer yellow lines. From the low of 24th February, volatility has strongly increased yet this has not yet translated into corresponding lows for price. This bullish divergence may now be resolved by some upwards movement from price over the last two days.
There is today a new instance of hidden bearish divergence between VIX (inverted) and price. As price moved higher over the last four days inverted VIX also moved higher, which indicates volatility has declined. This is normal and should be expected. What is not normal here though is the decline in volatility is stronger than where it was for 23rd June. This indicates weakness in upwards movement from price.
There was an earlier instance of short term hidden bearish divergence between VIX and price, shown here by short blue lines on both from 27th of May to 3rd of June. That was followed by some downwards movement, but it did not happen immediately. Price limped along upwards in a very small range for three days before turning. It is entirely possible that this may happen again. This current divergence indicates weakness and should be taken very seriously, but it cannot tell us that price must turn here.
While I would not give much weight to divergence between price and many oscillators, such as Stochastics, I will give weight to divergence between price and VIX. Analysis of the monthly chart for the last year and a half shows it to be fairly reliable.
BREADTH – ADVANCE DECLINE LINE
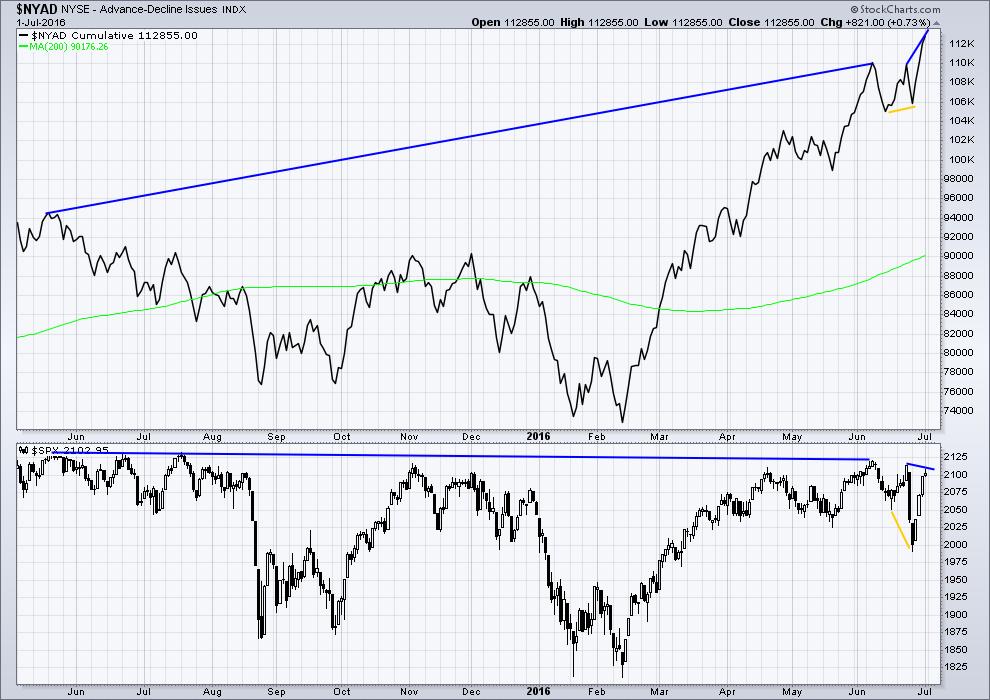
Click chart to enlarge. Chart courtesy of StockCharts.com.
With the AD line increasing, this indicates the number of advancing stocks exceeds the number of declining stocks. This indicates that there is breadth to prior upwards movement.
Taking a look at the bigger picture, the AD line is making substantial new highs but price so far has not. While market breadth is increasing beyond the point it was at in May 2015, this has not translated (yet) into a corresponding rise in price. Price is weak. This is hidden bearish divergence (long blue lines).
There is divergence between price and the AD line indicated by short yellow lines. Price made new lows but the AD line failed to make corresponding new lows. This indicates some weakness to downwards movement from price. There is less breadth to downwards movement this time. This divergence is bullish and also supports the hourly Elliott wave count. Upwards movement over the last four days may be enough to resolve this bullish divergence.
The AD line has now made a new high above its prior high of 23rd of June yet price has not made a corresponding new high (short blue lines). This divergence now is bearish. It indicates that price is weak. It has persisted now for three days.
DOW THEORY
The last major lows within the bull market are noted below. Both the industrials and transportation indicies have closed below these price points on a daily closing basis; original Dow Theory has confirmed a bear market. By adding in the S&P500 and Nasdaq a modified Dow Theory has not confirmed a new bear market.
Within the new bear market, major highs are noted. For original Dow Theory to confirm the end of the current bear market and the start of a new bull market, the transportation index needs to confirm. It has not done so yet.
Major lows within the prior bull market:
DJIA: 15,855.12 (15th October, 2014) – closed below on 25th August, 2015.
DJT: 7,700.49 (12th October, 2014) – closed below on 24th August, 2015.
S&P500: 1,821.61 (15th October, 2014) – has not closed below this point yet.
Nasdaq: 4,117.84 (15th October, 2014) – has not closed below this point yet.
Major highs within the new bear market:
DJIA: 17,977.85 (4th November, 2015) – closed above on 18th April, 2016.
DJT: 8,358.20 (20th November, 2015) – has not closed above this point yet.
S&P500: 2,116.48 (3rd Nobember, 2015) – has now closed above this point on 8th June, 2016.
Nasdaq: 5,176.77 (2nd December, 2015) – has not closed above this point yet.
It is a reasonable conclusion that the indices are currently in a bear market. The trend remains the same until proven otherwise. Dow Theory is one of the oldest and simplest of all technical analysis methods. It is often accused of being late because it requires huge price movements to confirm a change from bull to bear. In this instance, it is interesting that so many analysts remain bullish while Dow Theory has confirmed a bear market. It is my personal opinion that Dow Theory should not be accused of being late as it seems to be ignored when it does not give the conclusion so many analysts want to see.
This analysis is published @ 07:30 p.m. EST on 2nd July, 2016.
Futures tanking atm
I hope this cycle pattern isn’t accurate!
Daily SPX chart. Bearish megaphone also called a Broadening Top pattern. Thoughts anyone? Expanding triangle for EW?
Good description/criteria at this link:
http://www.trending123.com/patterns/reverse_symmetrical_triangle.html
Is the (X) label part of a W-X-Y correction?
How do you calculate the target price on a breakout? The article did not indicate.
yes, see posted charts way below
I thought that might be so.But failed to check first. Sorry and thanks for the clarification.
One point about it is that it is a relatively rare formation. However, that is what we have going on from the 1999-2000 peak.
No, in EW terms X as an expanding triangle makes no sense.
An expanding triangle in that position may not be a second wave. It may only be a B wave of a zigzag trending up.
It just doesn’t make sense in terms of the bullish wave count, unless X is moving higher as a zigzag and the expanding triangle is wave B within a zigzag for X.
The triangle would be incomplete too.
Expanding triangles are the rarest EW structures. Not just rare, but the rarest.
First idea on 5 min chart this morning…
Alternation between ii and iv; an expanded flat and a running triangle. I’m not sure about that flat though.
And now we would be in minuette (2)?
Six minutes before the close. Minuette (2) may be done. If so, tomorrow might be another gap and go day.
Yep. Minuette (i) down complete, minuette (ii) now may unfold up. Or it could be over as a brief shallow correction… if that’s the case I think I’d move it all down one degree.
Did anyone else take that EURUSD trade I put charts up for a few days ago? It came back up to touch that trend line for a perfect throwback, and today has moved strongly lower. Trades should now be positive.
Good morning everybody. I see a gap and go down… and stalling about 2,080.
This is just one day though. Remember the charts of P3 in the last bear market? Deep second wave corrections. ATR about 20 – 30 for ages. And ages.
Don’t expect this one to just fall off a cliff immediately. It may behave like the last one. Please do study that time period on a daily chart.
My problem today, is which daily wave count is correct? The main would now have a truncation, that reduces probability. This movement isn’t strong enough for the first alternate… maybe the second alternate fits best.
Yep, wave 4 confusion….a person on shrooms could do an EW count better than us. Ha!
UVXY perfect bounce with hammer at 9.47….
This move up should definitely reverse before the close, leaving this morning’s gap down open unfilled….UVXY coming back down to test prior resistance at around 9.40-9.50 should be followed by a continued march higher…a collapse back below 9.00 spells trouble for the immediate bearish case imo…
IWM will again lead lower in all probability…
just exited all my short positions.
this usually signals a great time to short.
I agree with vern’s earlier conclusion… if you have to ask if this is a third wave down…
Olga – I miss you.
Ditto Ditto
🙂
I think she’s partying in Ibiza? 😉
Will I do?
No – only because you’re not up at 7am Chicago time!
Are you nuts??!! Of course Lara is well worth waiting for!!! 🙂 🙂 🙂
Not that I don’t miss dear Olga mind you….
LOL
We all miss Olga. I’m sure she’ll be back when this market makes up its mind.
I’m up just after 6am my time, but it does take a little while for the coffee to hit the brain before I can make any comment….
That is probably very wise. I know it is for me.
And I agree, “Yes” you will always ‘do’. You are why I am here. Everyone and everything else is frosting on the cake.
A UVXY close above 10.00 is imo a go…
Left some money on the table from my bull put spread…not the first time! 🙂
Here is my count so far today.
Thanks for chart.
Agree with count.
Now let’s get an extended fifth wave that knocks out 2070 and sends UVXY blasting past 10.00….
UST Yields Lower and the Dollar Stronger today!
A stronger dollar in this situation is unusual! Sign that someone is running from something that is about to Blow UP!
Looks like we have a break of the 2084 support shelf with a quick rally back to test underside. 2080 should rapidly fall if this is the real deal. If it does I am back to fully short short term….
No one has mentioned oil down over 5% today. This is what’s really going to take the markets down IMHO… Good start for an oil free fall. I don’t think we’re going to have huge 3% candlesticks down in the US indices like we had 10 days ago. It’s going to be more likely a long, daily grind down down down; more like today but for an extended period of time… with acceleration only when oil goes below 40.
Exciting to see this unfold as a Bear 🙂
Maybe. It could be the market falling under its own weight, furiously being back-stopped by the banksters. I am still a bit perplexed by the lack of selling pressure.Maybe the banksters have the bears completely intimidated after that furious run-up after Brexit…. 🙂
Maybe that, or more likely the bears are still hung over from all the booze over the long holiday. Booze and the heat will definitely make you hung over for a day or two 🙂
Short COP and I am a “padawan”, my first time posting stockcharts, I hope below works…
http://stockcharts.com/h-sc/ui?s=COP&p=D&b=5&g=0&id=p41620366540&a=465123083&listNum=1
http://stockcharts.com/h-sc/ui?s=$WTIC&p=D&b=5&g=0&id=p77684586191&a=463352076&listNum=1
COP certainly looks like its stock price is in trouble, hope you make some big $$$ on the trade!
UVXY just broke above 9.45; just in time for a price on close of spread. We have seen this attempt at a breakout before, only to have it get sold hard. Let’s see if 9.45- 9.50 now acts as support…
Filled at 1.34 on buy-back of UVXY 10.00 strike puts I sold for average of 1.66 still holding 5 strike puts just in case…will reload below SPX 2080…
Interesting article on Italy….Dominoes are about to fall?!
Something to read until this bear flag (on the 5 minute chart) resolves itself….should be to the downside. Either later this afternoon or tomorrow. Although I think it will be this afternoon.
http://www.investing.com/news/stock-market-news/financial,-political-instability-in-italy-threatens-fresh-chaos-for-europe-412554
Italy does indeed look like it will implode. Atm, DAX is down 1.82% vs .9% for SPX. Also have to wonder if DB will get burned by Italy exposure – they look to be goners already and Italy going down could put them over the edge. Of course Merkel would likely have to bail out DB. The dominoes would indeed go flying…
Remembering DAX topped out in April 2015, the US markets topped out in May 2015. We’ve really been following them, and the USDJPY.
I always thought the real impact of Brexit would first be seen in the DAX. Germany has by far, the most to loose by EU fragmentation. US markets will likely play catch up…
I have seen enough meandering for one day. If you have to ask whether it is a third down….
Closing my UVXY 10/5 strike spread for a miniscule gain. UVXY made its fourth failed attempt to clear the 9.40 phalanx of sellers without success. Going to cash short term. Time to SOH….
Weekly SP 500 CFD chart. Other strong resistance points in addition to the EW ones are shown. 1st resistance line of upper Fork tine is strong an holding, 2nd resistance (trigger line) at an EW point of 2120ish.
And 82% of the time price will go back down to the middle line. I went out 2 weeks and the red middle line price point is about 1912. If it breaks through there hard then you know we’re in some degree of wave 3 down, even though as posted below it could within a larger A, or E, wave. The Fork is down on a weekly chart from the May 2015 high = bear market now for ~14 months.
Today a great example of how short selling can distort the UVXY derivative; VIX up 10%, the former barely up by half as much. If we are in an impulse down it should catch up as they cover…
Because the shorts will be reverse split to the point where they can’t lose in that vehicle and where longs can’t profit.
Agree, why would a short cover – even if UVXY goes to 50 in the short term, it will revert back lower, grinding itself into dust in the process. All the price movement just increases the destruction. Longer term UVXY has to go down, regardless of the short term price. UVXY loses value as reliably as the sun rises in the morning.
That is true if we are not in a third impulse down. Short sellers in a third wave down even after a split will still get burned.
I am leaning toward exiting my short positions at the close. This move is really starting to look corrective to me I am afraid….
The selling lacks conviction with a hardening floor at SPX 2084….
Lack of conviction will encourage bulls to BTFD as usual. Need at least a new low of the day. Then a crack of the 208 pivot. Not looking encouraging atm.
This whole structure from the July 1st high could be Minute i down of a larger P3 (or such) down. With a ii up yet to fool us over the next couple of days. Will have to watch volume and the candlestick pattern, etc.
Where we are in the fourth wave of Minute i down right now, five coming, then corrective ii up.
Expanded flat?!
Banksters trying to “manage” the decline. As Peter said we really need a strong break to the downside. Impulsive waves at this degree are not “managed”, they kick butt….or for the more elegant gluetei maximi…. 🙂
A wall of UVXY short sellers at 9.50…
PPT hard at work it would seem… 🙂
We may have an impulse down complete and now in a second wave correction, which so far as I am concerned needs to be short and sweet…staying below around 2091…
Looks like RUT leading the way down. Now we need some momentum to the downside, and particularly a decisive move away from SPX 2100 by at least 30 handles imo..
Watching IWM for directional clues. It should take out 13.64 in the next 15 minutes if the trend is down…
need a good sized break to the down side, or will have to change count from July 1st high point to an a-b-c correction, for another high. Going below 2060 would be a good first start.
Keep in mind US Treasury yields being at all time lows, is a strong indication on what’s going to happen…IMHO.
to a degree imo – but how does one account for the polyglot of money coming in from the large industrial countries who are paying negative interest rates on their bonds? Media stories on it, no secret to it. The large German fund just clicks the button to buy the US bonds instead of the negative interest rate German ones, and the Japanese, and the Italians and the Spanish = our USA interest rates go down. And it is really going to cause trouble for our banks, pensions, insurance companies…thanks Europe but we just want your beer, wine and olive oil instead.
Not to mention the flood of Chinese money looking for safe harbor…
Don’t forget the anchovies from Catalunya… 🙂
UST 30 Year at these levels means DOOM! Bond money has been and will always be the smartest money! The signal that R & D is here was confirmed below a 2.50% yield.
Now at a 2.133% Yield at a new low!
Any stock guy/gal NOT paying attention to that fact will blow up his/her portfolio or trading account if not fast to react!
UST 30 Year Sub 2.00% Yield is coming in conjunction with a decline in US equity prices.
Yes, I agree. And just think that the bond market as well as the Fed have no place really to hide and make another attempt at QE. This whole topping process has been distribution. The QE has to be unwniding.
If we don’t break 2070 today, I will be moving firmly to the sidelines. Banksters or no banksters, nobody arrests third waves down in a larger primary degree trend, certainly not an intermediate third wave down. I would have to assume the move down is corrective absent a decisive take-out of 2070…IWM poking back above 113.64 so the meandering looks to continue for now…
I meant of course 113.64…
Looks to me that either way, we should be on the receiving end of a W3 down of some degree here. The longer price lingers around, the more likely it will go higher Still. With that in mind, my options tactics are ratio spreads in the puts ( large profit zone below, small profit zone above price). We’ll see.
I am not at all convinced this is the impulse down we are expecting. We have been here too often. Once the meandering and hesitancy sets in it is almost always a prelude to a bankster induced run higher. Not liking this price action one bit and my finger is hovering over the eject button on my spread trades…
Keeping a close eye on the 5 minute chart and anything over a 50% retrace and I am out…
Looks like Lara’s alternate charts are in play. Big question is it first alternate or second alternate?
For an intermediate three down, this morning’s gaps should be break-away gaps and not come anywhere close to being filled today. Anything more than a .38 retrace would in my opinion eliminate the second alternate..
This is my 1 minute SPX chart to start the week.
Nice start today for the bears. In wave iii of my count. With this count and the gap down open, I do not think we will see a throwback to the lower channel trendline.
Yep. UVXY gap open from 8.85 Friday close should remain unfilled for quite some time if we are indeed at the start of, or continuation of an impulse down.
30 Year US Treasury low this morning was a 2.14% Yield
ATM 2.159% Yield……………… Look out…. something is about to blow up!
Interesting SPY rounding profile with volume references that may still have merit. Reminds me of Lara’s comments…
https://www.tradingview.com/chart/SPY/1Ftt7b0q-How-to-play-the-S-P-500/
Another SPY view close up…
https://www.tradingview.com/chart/SPY/1WyBBSBU-SPY-Hitting-Head-on-Resistance/
Putting SPY into perspective…
https://www.tradingview.com/chart/SPY/WiLD0OSK-Putting-Spy-Into-Perspective/
Italian banks showing further stress this weekend…
http://www.zerohedge.com/news/2016-07-04/italian-banks-tumble-monte-paschi-plunges-record-low-after-ecb-letter
For those into Astrology, here is what is being predicted…
http://bradleysiderograph.com/2016-turn-dates-sp500/
Here is SPHB (High Beta Stocks of the S&P 500) Pitchfork style for a point-of-reference. I am hoping these high Beta stocks can give us a clue as to what will happen next…
A friend notified me of this, a classic bearish megaphone chart pattern. 4hr chart.
Of course you know what it is yelling right?
ROYAL CANADIAN!
Where? Sorry, I do not see any of these fella’s in the chart 🙂
🙂
Here is how I will trade the upcoming UVXY split. We are either in a third wave up, or in or very close to a third wave down. Either possibility portends a powerful and protracted move in one direction or the other. It should be clear by July 25 in which dirrection the wave is unfolding. I am holding a gigantic position by way of a July 15 expiration bull 10/5 strike put spread with an break-even UVXY price at 8.50. If we are in third wave up, 8.50 should be summarily taken out in the next trading day or two and the announcement of the reverse split ordinarily would suggest that it is going to take a dive, if for no other reason that lots of eager beavers are going to view the announcement of the reverse split as a license to short the living daylights out of it. I will consider a CLOSE below 8.50 as confirmatory of the bullish case for stocks, and the bearish case for volatility, and if that happens, I will be closing the spread trade with a loss on the position and shorting UVXY.
On the other hand, if the bearish count is correct, we may see an new intra-day 52 week low in UVXY on Tuesday, but it really should reverse sharply higher and head back towards 10.00. The reverse split 10 January 2014 took place just ahead of a huge run to the upside so that event is not always bearish for UVXY. It should be very clear by the end of trading on Tuesday what is unfolding. Quite a few indices are at critical trend-lines and we are really in a make-or-break situation wrt market direction. Many bears were sent running for the hills by market action the last four days so things should be most interesting this week!
Appreciate the details on UVXY. Then on the lighter side, there is a new moon tonight, and Will Smith’s Independence Day II movie failed at the box office. Sign of the times.
Surprising as he used to be box office sure thing. It seems as if he has had a few weak offerings of late…
Will Smith actually isn’t part of the cast- rumor has it he asked for too much money…maybe they should have paid up!
That certainly explains a lot. The producers are very foolish. I don’t know what he was asking but no doubt that decision cost them hundreds of millions, if not more. A sequel to that movie without Will Smith like thunder without lightning, Christmas without presents, White Russian without Smirnoff…etc. etc.. 🙂
Bulls ran me over on that short…
Minus 6 points.
Going to SOH until some clarity arises
I am looking for a big bearish engulfing candle on the daily chart. We should see something fairly definitive ahead of a big P3 to the donwside to negate that long lower wick we saw at the low last week. The strength of this run-up to me suggests the if it is indeed a counter-trend move, the reversal should be equally as dramatic. The banksters cannot sustain the appearances of a false break-out for very long. So far we still have a lower low, and a lower high, despite all the bullish appearances of this latest move…
The SPX pivot should also really be surrendered by tomorrow’s close. Any consolidation that keeps it in striking distance will have me out of bearish trades, even if UVXY stays above 8.50. I have learned not to ignore the price action around these round numbers. They are right about future direction, at least in the short to mid term 90% of the time…..
For what it is worth here is the latest forecast using A.I. for SPX.
“Started in 1997, the Financial Forecast Center began as an offshoot of the application of artificial intelligence (AI) to the development and manufacture of chemicals in the U.S. After demonstrating the powerful capabilities of artificial intelligence to help drive the development of polymers, the science of artificial intelligence was applied to the modelling and prediction of financial markets and economics with much success.
FFC relies exclusively on artificial intelligence and machine learning to analyse, model and forecast all of the various indicators published at forecasts.org. All forecasts are generated in-house using AI applied to global, long-range data.”
http://www.forecasts.org/stpoor.htm
Here is the NASDAQ projections…
http://www.forecasts.org/nasd.htm
Posting an alternative count shown on the weekly SPX. I posted this awhile back, maybe a month ago or so. Same direction as Lara’s bear count(s) but I believe we are in a very large double zigzag to the downside. The whole structure from the May 2015 top being Primary IV. In short we should not go above the (X) high of 2120.52. Then the second A down, which I believe we are in now, typically ends at or near where the last C did. The last C ended at 1810.11. The ending second C of (Y) target is 1796.11. Then Primary V up. I am not aware of any EW counter who has gotten these counts right from the May 2015 top. There has been constant changing of the counts (Prechter, Nate’s, Caldero being right up there on the top of the list), second guessing, confusion, fogginess = a fourth wave.
Spending time with family thus will defer posting more details on this until our 4th of July holiday is over.
To add: can’t rule out the second part from the (X) turns into a triangle correction. Then, we would not reach as low of price targets as if it were a zigzag. This is thinking if the first part of IV which has already completed is a flat correction pattern. Overall point though Primary IV is long from over with, going way into 2017 yet.
2nd alternative count, weekly SPX chart showing an expanding triangle. Key point: if this is the count versus the other one I posted just above then it would make sense for wave D to go back up to 2134 first. Which would give the triangle a better rising top trendline. Then wave E down to complete Primary IV. Same bottom line: Primary IV is not over with yet and we have been in a bear market since May 2015. Of interest we had this pattern back in the 1965-1975 era. Damm hippies.
Talk about turbulent times 65-75. Yes indeed. A lot changed during that decade. I certainly remember the Hippie movement / life. Got the long hair but never lived in a commune.
Regarding your second / alternate wave count just above, last I saw about a month ago, another EW analyst (who I used to follow) not mentioned above, is using a very similar wave count. It is calling for an ‘e’ wave to break to new lows below 1810 which started last week or so. When that is done his count calls for a completion of the bull market up to around 2500 SPX. He has been using this count since last September or so.
Now this idea, yes. This is a good alternate for the bull wave count.
The subdivisions all fit and it meets all EW rules. Cycle IV would have alternation as an expanding triangle with the single zigzag of cycle II.
If price makes a new low below 1,810.1 then this will probably be my wave count for the bull. It will still be an alternate.
The only problem with this wave count is it still has a low probability. The reason why I haven’t published a possible expanding triangle for cycle IV is expanding triangles are the rarest EW structure. In my years of daily EW analysis I think I’ve only ever seen two (which in hindsight were definitely expanding triangles).
They’re rarer than triples and much rarer than running flats.
The rarity means the probability must necessarily be very low. So it will be my last resort idea for the bull wave count.
thoughts: we’re on the same page, but I’m calling both alternative counts as being in a bear market. Bear because price has gone down for ~13 months now, and as mentioned will continue down for the second “act” of Primary IV. So a very long/large corrective wave IV down = bear market. Will turn back into a bull market when wave V begins (splitting hairs I know).
Hi Peter:
I am curious as to whether you consider macro-ecomomic conditions when you analyse the wave structure and try to determine likely price direction, bull or bear…
Yes, and I consider everything, am a voracious reader. In addition to trading, in my younger days I assisted the IMF in helping emerging countries develop economic plans/models for sound economies. Costa Rica is ‘one of mine’ (along with 100 other guys, ha!), the Philippines another, Hungary another. In addition to a BA in Economics I did advance work at King’s College in London: International Finance and Monetary Systems, and further work at University Cal-Irvine. Only saying this as I study the fundamentals too, in depth.
Fundamentals to TA to social moods. What you and others have wrote the tricky part for all of us traders is the banksters huge funny monies which have and are still flooding the markets worldwide. Plus their other phony shenanigans such as negative interest rates. Skews everything. But this started a long time ago, again as you know, when Nixon took us off the gold standard fiat money was born. It is just that our economic engine is so strong (USA’s) everything has kept moving along now for 42 years (Nixon 1974 fiat money creation). Whose says it can’t go another 5, 10 or 15 years? Taken all together though a Primary 3 down is not coming at this time imo, down yes, but only to complete a IV corrective wave. It has only corrected ~15% of Primary III (depending on which index you’re looking at). It is just not enough price action down yet. Especially as Lara pointed out the correction since May 2015 has been sideways. The trendlines are downward still, but price is very close to the all time high.
why is the lower trendline downsloping in this graph but near horizontal in the previous? Looks like different data.
Thanks Peter. Your point about the torpidity of the presumed P3 to the downside is very well taken. The way price is continually being arrested also poses a concern for me personally- quite a few false starts and what one would indeed expect in a corrective wave four of some kind. It is truly remarkable how effective the banksters have been in absolutely stifling downward momentum and this is not what I would expect in a third wave down at primary degree. Obviously the 1991.68 and 1810.1 price points are of utmost importance. If price again fails to take these out on the next wave down I am going to start to consider the fourth wave option more seriously. Thanks again for the detailed responses- some pedigree! 🙂
To Jeffrey’s question: The first chart posted is of the SPX index; the second chart is of the S&P 500 CFD contract. I typed the incorrect contract in the text of the second chart.
And I would change the first chart to saying the A-B-C pattern shown is a flat, not a zigzag. Then the (X) up, now probable a long zigzag down to complete Primary IV.
The problem with this wave count (double zigzag) is it doesn’t look at all like a double zigzag.
Within a double zigzag the second zigzag exists to deepen the correction because the first didn’t move price deep enough. The whole structure should have a clear downwards slope (for a correction in a bull market). This is sideways.
X waves within double zigzags are brief and shallow. They aren’t deep like this one.
It looks more like a double combination, which are sideways structures. Their X waves are usually very deep and often time consuming and complicated.
The idea doesn’t break any EW rules, but it doesn’t have the right look. So much so that I’m not considering it as having a probability high enough for consideration. It makes no sense.
There is still also the problem that C within the first zigzag doesn’t subdivide as a five well at all; the third wave within it looks like a three on the weekly and daily charts, it should be an impulse and should look like an impulse.
Finally, a double zigzag for cycle IV would give inadequate alternation with the single zigzag of cycle II. Further reducing the probability.
Three points which all reduce probability, so this idea must be judged to have a very very low probability.
thoughts back: sticking with my main point of Primary IV is not over with yet. The exact wave patterns are without doubt tricky to count on this huge, long, large wave IV. Such as, could the first A-B-C be considered a flat? or running flat? then an (X) up, then have a zigzag A-B-C at this time? Also, as u know there are SO many different types of corrective patterns it is extremely difficult to predict what is next, imo. But now the pattern is developing more fully week to week. Who knows too if it is a double, a combination, or even a triple in the end?
If it’s a combination then the first structure could technically be a flat. But it would be a regular flat. They normally have C waves that end a little beyond the A wave, and are sideways. But that one has a C wave which would end substantially below A, not at all sideways.
The second structure wouldn’t meet the rules for a flat, B is < 0.9 X A. For it to continue it'd be a triple. They're very rare.
I was going to say “Fibonacci Five” but Google tells me i am actually toru.
Hey, brilliant! You figured out I was counting in Maori 🙂
Dang, Second.
Rua
Can’t be….best to everyone next week 🙂
Tahi