
Upwards movement broke above 2,050.37 indicating price should continue higher to 2,067.
Upwards movement reached 2,073.13 for the session.
Summary: In the short term, a correction looks to be complete. A third wave down should begin very soon, most likely tomorrow. There is a possibility price could limp slowly higher for one to three days first, but this does look less likely. The short term target is at 1,876. Long term targets remain at 1,595 in the first instance and 1,271 thereafter.
Trading advice (not intended for more experienced members): Traders with less experience may enter short now with stops just above 2,113.32. Do not invest any more than 3-5% on short trades in total. Always use a stop loss. Anyone who hedged with a long position should close here. Any positions opened close to or above 2,113.32 should hold on if your strategy is longer term.
Last published monthly charts are here.
New updates to this analysis are in bold.
BEAR ELLIOTT WAVE COUNT
WEEKLY CHART
Click chart to enlarge.
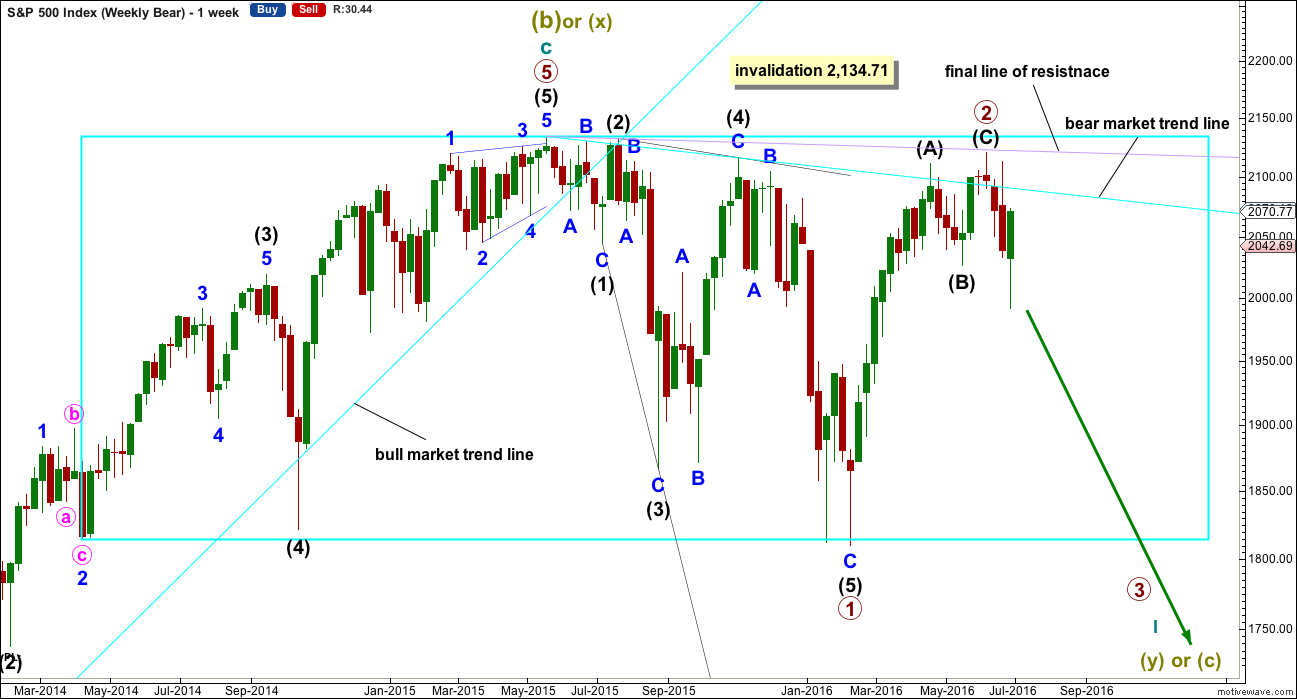
The box is added to the weekly chart. Price has been range bound for months. A breakout will eventually happen. The S&P often forms slow rounding tops, and this looks like what is happening here at a monthly / weekly time frame.
Primary wave 1 is seen as complete as a leading expanding diagonal. Primary wave 2 would be expected to be complete here or very soon indeed.
Leading diagonals are not rare, but they are not very common either. Leading diagonals are more often contracting than expanding. This wave count does not rely on a rare structure, but leading expanding diagonals are not common structures either.
Leading diagonals require sub waves 2 and 4 to be zigzags. Sub waves 1, 3 and 5 are most commonly zigzags but sometimes may appear to be impulses. In this case all subdivisions fit perfectly as zigzags and look like threes on the weekly and daily charts. There are no truncations and no rare structures in this wave count.
The fourth wave must overlap first wave price territory within a diagonal. It may not move beyond the end of the second wave.
Leading diagonals in first wave positions are often followed by very deep second wave corrections. Primary wave 2 would be the most common structure for a second wave, a zigzag, and fits the description of very deep. It may not move beyond the start of primary wave 1 above 2,134.72.
So far it looks like price is finding resistance at the lilac trend line. Price has not managed to break above it.
I have two Elliott wave counts at the daily chart level. Only one will have an hourly chart; a second will be added when the daily wave counts materially diverge.
DAILY CHART
Click chart to enlarge.
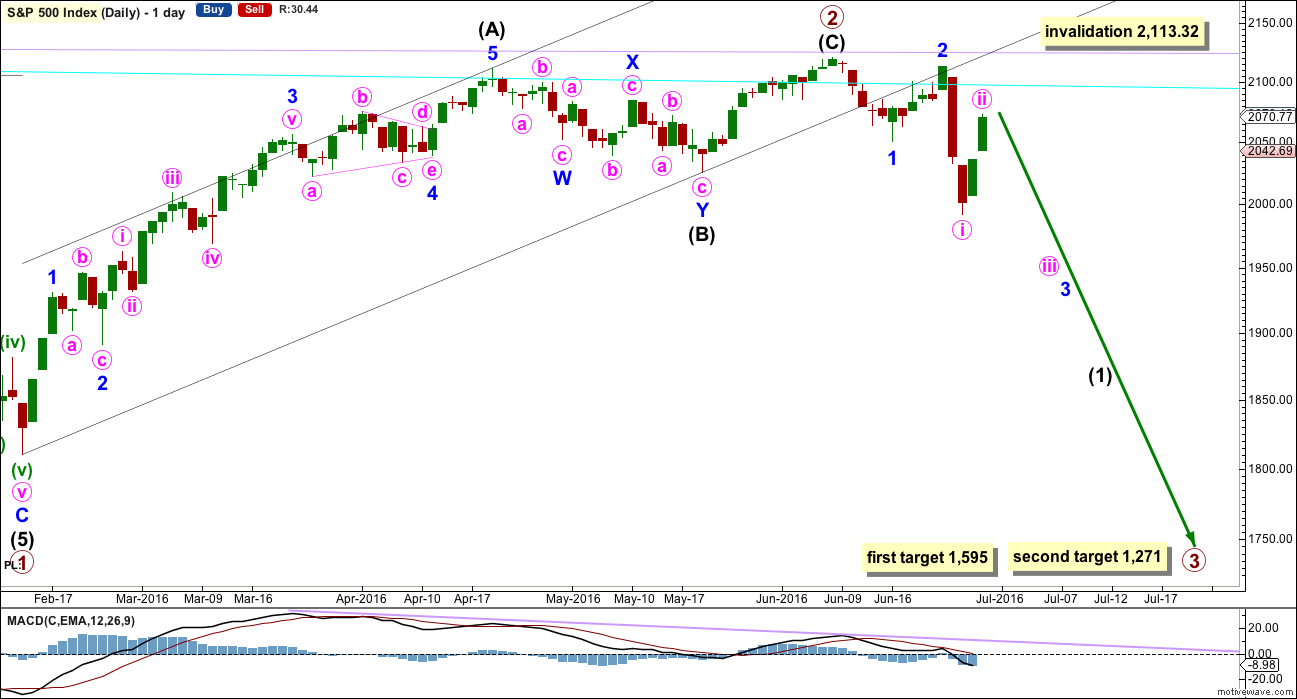
Primary wave 2 may have been a zigzag over earlier on 7th of June at 2,120.55. Thereafter intermediate wave (1) may be underway.
Within intermediate wave (1), minor wave 3 may be extending. A target for minor wave 3 will only be calculated again when minute waves iii and iv within it are complete and the target can be calculated at two wave degrees.
Minor wave 2 was a very deep 0.90 double zigzag correction lasting a Fibonacci five days.
Bear markets do not move price in a straight line. They have deep corrections along the way which must be anticipated. At this stage, future deep corrections may find strong resistance about the cyan trend line. I would not expect the lilac line to be tested again. If it is, it would offer final resistance, and I would not expect it to be breached at all. This means that any short positions opened above 2,100 may remain profitable for a very long time indeed, if traders would like to hold onto them.
Targets for primary wave 3 remain the same. At 1,595 primary wave 3 would reach 1.618 the length of primary wave 1. If price keeps falling through this first target, or if when price gets there the structure is incomplete, then the next target is at 1,271 where primary wave 3 would reach 2.618 the length of primary wave 1. The lower target is more likely because primary wave 2 was very deep at 0.96 of primary wave 1.
HOURLY CHART
Click chart to enlarge.
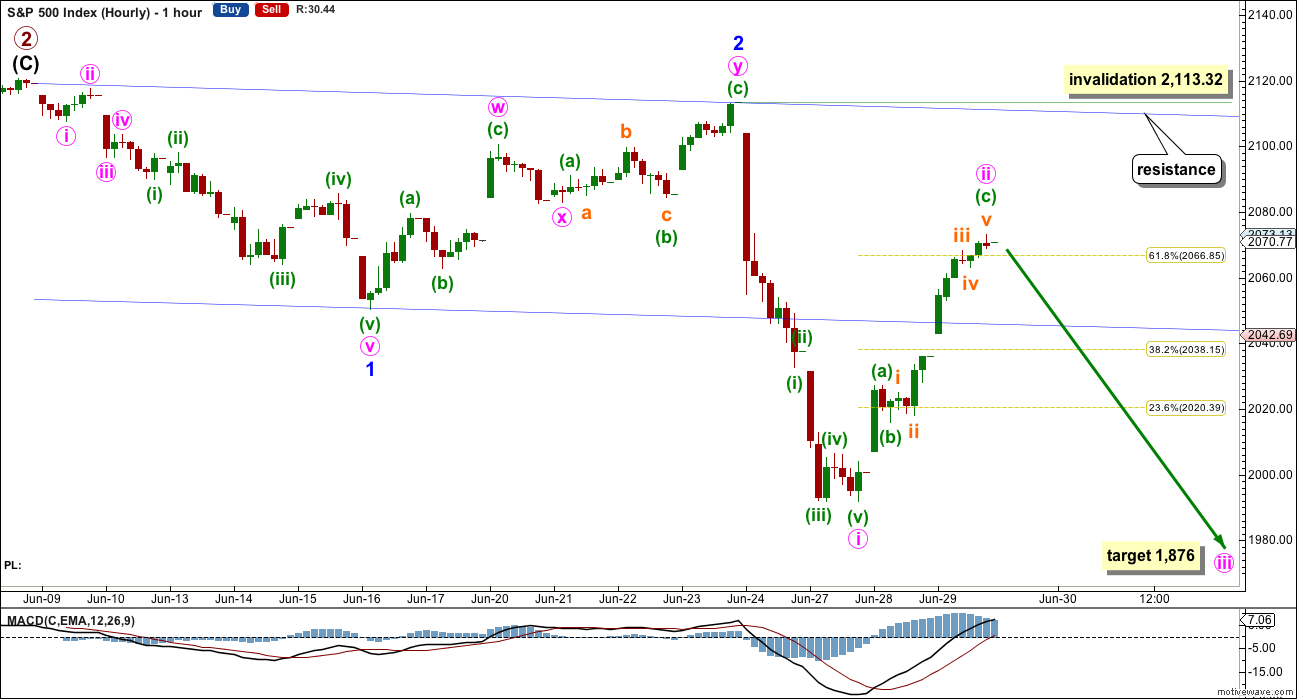
Minor wave 3 is not over. It looks like it is extending further. Within minor wave 3, minute waves i and now ii may now be complete.
Price has moved back up into the base channel (sometimes base channels do not always work perfectly). Minute wave ii, if it moves higher tomorrow, should find strong resistance at the upper edge of the base channel.
Minute wave ii is a deep 0.67 zigzag. Within minute wave ii, minuette wave (c) is just 0.11 short of 1.618 the length of minuette wave (a).
At 1,876 minute wave iii would reach 1.618 the length of minute wave i.
If minute wave ii continues any higher tomorrow, then it may not move beyond the start of minute wave i above 2,113.32.
ALTERNATE DAILY CHART
Click chart to enlarge.
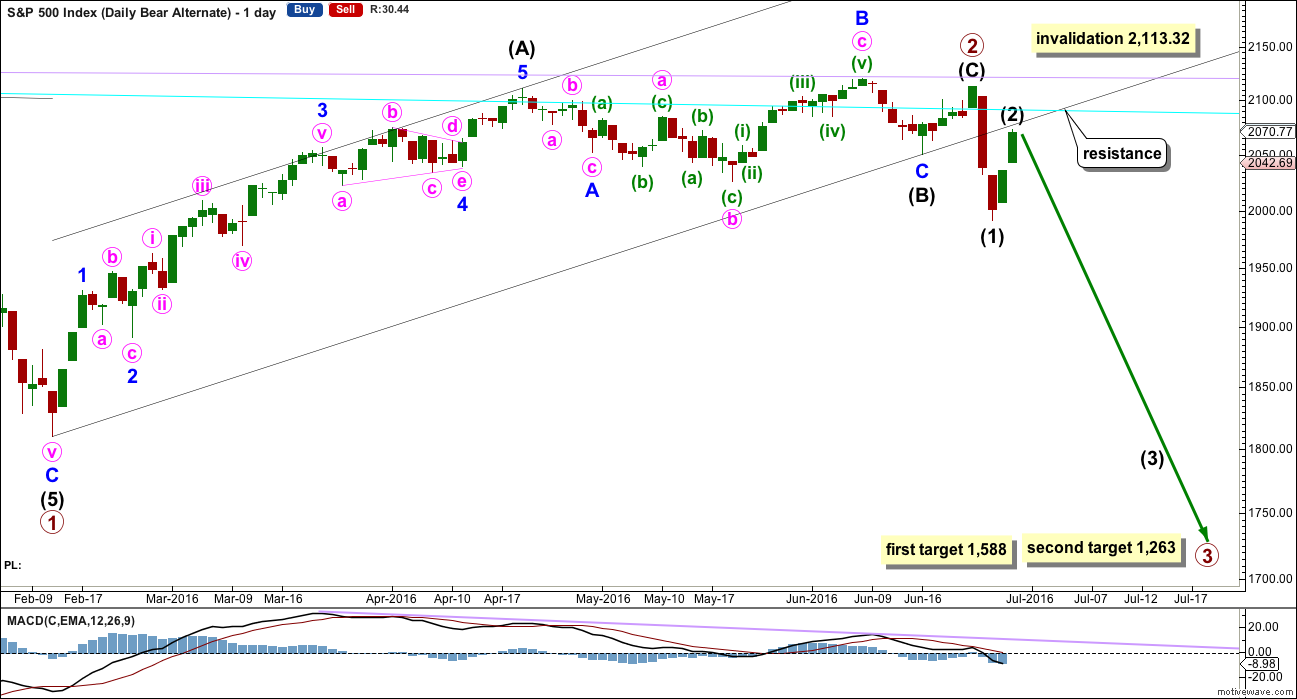
Primary wave 2 is relabelled. Intermediate wave (B) within it may have been more time consuming than previously expected. It subdivides as an expanded flat, minor wave B is a 1.16 correction of minor wave A and there is no Fibonacci ratio between minor waves A and C. Minor wave C ends slightly below the end of minor wave A avoiding a truncation.
Within primary wave 3, no second wave correction may move beyond the start of its first wave above 2,113.32.
At this stage, this alternate does not diverge from the main wave count at the hourly chart level. Both see an impulse downwards complete and both would expect a correction upwards is complete today. Again, look out for continuing surprises to the downside.
This alternate is judged to have a lower probability than the main wave count because it does not have as good a look.
Targets are slightly different for primary wave 3 because for this alternate it begins at a slightly different point. The lower target is still favoured because primary wave 2 was very deep. At 1,588 primary wave 3 would reach 1.618 the length of primary wave 1. At 1,263 primary wave 3 would reach 2.618 the length of primary wave 1.
BULL ELLIOTT WAVE COUNT
WEEKLY CHART
Click chart to enlarge.
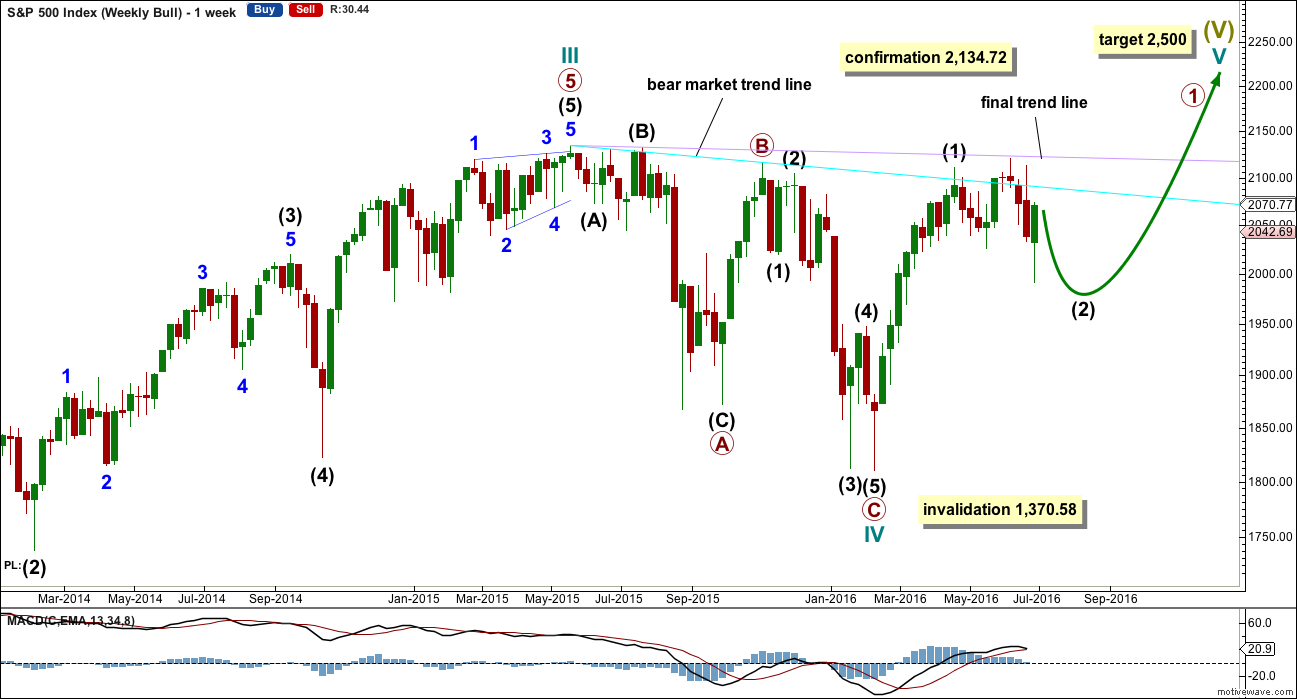
Cycle wave IV is seen as a complete flat correction. Within cycle wave IV, primary wave C is still seen as a five wave impulse.
Intermediate wave (3) has a strong three wave look to it on the weekly and daily charts. For the S&P, a large wave like this one at intermediate degree should look like an impulse at higher time frames. The three wave look substantially reduces the probability of this wave count. Subdivisions have been checked on the hourly chart, which will fit.
Cycle wave II was a shallow 0.41 zigzag lasting three months. Cycle wave IV may be a complete shallow 0.19 regular flat correction, exhibiting some alternation with cycle wave II and lasting nine months. Cycle wave IV would be grossly disproportionate to cycle wave II, and would have to move substantially out of a trend channel on the monthly chart, for it to continue further sideways as a double flat, triangle or combination. For this reason, although it is possible, it looks less likely that cycle wave IV would continue further. It should be over at the low as labelled.
At 2,500 cycle wave V would reach equality in length with cycle wave I.
Price has now broken a little above the bear market trend line. This line is drawn from the all time high at 2,134.72 to the swing high labelled primary wave B at 2,116.48 on November 2015. This line is drawn using the approach outlined by Magee in the classic “Technical Analysis of Stock Trends”. To use it correctly we should assume that a bear market remains intact until this line is breached by a close of 3% or more of market value. Now that the line is breached, the price point at which it is breached is calculated about 2,093.58. 3% of market value above this line would be 2,156.38, which would be above the all time high and the confirmation point.
This wave count requires price confirmation with a new all time high above 2,134.72.
While price has not made a new high, while it remains below the final trend line (lilac) and while technical indicators point to weakness in upwards movement, this very bullish wave count comes with a strong caveat. I still do not have confidence in it. It is produced as an alternate, because all possibilities must be considered. Price managed to keep making new highs for years on light and declining volume, so it is possible that this pattern may continue to new all time highs for cycle wave V.
The invalidation point will remain on the weekly chart at 1,370.58. Cycle wave IV may not move into cycle wave I price territory.
This invalidation point allows for the possibility that cycle wave IV may not be complete and may continue sideways for another one to two years as a double flat or double combination. Because both double flats and double combinations are both sideways movements, a new low substantially below the end of primary wave C at 1,810.10 should see this wave count discarded on the basis of a very low probability long before price makes a new low below 1,370.58.
DAILY CHART
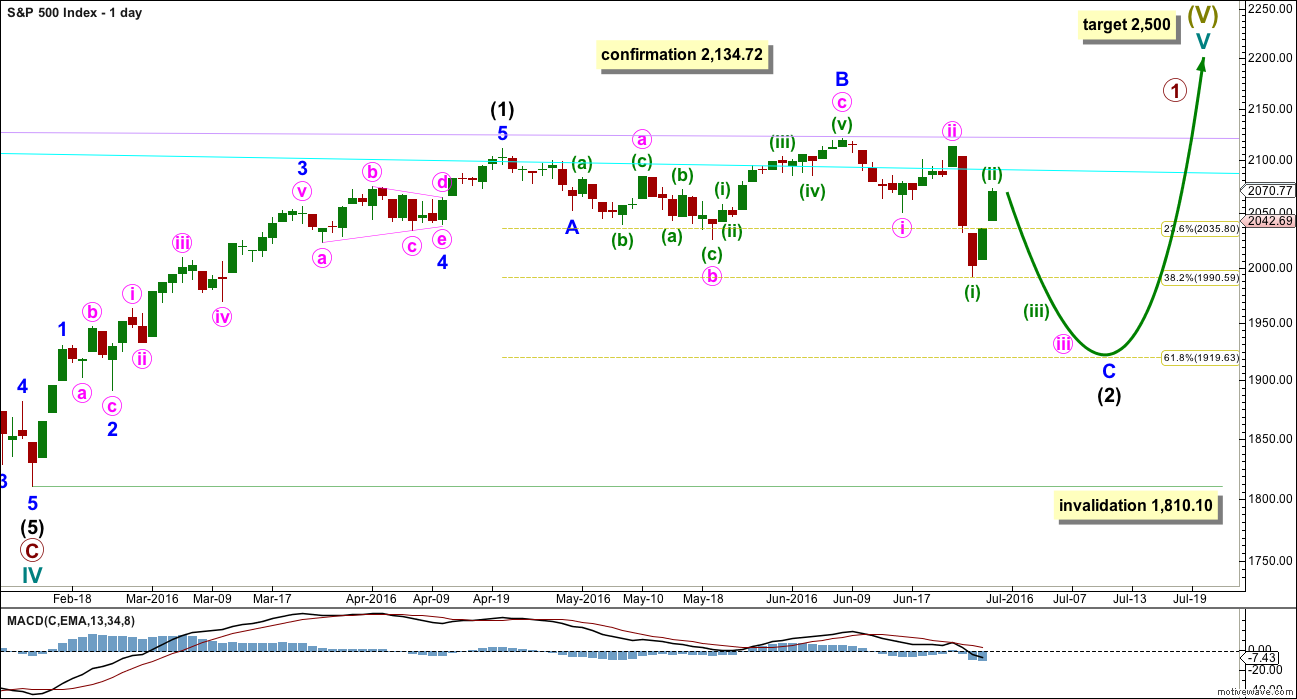
Click chart to enlarge.
Intermediate wave (2) may be continuing lower. The 0.618 Fibonacci ratio would be a reasonable target at 1,920.
Intermediate wave (2) may not move beyond the start of intermediate wave (1) below 1,810.10.
I still do not have confidence in this wave count. It absolutely requires a new all time high above 2,134.72 before it would be taken seriously. This wave count has no support from classic technical analysis at the monthly chart level.
TECHNICAL ANALYSIS
WEEKLY CHART
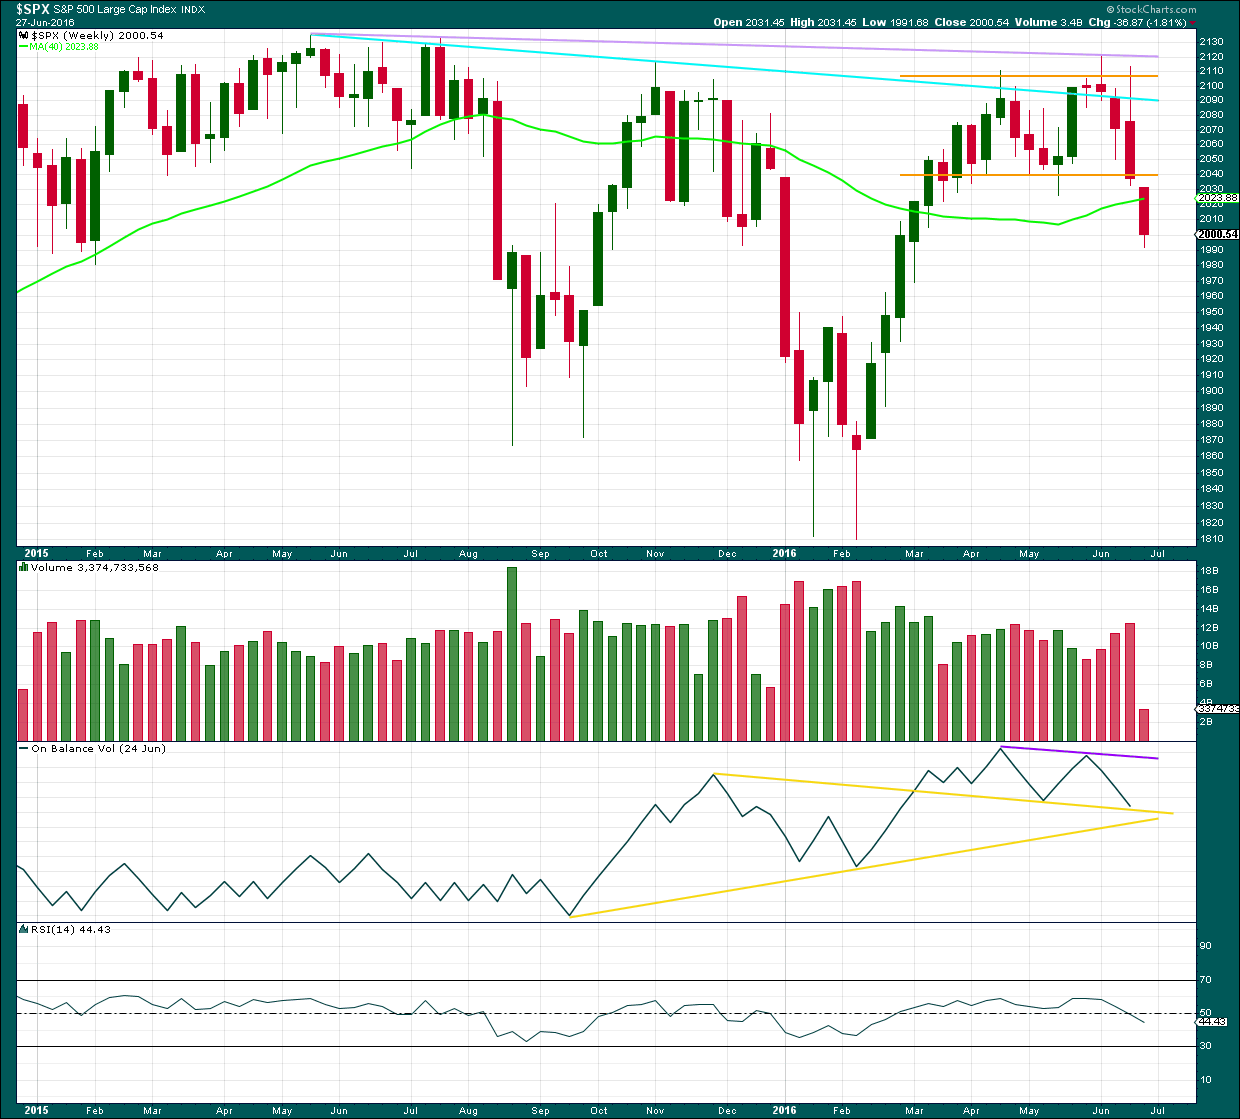
Click chart to enlarge. Chart courtesy of StockCharts.com.
Another strong downwards week is supported by an increase in volume. If next week can remain below the lower orange support line, then a downwards breakout from consolidation would be confirmed.
Overall price is falling on increasing volume For four weeks in a row. This supports a downwards trend.
On Balance Volume trend lines have been redrawn again. OBV may be finding support this week at the first yellow line. This may initiate a bounce next week, but it does not indicate how long the bounce may last for though, only that a bounce here is likely.
RSI is neutral. There is plenty of room for price to fall. This downwards wave may only be considered over when RSI reaches oversold at the weekly chart level, and preferably also exhibits divergence with price at a low. This was seen at both the last two important weekly lows, so it will be expected as likely to show up again.
Price has been range bound for several weeks at the weekly chart level. It is not breaking down below the lower edge of support which is about 2,040 (orange lines). If this week’s session closes below 2,040 with a red weekly candlestick on higher volume, then it would be a classic breakout to the downside.
DAILY CHART
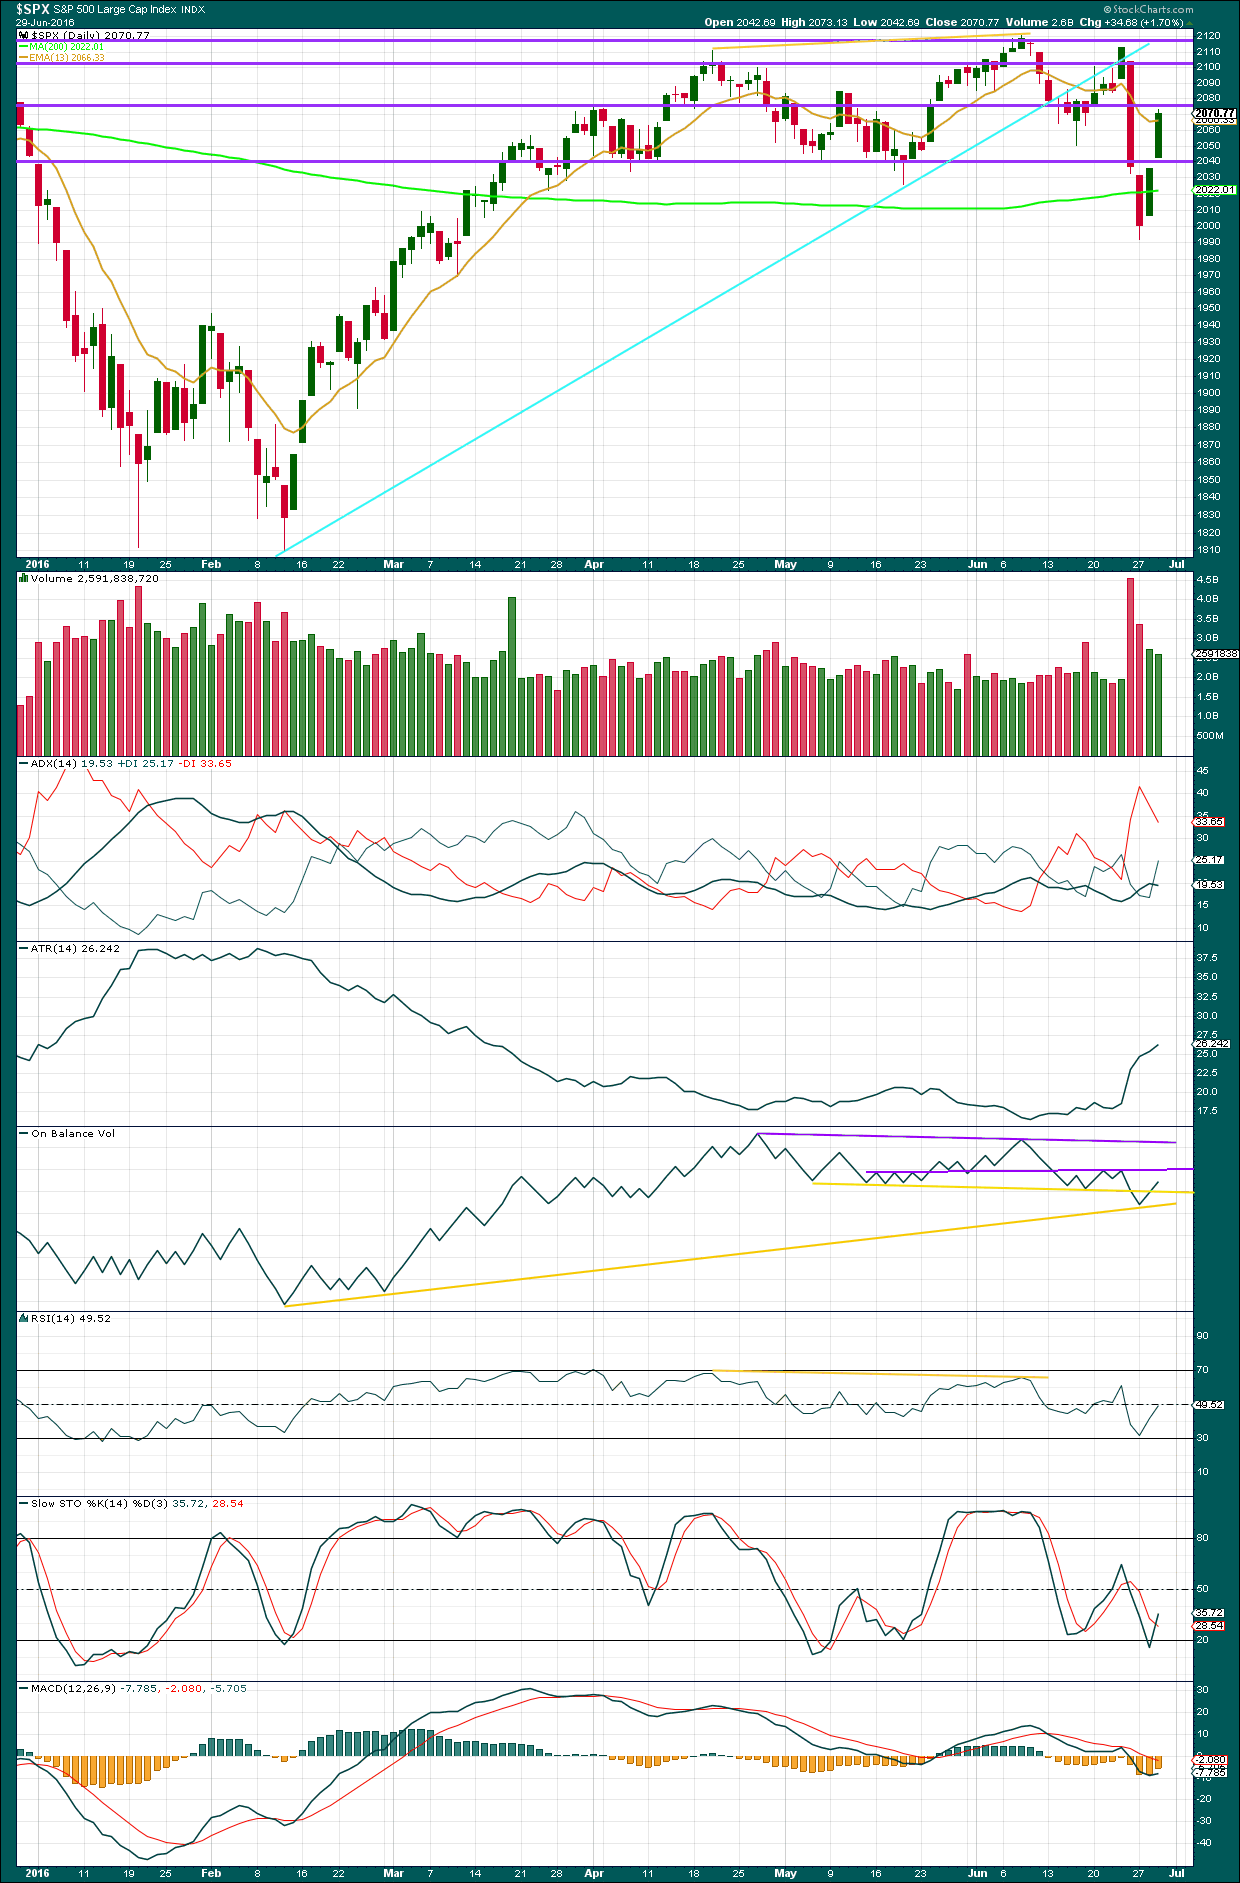
Click chart to enlarge. Chart courtesy of StockCharts.com.
Friday’s strong downwards day came with a strong increase in volume. The fall in price was well supported by volume. There is a clear downwards trend for the S&P at this time.
Price moved upwards again today but on declining volume. Each time as price moves down volume increases and as price moves up volume declines. The volume profile continues to be bearish. Price must be supported by volume for price to be able to keep going up to significant new highs, but this is not the case here. This does not tell us that price must turn here, so it may continue a little higher yet, but it does tell us the upwards wave is weak.
Price may find some resistance at this next horizontal line about 2,075 and about the 13 day moving average which is at 2,071 today. Resistance here may serve to stop price rising any further.
Volume for today and yesterday is still relatively high though in comparison to prior upwards days. But it does still remain much lighter than downwards volume. If price is beginning to enter a new stronger trend, then an increase in volume and ATR should be expected.
ADX today is slightly declining, indicating there may not be a trend in place. ATR disagrees today though. Some disagreement between these two indicators early on in a new trend is to be expected. If ATR again increases, then further confidence may be had in a downwards trend.
On Balance Volume did not stop at resistance at the upper yellow line as expected. Sometimes it does not respect these lines; it just does more often than not and this was an occasion when it did not. There is now room for OBV to move higher, so the possibility of higher prices short term exists. The purple line may offer resistance and stop a rise in price when OBV comes up to touch it.
Two days of upwards movement have bought RSI back up to neutral. There is plenty of room for price to rise or fall. There is no divergence, either bullish or bearish, between price and RSI to indicate weakness either way today.
Stochastics is no longer oversold. There is room for price to rise or fall.
VOLATILITY – INVERTED VIX MONTHLY CHART
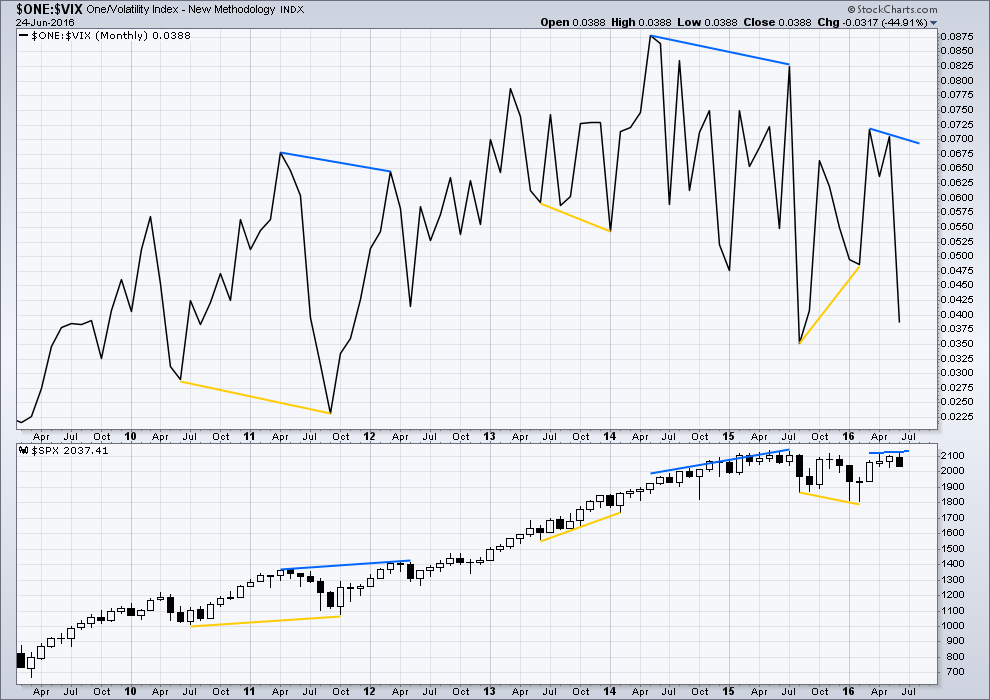
Click chart to enlarge. Chart courtesy of StockCharts.com.
Several instances of large divergence between price and VIX (inverted) are noted here. Blue is bearish divergence and yellow is bullish divergence (rather than red and green, for our colour blind members).
Volatility declines as inverted VIX rises, which is normal for a bull market. Volatility increases as inverted VIX declines, which is normal for a bear market. Each time there is strong multi month divergence between price and VIX, it was followed by a strong movement from price: bearish divergence was followed by a fall in price and bullish divergence was followed by a rise in price.
There is still current multi month divergence between price and VIX: from the high in April 2016 price has made new highs in the last few days but VIX has failed so far to follow with new highs. This regular bearish divergence still indicates weakness in price.
At the end of this week, there is no bullish divergence at the monthly chart level from VIX. Overall, more downwards movement is still indicated for price.
VOLATILITY – INVERTED VIX DAILY CHART
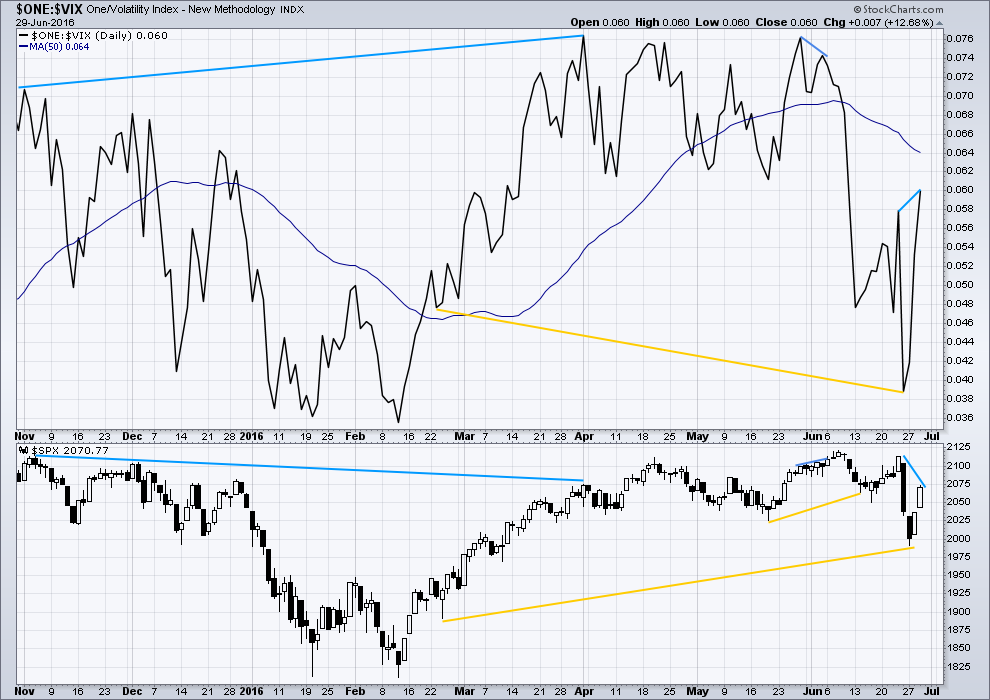
Click chart to enlarge. Chart courtesy of StockCharts.com.
There is an instance of longer term possible hidden bullish divergence noted here between price and inverted VIX with longer yellow lines. From the low of 24th February, volatility has strongly increased yet this has not yet translated into corresponding lows for price. This bullish divergence may now be resolved by some upwards movement from price over the last two days.
There is today a new instance of hidden bearish divergence between VIX (inverted) and price. As price moved higher over the last two days inverted VIX also moved higher, which indicates volatility has declined. This is normal and should be expected. What is not normal here though is the decline in volatility is stronger than where it was for 23rd June. This indicates weakness in upwards movement from price.
There was an earlier instance of short term hidden bearish divergence between VIX and price, shown here by short blue lines on both from 27th of May to 3rd of June. That was followed by some downwards movement, but it did not happen immediately. Price limped along upwards in a very small range for three days before turning. It is entirely possible that this may happen again. This current divergence indicates weakness and should be taken very seriously, but it cannot tell us that price must turn here.
While I would not give much weight to divergence between price and many oscillators, such as Stochastics, I will give weight to divergence between price and VIX. Analysis of the monthly chart for the last year and a half shows it to be fairly reliable.
BREADTH – ADVANCE DECLINE LINE
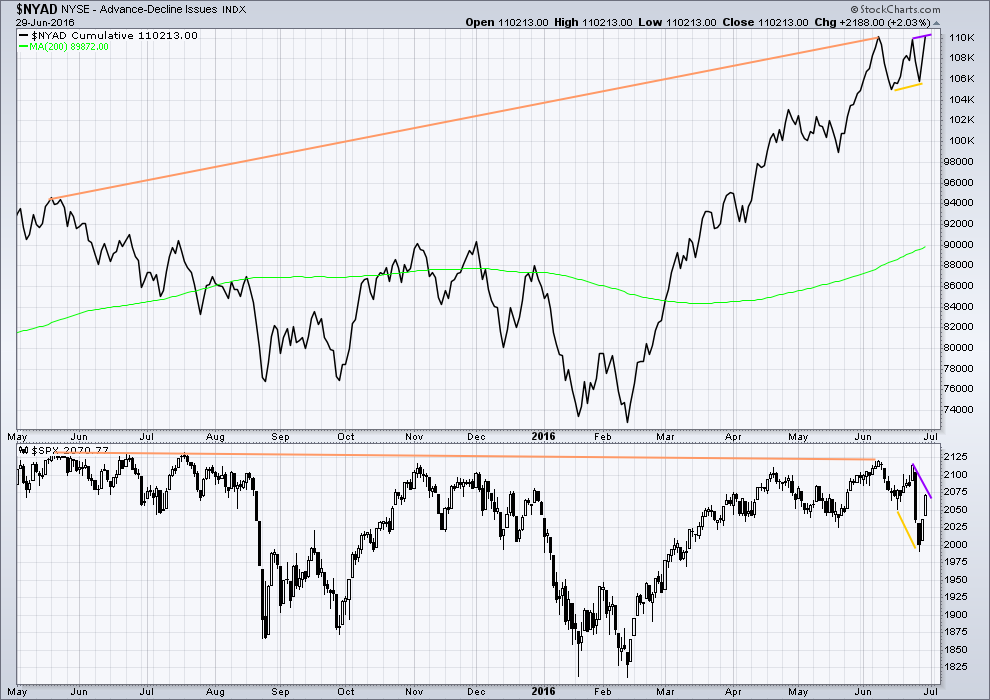
Click chart to enlarge. Chart courtesy of StockCharts.com.
With the AD line increasing, this indicates the number of advancing stocks exceeds the number of declining stocks. This indicates that there is breadth to prior upwards movement.
Taking a look at the bigger picture back to and including the all time high on May 2015, the AD line is making substantial new highs but price so far has not. While market breadth is increasing beyond the point it was at in May 2015, this has not translated (yet) into a corresponding rise in price. Price is weak. This is hidden bearish divergence.
There is divergence between price and the AD line indicated by short yellow lines. Price made new lows but the AD line has failed to make corresponding new lows. This indicates some weakness to downwards movement from price. There is less breadth to downwards movement this time. This divergence is bullish and also supports the hourly Elliott wave count. Upwards movement over the last two days may be enough to resolve this bullish divergence.
The AD line today made a new high above its prior high of 23rd of June yet price has not made a corresponding new high. This divergence now is bearish. It indicates that price is weak.
DOW THEORY
The last major lows within the bull market are noted below. Both the industrials and transportation indicies have closed below these price points on a daily closing basis; original Dow Theory has confirmed a bear market. By adding in the S&P500 and Nasdaq a modified Dow Theory has not confirmed a new bear market.
Within the new bear market, major highs are noted. For original Dow Theory to confirm the end of the current bear market and the start of a new bull market, the transportation index needs to confirm. It has not done so yet.
Major lows within the prior bull market:
DJIA: 15,855.12 (15th October, 2014) – closed below on 25th August, 2015.
DJT: 7,700.49 (12th October, 2014) – closed below on 24th August, 2015.
S&P500: 1,821.61 (15th October, 2014) – has not closed below this point yet.
Nasdaq: 4,117.84 (15th October, 2014) – has not closed below this point yet.
Major highs within the new bear market:
DJIA: 17,977.85 (4th November, 2015) – closed above on 18th April, 2016.
DJT: 8,358.20 (20th November, 2015) – has not closed above this point yet.
S&P500: 2,116.48 (3rd Nobember, 2015) – has now closed above this point on 8th June, 2016.
Nasdaq: 5,176.77 (2nd December, 2015) – has not closed above this point yet.
It is a reasonable conclusion that the indices are currently in a bear market. The trend remains the same until proven otherwise. Dow Theory is one of the oldest and simplest of all technical analysis methods. It is often accused of being late because it requires huge price movements to confirm a change from bull to bear. In this instance, it is interesting that so many analysts remain bullish while Dow Theory has confirmed a bear market. It is my personal opinion that Dow Theory should not be accused of being late as it seems to be ignored when it does not give the conclusion so many analysts want to see.
This analysis is published @ 09:14 p.m. EST.
Weekly SPY-TLT ratio still on track to make lower lows…
oh hi aug gold above 1331.00 breaking up.. about time
Hi Lara. not sure if you look at PVO so have attached a weekly chart. Typically, a breakout or support break is validated when PVO is rising or positive. I see this a current bearish signal, thoughts?
I see the 6/23 gap filled , and either an ABC up or a 5 waves up .
help ??
This is TOO important at this juncture….I’m pulling out the Royal Canadian. Give me a few minutes…..
Royal Canadian – the most bearish pattern (at least north of Wisconsin). Had to pull out the big gun (cause I ran out of Fork tines today on the big up). Pattern meets all ratios:
AB leg between 0.382-0.618
C point 1.130-1.414 of XA leg
D point 0.786 retracement —and as it is .769 prefer just a little higher tomorrow,
then down.
Let the Bear roar! Bulls will be called steers from now on.
4 hour S&P 500 chart, expanded some
Hey Peter , is that almost a butterfly pattern ( or some sort of Gartely 222 ) ?
Nope, it is a Royal Canadian pattern. Also known as a bearish cypher pattern. Ratios confirm it.
That is a new one for me and I am 57.
Are you joking around about this pattern & how bearish it is?
New to me too! My sentiments, you are not pulling my leg, now are you?
I am going to post….. The Smoken Joe Pattern…
but I don’t know how to copy and paste a Live Thinkorswim chart.
It is a real pattern:
http://www.sr-analyst.com/HarmonicHelp/cypher_pattern.htm
Actually I thought it was a joke too. But apparently another person has posted on this today elsewhere. https://new.tradingview.com/chart/SPX500/arSIMBBB-SPX-Cypher-pattern-to-reverse-at-2098/
yup its legit,, I prefer Crown Royal myself
Courvoisier! Thank You! (Neat)
Good spot Peter and hopefully a comforting sign.
Its month end: we have a hanging man candlestick on the monthly SPX chart. Lower tail is more than 2x the body size, longer the better the indication for a reversal down – and it is long. Might have a bearish deliberation block candlestick pattern on the daily chart…checking the qualifications now.
Noting some might call the monthly stick a doji too. Either way, what a beautiful sight!
It is entirely possible that the alternate daily chart is in play. It is a bit strange that an intermediate wave would complete in three days but that was a huge decline and it is possible. A very deep frenzied retracement for an intermediate two ahead of an intermediate three of a primary three down is what I would expect and is exactly what we have. The new 52 week low in UVXY suggests, once again, a higher than minute degree correction. Another 52 week low in UVXY would in my mind make either an intermediate 2, or even perhaps as Lara suggested to today, a primary two in play. Just my two pence! 🙂
ps It has me really wondering whether Joe’s contention of a 20 to 30% day down is indeed not in the cards. If an intermediate 1 can complete in three days, a 20 to 30% daily decline for intermediate three would head us toward the price targets in a hurry I wager…
Pretty strong MACD divergence today makes me think this move isn’t going to stick. Looking at a long term chart this down move and today’s retrace isn’t anything out of the ordinary. If anything it gets us closer to the 20% plus down day that Joseph mentioned. The S&P will always “chop before the drop” so what we have just seen just gets us closer. Look at the past waterfalls and you’ll see moves just like today’s move. The trick is catching the waterfall after getting beaten up by the false moves and the whipsaws.
Yep! The price action of the last three days is screaming “Short Me!!”
Yeah, I agree the problem is at what level 🙂
Daily candlestick pattern is up for grabs imo. Possible
1. ‘Three advancing white soldiers’ (only has D+ efficiency rating though) bullish
2. ‘Advance Block’ bearish
3. ‘Deliberation Block’ bearish
Either of the three could possibly fit, after examining requirements and numerous chart patterns of them in real life. But there are problems with each too. Any input from another trader here would be helpful, or will have to wait for price to confirm one of them. Adding if we get a hammer upwards tomorrow, then gap down Tuesday a 4th pattern bearish is ‘Bearish Ladder Top’ which takes 5 candlesticks to determine.
I will be paying close attention to volatility and action around the 2100 pivot. A failure of UVXY to close that gap down from today coupled with a close above 2100 tomorrow would in my view be significant….
I’ll go with the Three Advancing White Soldiers, and the first one also completes a Bullish Engulfing pattern.
Although the third candlestick is smaller than the first and second, it is still a sizeable real body. Not clearly smaller.
But with heavy resistance just above I’d be exceptionally careful about any long positions or calls for new ATH’s here.
Agreed! Scalped the moves up. Out by the close. After last Friday’s kerfluffle, no one in their right mind would be long this market overnight imho… 🙂
If there can be a Royal Canadian pattern, there should be an official Kerfuffle pattern! 🙂
🙂
There’s more since I’m looking….the Nasdaq had a weekly bearish doji May 30th, then had ‘three black crows’ weekly, also bearish, candlestick pattern right afterwards. Bearish reversal on a 3 black crow is 78% success rate.
http://thepatternsite.com/ThreeBlackCrows.html
Ouch – absolutely amazing how fast 1000+ Dow pts can move in 3 days!
Lara,
I believe you have a comparison chart from a much older timeframe that was tracking very close in direction. If true, how is the comparison looking today? Anything to learn from an older – similar move? Thoughts?
Also, regarding Brexit and regardless if pure emotional move or not, it all needs to be analyzed the same way using EW? Thoughts?
Thanks
20% to 30% down in one day… can move even faster. It’s happened before, it can happen again. Especially in this absolutely insane environment!
That was Cesar’s work, the current price action (monthly) overlaid to the 1970’s and the 1930’s to look for similarities / differences. I’ve asked him to update.
EW says its the markets that cause the news, not the other way around. I have been thinking that with a bear market in place at this time it did indicate a Leave vote was more likely than Remain, but with price so close to the ATH that’s really not clear. Which may be why the result was so close.
This market is balanced between bulls and bears, they’re fighting it out for sure, but the bears have more underlying strength and the bulls have underlying weakness.
I subscribe to Lowry’s market research (the home of the AD line) and they too see underlying weakness.
I don’t think we are going to see new ATH’s, that would require more strength in the bulls than they have been able to show to date. They keep trying to push on through, and they keep failing. The falls are hard and fast.
There is not enough selling pressure to keep price down though. Only when sellers get active will we see price break out of that huge range on the weekly chart.
I made a speculative buy of July 15 SPY 200 puts at the closing spike upwards. Filled at 0.38 per contract. I expect this rise to once again challenge the 2100 pivot will prove futile and that the 2000 pivot will fall on the next wave down. A close above 2100 will convince me that I am on the wrong side of that trade and will see me beating a hasty reatreat…I was going to wait for re-purchase of my UVXY puts but the time seem opportune… 🙂 Have a great evening everyone!
We end the day with both VIX and UVXY divergence. Bid on UVXY 10 strike puts at 1.52.
Still hoping to buy back at 1.00 or less. We’ll see what else the banksters have up their sleeve tomorrow!
UVXY coiling. We’ve seen this act before…. 🙂
There is weakness to this upwards movement. Plenty of divergence with VIX still. Divergence with the AD line still. Hidden bearish divergence with MACD on the hourly chart now.
And I’d bet volume is lighter today.
But that’s the problem with weakness and divergence. It tells you that the move in price is very likely to be fully retraced, but it won’t tell you when and where price will turn.
What if?
Another test of that lilac line, (C) to move slightly above (A) at 2,111.05 to avoid a truncation.
P2 ending tomorrow / day after, P3 begins then.
Two things I don’t like: within minute B within minor B within intermediate (B): an expanded flat but minuette (b) is 1.94 X minuette (a); within allowable limits but close to the limit.
The other thing is the structure of minute c of minor B of intermediate (B). Will this subdivide as a five? I need to check that on a lower time frame.
I’ve played with all different possible structures I can see for intermediate (B) ending at the last low. This is the best fit I can find so far. Other structures can fit and meet rules, but look horribly wrong (such as a triple zigzag for example).
Big Volume spike after the close. at 880.433 Million & still rising.
Volume was lower all day than yesterday until 3:54PM
I think there is an End of Quarter Rebalancing going on right now. Can anyone confirm this?
Yep. In all likelihood that’s exactly what’s going on.
What if Leading Diagonal?
Yep. Another “what if?”
I don’t like leading diagonals though. They’re not rare, but they’re not so common either. But should still be considered.
What a way to save the Q2 in just 4 days…
After the quarters books close we might see some profit taking…
The market is only up 1.00%, don’t see the big deal. Well within price targets yet. Yes on the higher side, but still all valid for us bears. 🙂
How bizarre can this get? Another run up to exactly 2097.60 for the third time….
Cyan trend line… still holding.
Love to see this rip down after hours.
This last surge up smashed through the cyan trendline…
SPX Volume still running lower than yesterday at this same time.
Last high is .01 short of daily high of 1996.68
SVXY confirmed sell…UVXY confirmed buy…SPX and the other indices have yet to signal a sell…
SVXY sell…
UVXY buy
So far the wave count remains the same, but I’m wondering, what if it’s wrong?
Not what if the whole bear count is wrong, but what if this is still part of primary wave 2? What if price can break above the last swing high at 2,113.32?
Going to work on that now. Although I did expect a correction I thought first it would be a fourth wave. Then it wasn’t, it was a second wave, the alternate possibility. Now it’s very deep indeed. If 2,113.32 is taken out I want us to have a road map of what may happen next.
Wave 1 and 2 of a leading diagonal?
Cyan trend line continues to resist the bulls. 3 tags and holding.
Another impulse down. Now three up….
After this huge run, amazing how the QQQ’s technicals on the daily remain very poor compared to SPY and DIA, with it still under the 200ema and stochastic only midway.
If we go down, looks like the Nasdaq will lead the charge?!
Kevin,
I have been saying this from the day I joined that S&P and NASDAQ analysis must be aligned due to the influence of NASDAQ stocks on S&P.
🙂
I sure hope so 😉
Maybe Now?
SPX just retraced 99% of that first impulse down. The second second wave up retraced 100% Wow!
The last high did not exceed the previous daily high
Wow….this move just wont let up. You think this is what Yellen meant when she said the fed was ready for Brexit
The algos are running over time…big time!
What is truly hilarious about what is going on is the absence of strong selling. Giving ’em enough rope…. 🙂
All the momentum guys & algos are jumping all over themselves. They are screaming bulls.
Have a quick glance at the attached chart, and without trying to work out what the instrument is, have a look at the recent “cup” it’s formed, compare that with MACD and tell me in your experience as traders, does the attached chart suggest strength or weakness over the next 10-12 periods?
What would your shoot from the hip, first glance, honest opinion be?
I’d draw a trend line across the last wave up and notice it’s breached. I’d be expecting that last green candle may be a throw back to the trend line.
I wouldn’t be looking at a cup and handle pattern, but I’d notice a possible H&S pattern forming with the RH shoulder to be the throwback.
My 2 cents worth.
3 peaks and a domed house come to mind. The old George Lindsay pattern.
Thanks Lara,
I’m on the look out for that already. If price came up to kiss the underside of that trend line… boy that would make an incredible risk vs reward short play, which i for one would take any day.
But i’m curious if you (or anyone else) thought the chart – as it currently stands – suggests strength or weakness to come?
I’m a newbie so I’ll bite…I would say strength, macd looks to roll bullish as well as several hammer candles suggesting bulls are in charge
True. All those long lower wicks.
MACD also showing some hidden bullish divergence.
Sit on the fence for this one and let price tell us.
The long wicks appear during the downtrend as well so they tell us that the crowd (and/or algos) continues to buy the dip, even when they are not in charge…
I’d be sitting on the fence, but maybe slightly more to the weakness side TBH.
Only because a trend line break from the upwards wave would be significant, and in the new trend I’d expect a throwback.
A trend line break and throwback is my favourite trade set up. Low risk high reward. But I know it doesn’t always work. Hence manage risk.
Does sitting on the fence mean you exited all of your bearish trades or just are not going to add anymore? Tnx
A “cup and handle” formation signals a continuation to the upside….when the handle is on the RIGHT hand side of the pattern. The oscillator (red on lower right of your posted chart) confirms the entire down trend above it is valid as the bars reached lower down than the oscillator pattern just before it. I would be worried if the oscillator showed divergence with price, it does not. I’ll post a chart example.
Cup and handle pattern for continuation upwards. Handle is on right, not left, for this to be considered as a valid pattern for the market to go up.
Weakness – the long wick on the last bar actually points the way froward which should be down.
FYI:
SPX Volume still less than yesterday at the moment according to Symbol $TVOLSP (S&P Total Volume)
Volume at 2:39:59 today is running at 375.565 million
vs 386.893 Million yesterday
No surprise. What is going on in the markets today is hardly usual and customary price action. It is nothing short of bankster hubris on glorious display. It is their intention to try and send a message to anyone trying to short the market, particularly if they are attempting to do it with leverage….
The algos are certainly running wild today…wow!
Money managers have managed to tag another 1% onto this quarters performance today. After the books close it will be interested to see if there is selling.
Have the bulls been worn out? Looking a little flat.
I mentioned that last week that given the Q2 end, lot of magic will be happening this week and what we have in front of us is pure magic…straight line.
Looks liken an exhaustion gap in SPX at 2097.10 on one minute chart.
You gotta give it to the banksters. Not too many bears left standing I would imagine…
Yep, now that they got everyone off the trade….do something!
Right up against the old cyan Trend line
Yep. Somebody brought out the big guns. Looks like 50mm….I do not expect they will go gently…
Hi Gary. It’s hard for me to tell but did that wave four overlap wave one?
No, I have stub-minuette w(v) as regular impulse now.
Huge SPX UVXY divergence on this last run higher…..
New UVXY 52 week low today at 9.32….
Readjusted retracement levels with 2094.50 as the high while we wait for EW charts…this is straight up from monday and there is still a day left for trading…
0.236 2070.456
0.382 2055.272
0.500 2043.000
0.618 2030.728
0.786 2013.256
UVXY might just get smashed one more time if we get a green day tomorrow. Unreal how NUGT and GOLD is holding off any selling in this market with risk ‘on’.
Bullish targets,not looking for this personally but we got to take what market presents.
0.236 2118.926
0.382 2134.037 (this has been there for a while and likely magnet once we clear 2,113)
0.618 2158.463
0.786 2175.851
Wow! An amazing bull/bear knock down drag out brawl. It looked like we had five down followed by an expanded flat up correction and then we got these monster green candles to invalidate that wave structure…
According to Stock Traders Almanac, tomorrow July 1st is the best day of the year with an 80% chance of being a green day. So when Lara says this might linger on for 1,2 or 3 days i will be putting my money on the second day.
We need UVXY to take out 9.90 to bury the short sellers…
Need to lose 2085 (micro w(1)) and then below lower channel Trendline for higher confirmation.
Chart:
There is a war to keep UVXY under a 10.00 close…somebody is going to be taken out on a stretcher….
Open order to buy back 10.00 puts at limit price of 1 Washington
Moving back to test 9.50 area….
I know there can be many different structures, but what I’m referring to is how many alts and still conclude 3rd down? I gather that as long as SPX stays below 2134, then there can be many, many different structures and still point to pw3 down?
That is what the invalidation points are all about I think. There is a number that says the wave count is wrong.
I agree with Mr. Verne- EW is dealing with probabilities and right now there is a greater than 50% chance the Bear count is correct. And a 1-2, 1-2 pattern down is forming on the daily chart, speaking from the June 8th high, reinforcing the big down wave will be strong and deep.
On my fork charting it went through the middle line, and now the upper line….but hit the next one up spaced the same distance out. All part of the odds.
UVXY 9.50 bear phalanx broken; let’s see if it holds….
I think the structure has been satisfied, but want 2085 taken out to the downside. Then going in short.
Alternates for the Bear case is what I mean.
Thought it would be a good time to hire my friend Griz and do some Bull hunting … he’s pissed and hungry!
Yes, lets set him loose. One way or the other lets see this market break out of that box on the weekly chart please.
I really thought that the decline in Jan-Feb of 2016 was the first wave down, at large degree, but the rallies since then have caused me a bit of perplexity. That’s why I joined here…To try and clarify it. I just wondering, how many different alternates can there be at Primary Degree? Is 1 or 2 reasonable? Just wondering.
There is a huge drama playing out in the markets I think Tony, and that is to what degree can bankster intervention distort market price action and therefore true price discovery. I think the perplexity a lot of us is experiencing is due to absolutely unprecedented market intervention. They can distort, and even delay, but they ultimately cannot deter. That is the EW principle!
If ask on those put go below 1.00 today I am cashing in an getting me some calls….
This will be the 8th time in the last year that SPX has taken a run at 2125. It seems that if a trader or investor wanted to get long the market, why not simply wait another 40 points and buy the breakout? I guess sometimes it “buy high and buy higher”. Maybe traders think they might miss out on the next big leg up, or something. The problem is that these rallies seem a bit extensive for a bear market rally. I know they can be deep, but overall, on the weekly , it appears we haven’t even really started down yet. I may have a cigar and ponder it some more.
maybe, but the gap was filled now, the price targets met, the price structure met, lower volume, so bears still in control and on ‘target’.
Tom – do you get open interest of options during the day? If yes, via what system or source? Thanks,
opps, misread the feed….the gap on the daily will be filled a little higher in price yet.
Step back and look at the weekly chart. Look at the large range, the S&P has essentially been boxed in for many months. It’s still boxed in.
Regards resistance / support each time it’s tested and holds, the strength increases. So theoretically that cyan line is strong, the lilac line is stronger. The ATH hasn’t been tested for a while…. unless you count 2,120 a test, but that’s 14 points below.
UVXY heading north…
Patiently waiting for a close of this morning’s gap down….
It is being relentlessly sold at 9.50. A break above that level will be the first sign that we are close to a top….
The long and winding road….tha-a-at leads, to your dooooor…..! 🙂
https://www.youtube.com/watch?v=JFNaOm6U5n8
I’m getting a cramp…
appreciate u posting charts today though, my arthritis is killing me.
and 293.81 would close the gap on daily
You’re welcome Peter, I just really hate slow grinds up.
meant 2093.81
Remember… Revenue & Earnings of multinationals & others with EURO trade will be hit hard on dollar strength as this is the last day of the qtr…. The analysts were estimating a weaker dollar for this qtr .end.
Are we done??!!! 🙂
I guess not. Up and away…
Bid on 10.00 strike puts at 1.63…
Ending Diagonal perhaps….
Gary you are a mind reader. Those triangles had me wondering….!
A move down into wave one territory would be a clue… 🙂
Just broke my #1 rule … “never change a stop strategy because you can always get back in.” Market pop-up definitely stretched my toenails today!
It’s the Gartman curse…oh well we still got EWI.
Why do they still care what this guy says? His time has passed.
That first triangle must have been part of a second wave combination with the second triangle recently being a small degree fourth wave. Now in final fifth up?
Interesting. Bid on those puts now up to 162.00, even as market moves higher…it seems we are making a bit of progress!
I think we are in three of five up…. 🙂
Oops! I meant five of five up….
I’m starting to see some real selling pressure here in the ES….
Every time we get up to 2077-2078 some real selling comes in. Opposite of the buying I saw at the close 2 days ago. Let’s see if it lasts, waiting for a trend turn to add another 50%, but looking very promising at the moment for us bears.
Any one with a tentative count? Looks like a fifth up may have extended…
Does this week remind anyone of last week? It’s like a carbon copy of price action exactly this time last Thursday. The whole week’s price action actually…
We need a small third down and I mean right now or I am back to the sidelines for now…
Looks like thrust from yet another triangle.
I don’t ever recall seeing two of those in succession like we just saw. Very unusual indeed. Just about ready to move to the sidelines…let’s see how this plays out….
2085 holding resistance so far…. I’m ready to enter 1/3 SPXS 30k shares @14.20 if we can get a little confirmation.
If this upwards movement is done, UVXY open gap at around 10.00 from yesterday’s close should be filled in short order. Any failure to do so likely means some sort of extended wave up unfolding. I will hold my positions for another hour or so before I decide….
Tomorrow is a Friday before our long 4th of July weekend with Monday NYSE & all mkts. in USA Closed!
Tomorrow is a get out of town early day for most or a take off from work day for big money types in NYC & elsewhere in USA. Just to put the rest of today vs this Friday in perspective.
Today (6-30) is also the last day of window dressing for money managers for the QTR.
EDIT:
FYI: Volume less than yesterday att.
Volume at 11:59:59 today is running at 228.478 million
vs 254.822 Million yesterday
Yep. I want to go into the week-end with a very light ledger. In fact, I plan on doing some house cleaning before the close today. Bid on those puts still at 1.59 and I plan to exit prior to the close. The banksters are quite busy little beavers today!
I bet… They are buying the best performers for the qtr. to make themselves look good. They will dump them in a week.
I am stuck in these positions… until this whole thing plays out. The erosion loss is really starting to hurt. But a paper loss is not a real loss. I won’t get any margin calls so I can ride it out still.
I have three lines drawn on my daily chart:
1. at 2091.66 – level
2. at 2094.11 – level
3. at 2108.46 & declining daily
This may stop at anyone of the three… hopefully the 1st one 2091.66 or lower.
I can’t remember why I drew any of them… But I am sure it was for a very good reason and I am not in the mood to figure out why.
I did not let them get away with that. I demanded a fill at the highest bid while I was unable to access my trades. They reluctantly filled at 1.60. 🙂
2085 SP 500 has been a really big number now for several weeks.
Just picked initial position on UVXY(@9.50) and TVIX (@2.18)
I am hopping mad. My broker did not like the fact that I tripled my sell to open order on those puts and tried to execute at the market and those %^&*%%$%$%^^^^%$$##$#$ locked me out!!!
I still cannot log in to execute the trade. I can’t believe this!!
New low at 9.42 would have been an even better fill! 🙁
That’s frustrating Verne. Sorry
I had an issue with fidelity not filling an order a week ago. I don’t know how options get filled but they just flat out canceled….scary especially when things get real rough. It may be hard to buy or sell what you have. Brokerages should have the bandwidth they need, especially fidelity.
I cannot believe what my broker just did to me. I was just trying to change my open order to fill at the market and viola! I am locked out! Son of a b- – – -!!!!!!!!
request timed, out server error….yeah right!!!
Double bottom in UVXY at 9.47?
On daily timeframe FTSE has just invalidated the main bear count.
Also invalidated the alt bear count with it’s move below 6050 last Friday.
Incredible strength… 750 points in less than a week….
And I thought Brexit was supposed to be bad 🙂
The most recent FTSE chart EW count I looked at has an invalidation of FTSE at 7,120. This is on the monthly, weekly and daily charts. FTSE is at 6504 right now….so how is the overall bear count invalidated? Are you speaking about the 6400ish number?
FTSE is in a bear market, only would be invalidated if 7,120 is breeched to the upside.
Yes, the 6427 number.
Your point about the index needing to make a new ATH to completely invalidate the bear market thesis stands… but the point I’m making is that there isn’t a current count that supports the index to be setting up for a primary 3 decline, which, (unless one can be presented) suggests something else is in play.
And, also possible that this is the case in other indices. Monthly MACD turning up in SPX is suggestive of something else in play there too imo
That said, i am actively looking for a short entry on both indices, but will post when I see the set up present itself.
Stuart, the invalidation point for FTSE on the weekly chart remains at the ATH.
There was a big black ? next to the label of intermediate (2).
That means I wasn’t certain intermediate (2) was over. Price now tells us it wasn’t.
May be done… or just a very small 5th now. Think Verne called the triangle just completed.
Thanks Gary!
Sorry Tom I didn’t see your chart below. Seems shorts have very weak hands but they will get stronger down lower.
No problem. I like your chart better. Nice wave count. 🙂
Yep. Those banksters really know how to shake the trees!! 🙂
Looks like we have another triangle of some sort developing as is typical of these bull/bear battles. It could be a small degree fourth. I would expect to see some sort of thrust from it counter to the trend which is then swiftly reversed. If we have one more pop to the upside the thrust should be down initially.
MMs refusing to move off 1.46 bid for those UVXY puts…hmmnnn
Here is a chart of the triangle.
Thanks Tom!
Your very welcome. Nice call!
So speaking of positions. Just wanted to share. I’m a professional options trader and this is one of my nearby positions for SPX. I also have others that are positioned way below the market for the continuation down. One thing about options is that you can adjust positions as price gyrates. You may have to zoom your browser settings to see the graph, as Joseph says.
Bid on 10 strike puts back up to 1.44. Here’s hoping for that pop to the upside to push the bid up to around 1.75-1.85….
Price action definitely consolidation against the next move…which direction…?
EWI acknowledges that this move off Monday’s lows so far only three waves…
is there any way to enlarge the screen captures here by clicking on tit in some way? To zoom in? Not Lara’s but the ones in this forum.
Zoom in your browser to 300%… that works for me.
I see. Thanks.
“by clicking on tit in some way ”
Why Tony, are you trying to titillate us in some way?! 🙂
You caught that eh mate? LOL
Hold down “Control” and hit “+” to zoom in.
Hold down “Control” and hit”-” to zoom out.
Exiting July UVXY 10 puts. Sold for 1.85, buying back for 1.38
I dislike this hesitation around what should be a very strong decline for a third wave down. We may have one more pop to the upside.
Keeping 5 strike puts to re-execute spread if UVXY moves lower. Open order to re-sell 10 strike puts @ 1.75 limit.
The banksters are fighting the decline. This usually means a sharp pop higher before the downtrend resumes in earnetst. Still too mcuh bullish sentiment imo…I want to see the 2000 pivot fall and stay fallen before I am all in…1/2 in below 2040.00
I like this posting positions idea… would rather just post the small number of trades I make and let the results speak, rather than trying to justify my opinions
Incidentally both the trades I have made this month so far I called here in advance:
Earlier in the month I called a local top in the SPX in a 4 point range (2118-2122), which is exactly the area it got to on 7th June before dropping 70 points.
I posted my pre Brexit short, and the reasons why I had confidence in the trade (and some folks chuckled because parts of my logic had little to do with TA or FA)
Still, I woke up the next day with 100 points profit. Not bad… So I took few days off.
Right now I’m totally out, SOH, waiting for the market to tell me what it’s going to do, and will stay that way until some clarity appears about which way its going to break next.
And, the next trade I take I will post with entry, target, and stop loss, either in advance or as close to real time as I can
posts were done on this, but now the official China news agency has stated they do intend to let the yuan fall 6.8% this year yet. Last year they let the yuan fall 4.5%. The article is a little confusing, saying the yuan already has declined by 5.6% from December 2015 until June 24th. So 1.2% more to go? Either way say goodbye to any bull market here in the USA. Source: Reuters news this morning.
IT appears to me that a potential double top may have been put in overnight in ES. 1st near the 5PM ES close yesterday and the 2nd at 6:40-7:00AM this morning.
Now, if this ES move lower continues… we will have confirmation.
Thoughts on Alt count: little 4th wave here now on 30min chart with a and b done, in c down now. Extended 3rd wave took place over June 28th and 29th. In 4th now, little 5th up yet. If that happens would be higher high of yesterday’s top and then a new price reversal/candlestick down for the daily chart. And have to watch for a complex 4th too, sucking up time (and my put option premiums).
I am not counting ES…
But if what I describe above proves to be a double top in ES prior to the open, than as Lara’s bear counts above show… it’s down from here. I am viewing a 10 min ES Chart.
Almost confirmed in ES… just need this little real time bounce to fail. With downwards movement accelerating away from here.
?????? not sure if it will hold DT. Bounce Taking too long to fail.
New ES Double Top possible at 2075.75 and is the new 2nd part.
We shall see if it is!
It lines up with now completed SPX structures discussed above.
I give up on the this posting follow-up… All I can say is we are close.
EDIT:
ES 2078 for 2nd… long upper wick on 10 min.
SPX 2085.23… not as long but a wick non the less on 10 min.
Shall See if this is it.
Jim – regarding the out of money puts you bought on QQQ, could you share what bid you put in to get them? where was the bid/ask spread at the time? Thanks
Edit: the OEX puts I bought (and will be buying) are just 5 and 10 basis points below the last low. Not WAY out like yours, but I like your idea. Last, check out the OEX (S&P 100) daily chart compared to the SPX daily chart, huge divergence, good for us bears.
The spread was BID .01 and Ask .03 and I tried .01 for awhile and then settled on .02 as I wanted in before market close. It looks the BID now is 0 and the ask is .02 so I wonder if someone could get .01 now although the Market Maker needs to make something so I doubt it.
This could be brilliant or a crazy idea so tread with caution…
without a doubt playing the roulette wheel here, but don’t have to wait in line for a flight to Vegas and can skip the body cavity TSA search!
Yet there is credence in the wave count too. Joseph has it right, a huge drop is coming one of these days, why not have some 0.02 option contracts on at all times? Good fun either way
Ris – one more thing which may help you. In your charts use a histogram indicator such as the Awesome Oscillator. There is one out there too called the EW oscillator. Try different time charts, i.e. a day, 2hr, 1hr, 15minm 5min and such. You’ll see the 3 waves show up because the oscillator will be at its deepest point (if going down, opposite of course if the wave 3 is up). Use the Oscillator to help you count. Wave 1 will be down, but not as much as wave 3rd, and the oscillator will show you this. Then many times with wave 5 you’ll see a divergence, as wave 5 is not as strong internally as 3, with price moving further but the oscillator will not. With exception where wave 5 is extended, always exceptions isn’t there?
MACD works in the same way. That’s why I keep it on my hourly charts.
Peter,
My EW charting is no way near you folks so taking baby steps with Fibonacci retracements as those seem to work in shorter timeframes better for me. If we take the move from Monday’s Low (1991) to today’s High (2073). We have the following likely retracement targets
0.236 2053.648
0.382 2041.676
0.500 2032
0.618 2022.324 (most logical point for a pause or short term trend change)
0.786 2008.548
1.000 1991
Also, assuming that the move from 1991 to 2073 was ‘a’ the next logical move is down for wave ‘b’ to somewhere between 2022-2009. Followed by ramp higher for wave ‘c’ to 2,087 (as that represent the 0.786 level from the bigger drop from 2,113). Thoughts?
THOUGHTS back Ris: my belief is Lara’s bear counts are correct. We’re dealing in probabilities so that is why one typically has more than one count, and also the counts change over time once price action tells us something is right/wrong or needs modification. Hence, this move up is a corrective wave upwards in a bear market. Since it has reached its price target (2066 which was the .618 retracement up, and now higher too levels too) the structure is complete. So, the market can begin down at any time….not that it has too. Still might go up to the .78 retracement which looks like it is this morning in e-minis pre-market. And it could retrace 100% too to the June 23rd high. Yet Lara’s words of ‘expect a down at any time’ is valid because the price structure is complete now. Getting wordy, but important, is we could complete a .78 or 100% retrace, then go down some, then come back up and do a retest of a sloping down trendline, all which could take another week or two. Or it could finish today and do the larger 3 wave down. Timing is the hardest of course. One reason I’m using put options this time, and I rarely use them. Using OEX July 29th ones, a few 22nd ones, and a few early August ones. As I said though, if I lose all the premiums it doesn’t bother me. I’m playing the 3 of 3 of 3 drop. Peter
Thought you all might appreciate this. Look at average 20 day drawdown when market goes down > 1.5% for 2 days then up > 1.5% for 2 days (which just happened). From SJD10304 on Twitter.
Hi Lara:
I sure hope your neck is feeling better. A good soak in the salty ocean I am sure will help. I sometimes have the same problem and lying supine on a very hard surface (like a wood floor) seems to provide a bid of relief.
Just wanted to say a big “Thank You” once again for all the excellent analysis, and particularly all the extra analysis bonuses lately. Very generous of you and greatly appreciated! 🙂
Thank you very much Verne, you’re welcome. I’m off to my osteopath this morning, that almost always works. Whether it be placebo or not I don’t care, I know I’ll be better.
No surf until my neck is feeling up to it.
FTSE analysis coming up soon to a website near you 🙂
The “Other Guys” (EWI, for those who are new) are seeing Monday’s low as the end of a minor two correction and are labeling this move up as minor three of intermediate five on the way to new ATH. Quite a relief when their count differs from Lara’s as I consider them the ultimate contrarian indicator!
The confidence in CB prowess is sky high and the crowd is absolutely convinced they are not going to “allow” the market to fall going into the holiday weekend. They have indeed done a great job the last two days. If we are in intermediate two up, there may not be divergence from the bullish count for a week or two. The possible intermediate one down completed in a very short three days. UVXY will probably make a new 52 week low today if we are in minute two and it continues a bit higher. If intermediate two, I suspect a reverse split might be in our future.
while the move under ten would ordinarily have me leaning toward the latter scenario, the extreme bullishness in the market currently could be resulting in some distorted risk signals. It is imo a time to be both cautious and nimble.
if /NQ can break below the cloud (left) and UVXY above the cloud (right) and close 3 bars on either appropriate side then we could be off to the races. (This is a 15 minute chart)
Hi Lara
Thanks for the regular analysis, as a relatively newcomer to EW (1 -year+) I am still in my apprenticeship and learning a lot, sometimes painfully as my main aim is to preserve my pension pot which I now live off in rainy Scotland.
I have one question which I hope is not too basic.
The SPX charts you use are market hours charts but I note that these differ quite alot from the other SPX charts which use 24hour data. As the index actually does move after hours does this not result in missing data from the SPX charts you use thus affecting the wave count?
The data I’m using comes directly from the NYSE, provided to me by BarChart.
It makes a difference to the wave count. 24 hour data is futures, the data I’m using is cash.
Futures are more highly leveraged and have slightly different price points for highs and lows, it makes a different wave count.
It makes a difference to trading too 🙁 My broker is using futures data. I can’t trade cash. So I have to be very careful where I place my stops, I have to give the market more room to move and use swing highs / lows which are further away than cash data.
I use cash data for this market for two reasons:
1. EW counts on futures are harder due to leverage, the rules aren’t so black and white.
2. That’s the only data feed I’ve found which is reliable and works in Motive Wave. My biggest limiting factor.
Thanks Lara
This explanation is most helpful.
Will you have time to take a look at FTSE soon, it is up over 750 points in a few days despite BREXIT. My own EW drawings suggest a complex triple zig-zag correction to end wave 2 around 6745?
Thank you. I really appreciate the objective TA and explanations and the why to back it up. Just EW. If I needed more noise, I don’t, I would subscribe to TV and soak up Cnbc views. I’m learning something here, as it makes sense, and . . . consistently profiting.
P.S. these running dialogues are also appreciated.
Lara,
Just a note regarding earlier comments on the 29th. I have not been scarce on the forum due to my short position being under water although that is true. I have been traveling the last three days and up to my eyeballs in responsibilities. In addition as Olga remarked earlier, sometimes the intraday member commentary gets a bit emotional / tense. That can have an adverse effect on some people. In those times, I try to limit my comments so I am not a part of the conversation. It kind of puts me outside of it. Enough on that.
Thanks for the update analysis and commentary. As Joe mentioned earlier many are thinking the whole Brexit thing was overdone and the bull has returned. They believe it is only a matter of time before we break out to a new ATH. It is basically all over the news. But when we look deeper into the market, we are seeing a different picture. If the count is correct it will not be long before the picture is clear to everyone. That is the day of the collapse.
Best to all.
Thanks Lara for your detailed analysis! Im learning a lot! Thanks
Once again, the second wave is doing its job 🙂
Primary 2 did that, then it was minor 2 of primary 3, and now minute 2 of minor 3…
I dunno, that Dennis Gartman fella said he’s selling this rip… that just might mean ATH are right around the corner given past things he’s said. He’s been a good contrarian indicator for me.
Ruut Roo, that is a pretty reliable contrArian indicator. I enjoy reading Zero Hedge go off on how bad his trades usually are 🙂
Yep. I also use the Gartman indicator. Works (almost) everytime 🙂
Aha, okay. May your travels be good, don’t get eaten by bears Rodney.
I understand the need to step away, everyone should do it from time to time. I do it for two weeks at Christmas 🙂
I like reading your stuff laura
I have you and Tom Prindaville’s charts
happy to share them with you.. you have my email mraspen …
Thank you Don.
Just so everyone is clear, I do want you all to continue to use this space to discuss pretty much whatever you want to discuss. It doesn’t have to be TA focussed, we have had some interesting discussions on political and social issues here too. Long may it continue.
Short conversational posts while some hang out together during NY session hours is also very welcome. It’s your space.
As long as everybody is polite, respectful and refrains from any negative personal comments. Which is pretty much what everyone’s doing.
The problem currently was (I’m using past tense consciously here) strong bullish statements. Particularly any calls for new ATH’s, when price moves higher, without any TA in support of the prediction.
Ok, gotcha. Tnx!
Ok, to also adjust to request to stick to analysis and reveal personal trades, here is my take. I have used Lara’s recent post on the NASDAQ and what is going on with SPX and decided to buy 85 July out-of-the money QQQ Puts at .02 per contract. 1000 contracts. (.QQQ160715P85) For ever cent it moves in the right direction I make $1,000. See attached QQQ Chart. QQQ has responded nicely to Fib sequence, red dashed line and the Option positions by all traders still points down in balance. You can see QQQ hit the top of the Ichimoku cloud which should offer resistance. I believe QQQ a bit of early warning for the SPY. SPY is the left axis and QQQ is the right axis. I think it will pull another August like correction pattern.
Cheers,
Jim
Thanks for sharing Jim. That’s a huge call… its wayyyy out of the money.
I totally agree with your thoughts on Nasdaq: it is the most bearish of the 3 US indices. I trade SQQQ options myself…
One thing to note in Lara’s Nasdaq analysis, Nasdaq is already in intermediate 3 of primary 3! So we’re about to see the swiftest part of the move (minor 3 of intermediate 3 of primary 3) in the next few days. So your position may actually pay off here big time 🙂 I’m actually very happy with this big correction, because now minor 3 of intermediate 3 of primary 3 for Nasdaq is still coming. Minor 4 in the current labeled chart, moved into minor 1 price territory, which means that where minor 3 stands should be minor 1, and this very deep correction is minor 2… Minor 3 coming up 🙂
I loaded up on September 22 and 23 call options during this correction (1/3 position opened yesterday, and 2/3 opened today). We just had a shorts-tearing correction up, its time to enjoy the ride down with some naked puts 🙂
I buy slightly out of money puts, and I prefer to pay extra for time (September), but your call is wayyyyy out of the money 🙂 Best of luck on your position!
Yes prepared to loose it all but if on the chance we see a big move it will move towards the money and pick up value but is going to take a big big move…
I do own Jan 17 and Jan 18 PUTS for SPY and QQQ and have since May and June of 15 🙂 so I can be very. very patient.
Tard(y)!
2
first!