Upwards movement unfolded as expected for the session.
Summary: A correction most likely ended today with a throwback to test resistance at the black trend line on the daily chart. A short term target for the next wave down is 1,987.
Trading advice (not intended for more experienced members): Short positions entered reasonably above 2,100 should hold, and shorts opened today at the high when price touched and slightly overshot the black trend line should hold. Stops may be moved to break even to reduce risk if positions are positive. If price bounces again, it should offer a better entry point. If using this approach to manage risk, then traders will need to watch the market carefully over the next few days and be nimble to take any future opportunities if presented.
Looking at the bigger picture, any short positions entered here should be profitable this week and may still offer a very good risk / reward set up. However, any members entering short here must understand there is a risk the position may be underwater for several days before becoming profitable. With that in mind, it is essential to manage risk: no more than 5% of equity should be risked if entering short here.
Stops (and risk) for new positions must be just above 2,120.55.
Last published monthly charts are here.
New updates to this analysis are in bold.
BEAR ELLIOTT WAVE COUNT
WEEKLY CHART
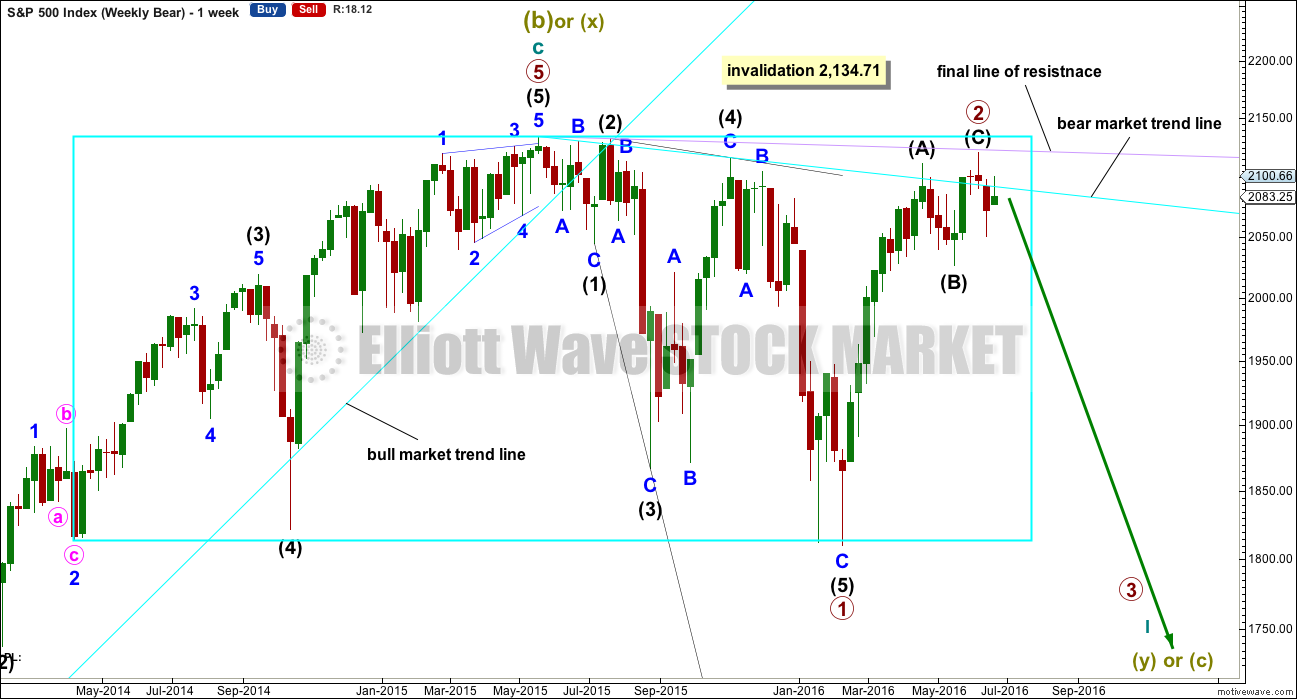
The box is added to the weekly chart. Price has been range bound for months. A breakout will eventually happen. The S&P often forms slow rounding tops, and this looks like what is happening here at a monthly / weekly time frame.
Primary wave 1 is seen as complete as a leading expanding diagonal. Primary wave 2 would be expected to be complete here or very soon indeed.
Leading diagonals are not rare, but they are not very common either. Leading diagonals are more often contracting than expanding. This wave count does not rely on a rare structure, but leading expanding diagonals are not common structures either.
Leading diagonals require sub waves 2 and 4 to be zigzags. Sub waves 1, 3 and 5 are most commonly zigzags but sometimes may appear to be impulses. In this case all subdivisions fit perfectly as zigzags and look like threes on the weekly and daily charts. There are no truncations and no rare structures in this wave count.
The fourth wave must overlap first wave price territory within a diagonal. It may not move beyond the end of the second wave.
Leading diagonals in first wave positions are often followed by very deep second wave corrections. Primary wave 2 would be the most common structure for a second wave, a zigzag, and fits the description of very deep. It may not move beyond the start of primary wave 1 above 2,134.72.
So far it looks like price is finding resistance at the lilac trend line. Price has not managed to break above it.
DAILY CHART
Primary wave 2 would be a 0.96 correction of primary wave 1. Second wave corrections following first wave leading diagonals are commonly very deep, so this fits the most common pattern if primary wave 1 was a leading diagonal.
The most common structure for a second wave correction is a zigzag.
There is no Fibonacci ratio between intermediate waves (A) and (C).
Draw a channel about primary wave 2 using Elliott’s technique for a correction: draw the first trend line from the start of the zigzag, then a parallel copy on the end of intermediate wave (A).
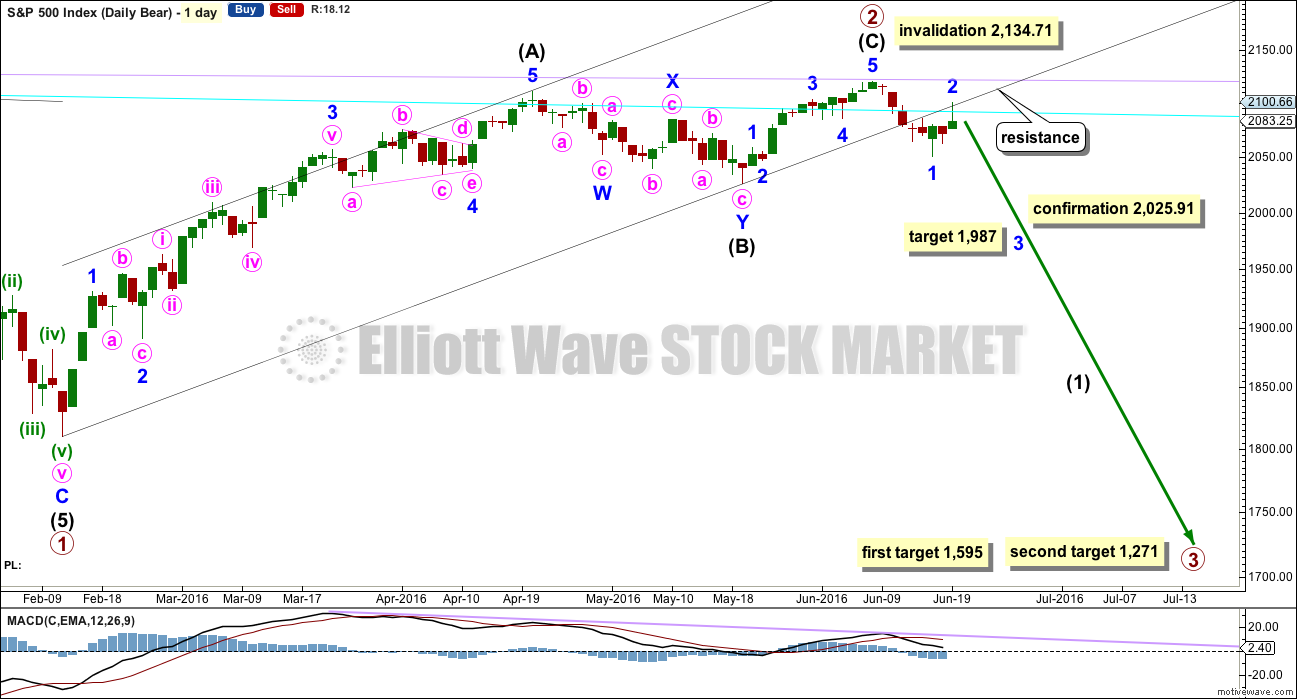
Intermediate wave (C) is a complete impulse and primary wave 2 is a complete zigzag. With two full daily candlesticks below the wide black channel and not touching the lower edge, there is some confidence that primary wave 2 is over.
At this stage, it looks like minor wave 1 ended at the low for last week and minor wave 2 may have ended today with a throwback to test resistance at the lower edge of the black channel.
Minor wave 2 may have been quicker than expected, totalling a Fibonacci two days.
Intermediate wave (C) lasted a Fibonacci thirteen days. Intermediate wave (B) lasted a Fibonacci twenty-one days and intermediate wave (A) lasted forty seven days (not a Fibonacci number). Primary wave 2 would have lasted eighty one days (also not a Fibonacci number). If primary wave 3 exhibits a Fibonacci duration, then a reasonable estimate would be a Fibonacci 144 days.
A new low below 2,025.91 would provide final price confirmation of a trend change. At that stage, downwards movement could not be a second wave correction within intermediate wave (C) and so intermediate wave (C) would have to be over.
The targets calculated are provisional only. They come with the caveat that price may yet move higher which means the targets would move correspondingly higher. They also come with the caveat that at this very early stage a target for primary wave 3 may only be calculated at primary degree. When intermediate waves (1) through to (4) within primary wave 3 are complete, then the targets may change as they can be calculated at more than one wave degree. Primary wave 3 may not exhibit a Fibonacci ratio to primary wave 1.
The first target at 1,595 is where primary wave 3 would reach 1.618 the length of primary wave 1. This target would most likely not be low enough because primary wave 2 is very deep at 0.96 the length of primary wave 1. Primary wave 3 must move below the end of primary wave 1, and it must move far enough below to allow subsequent room for primary wave 4 to unfold and remain below primary wave 1 price territory. Normally, there is a gap between first wave and fourth wave price territory, particularly in a bear market.
The next target may be more likely. At 1,271 primary wave 3 would reach 2.618 the length of primary wave 1.
If primary wave 3 does not exhibit a Fibonacci ratio to primary wave 1, then neither of these targets would be correct.
Well before these targets, it should be obvious if the next wave down is a primary degree third wave. It should exhibit increasing ATR, strong momentum, and a steep slope. However, please note that although it may begin very strongly it does not have to. It may also be that intermediate wave (1) maintains an ATR about 20 – 30 and has some deep time consuming corrections within it. That was how the last primary degree third wave began within the last bear market, so it may happen again.
MAIN HOURLY CHART
Ratios within minor wave 1 are: minute wave iii is just 0.24 points longer than 1.618 the length of minute wave i, and minute wave v is 1.69 points short of 2.618 the length of minute wave iii.
Ratios within minute wave v are: minuette wave (iii) is 1.72 points short of 2.618 the length of minuette wave (i), and minuette wave (v) is 1.26 points longer than equality in length with minuette wave (iii).
With excellent Fibonacci ratios, this labelling has a good probability. The only problem is the proportion of minuette wave (iv) to minuette wave (ii), but the S&P does not always exhibit good proportions.
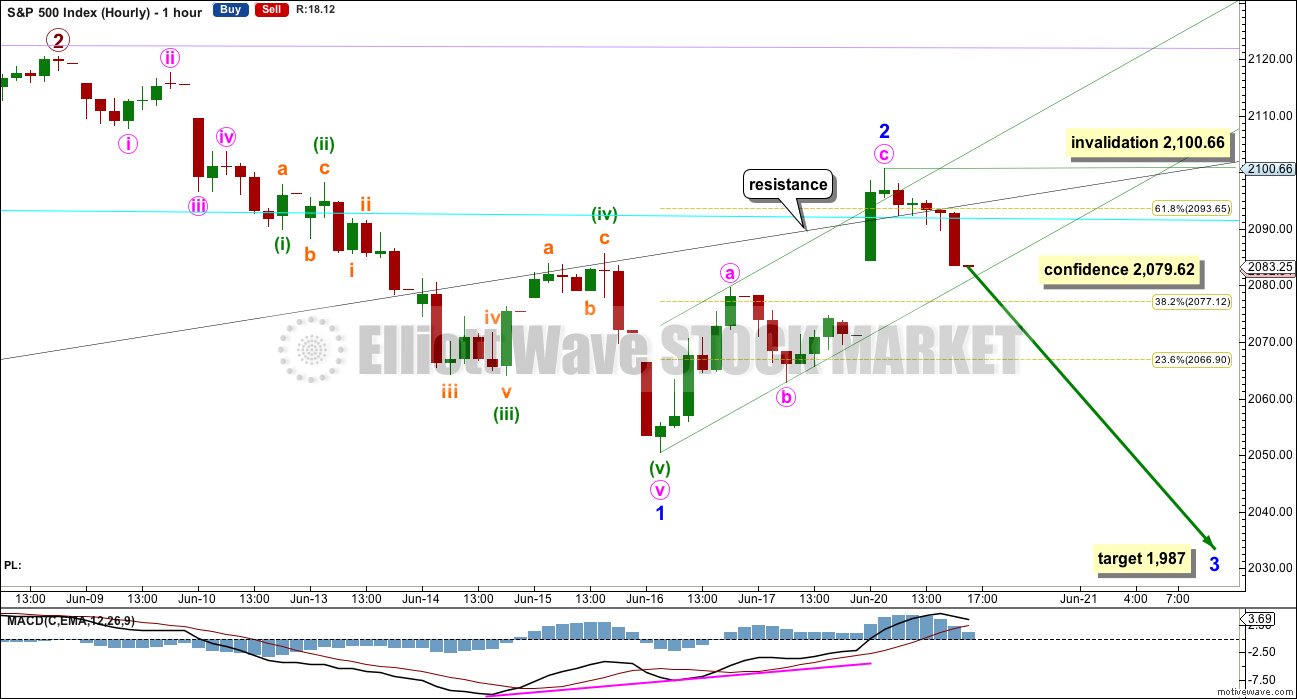
Minor wave 2 may be over as a quick deep zigzag. There is no Fibonacci ratio between minute waves a and c within it. Minute wave c overshoots the channel about this zigzag, which is fairly typical of C waves. Price tested resistance at the black trend line and moved above it for some of this session to find support. The strong break back below the trend line at the end of the session indicates minor wave 2 may be over.
No second wave correction may move beyond its start above 2,100.66 within minor wave 3. At 1,987 minor wave 3 would reach 1.618 the length of minor wave 1. If price keeps falling through this first target, then the next target would be at 1,917 where minor wave 3 would reach 2.618 the length of minor wave 1.
A new low below 2,079.62 would invalidate the alternate hourly wave count below. At that stage, more confidence may be had that minor wave 2 is very likely over.
ALTERNATE HOURLY CHART
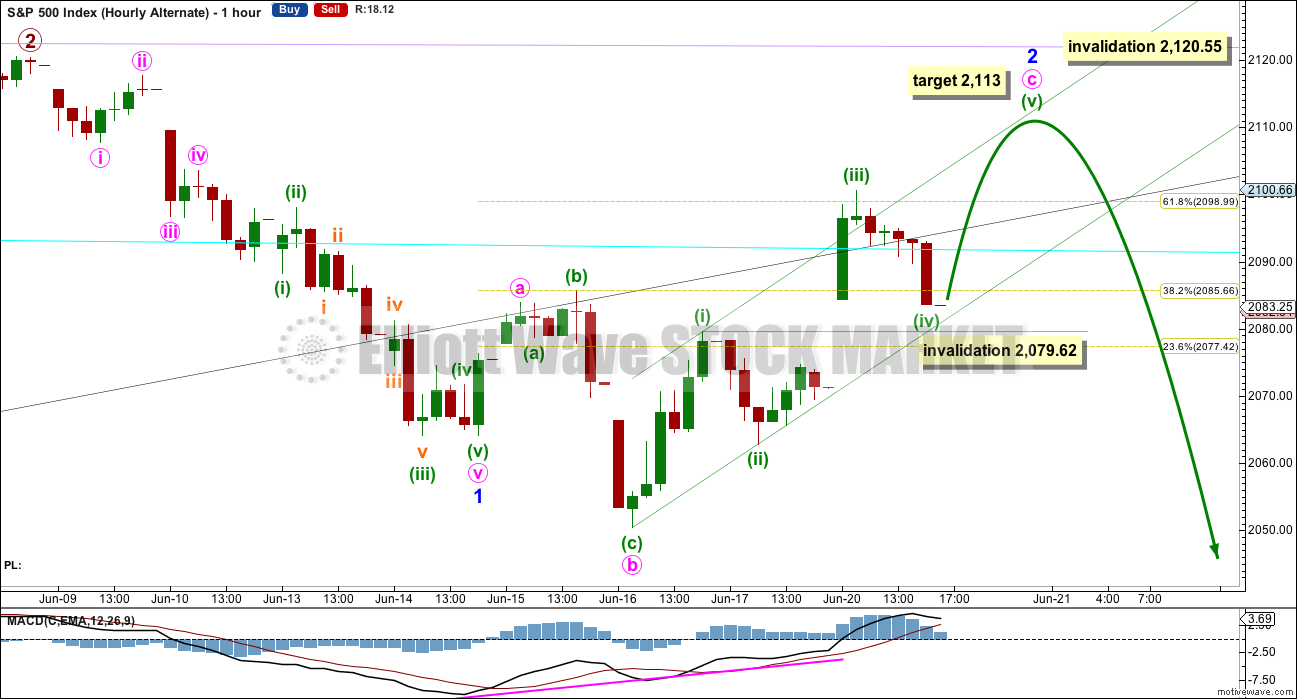
Minor wave 2 may be unfolding as an expanded flat correction. Divergence between price and MACD at the hourly chart level supports this wave count, but it is not supported at lower time frames.
Ratios within minor wave 1 are: minute wave iii is just 0.24 points longer than 1.618 the length of minute wave i, and minute wave v has no Fibonacci ratio to either of minute waves i or iii.
Ratios within minute wave v are: there is no Fibonacci ratio between minuette waves (i) and (iii), and minuette wave (v) is just 0.06 short of 0.382 the length of minuette wave (i) (ratios here calculated on the five minute chart).
With reasonable Fibonacci ratios for this labelling, it has a reasonable probability.
Within minor wave 2, minute wave b would be a 1.69 length of minute wave a. This is longer than the common length but within allowable limits.
The structure of minute wave c is incomplete. It must subdivide as a five. So far minuette waves (i) through to (iv) may be complete. If it moves any lower, minuette wave (iv) may not move into minuette wave (i) price territory below 2,079.62.
At 2,113 minuette wave (v) would reach equality in length with minuette wave (i).
Minor wave 2 may not move beyond the start of minor wave 1 above 2,120.55.
This wave count expects one more day most likely of upwards movement to complete a correction. However, the round number pivot of 2,100 and the black trend lines would be expected to provide strong resistance. This favours the main hourly wave count over this alternate which must overcome some of that resistance before returning downwards.
BULL ELLIOTT WAVE COUNT
WEEKLY CHART
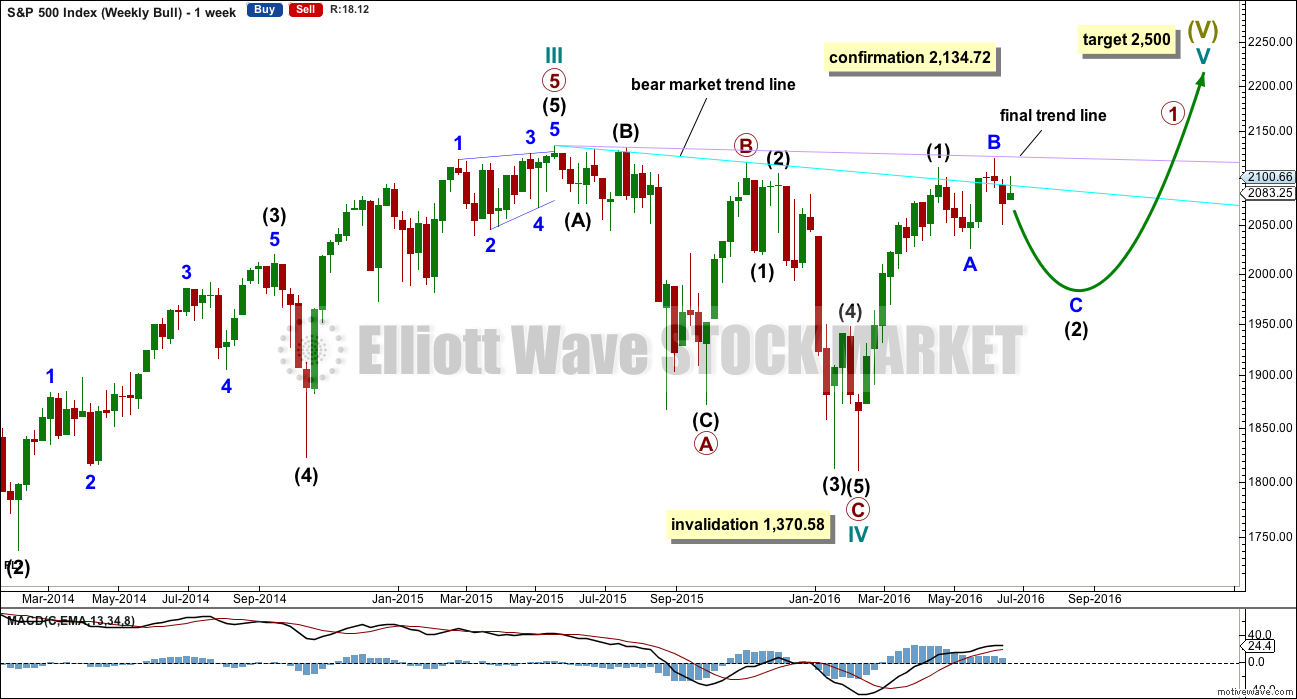
Cycle wave IV is seen as a complete flat correction. Within cycle wave IV, primary wave C is still seen as a five wave impulse.
Intermediate wave (3) has a strong three wave look to it on the weekly and daily charts. For the S&P, a large wave like this one at intermediate degree should look like an impulse at higher time frames. The three wave look substantially reduces the probability of this wave count. Subdivisions have been checked on the hourly chart, which will fit.
Cycle wave II was a shallow 0.41 zigzag lasting three months. Cycle wave IV may be a complete shallow 0.19 regular flat correction, exhibiting some alternation with cycle wave II and lasting nine months. Cycle wave IV would be grossly disproportionate to cycle wave II, and would have to move substantially out of a trend channel on the monthly chart, for it to continue further sideways as a double flat, triangle or combination. For this reason, although it is possible, it looks less likely that cycle wave IV would continue further. It should be over at the low as labelled.
At 2,500 cycle wave V would reach equality in length with cycle wave I.
Price has now broken a little above the bear market trend line. This line is drawn from the all time high at 2,134.72 to the swing high labelled primary wave B at 2,116.48 on November 2015. This line is drawn using the approach outlined by Magee in the classic “Technical Analysis of Stock Trends”. To use it correctly we should assume that a bear market remains intact until this line is breached by a close of 3% or more of market value. Now that the line is breached, the price point at which it is breached is calculated about 2,093.58. 3% of market value above this line would be 2,156.38, which would be above the all time high and the confirmation point.
This wave count requires price confirmation with a new all time high above 2,134.72.
While price has not made a new high, while it remains below the final trend line (lilac) and while technical indicators point to weakness in upwards movement, this very bullish wave count comes with a strong caveat. I still do not have confidence in it. It is produced as an alternate, because all possibilities must be considered. Price managed to keep making new highs for years on light and declining volume, so it is possible that this pattern may continue to new all time highs for cycle wave V.
The invalidation point will remain on the weekly chart at 1,370.58. Cycle wave IV may not move into cycle wave I price territory.
This invalidation point allows for the possibility that cycle wave IV may not be complete and may continue sideways for another one to two years as a double flat or double combination. Because both double flats and double combinations are both sideways movements, a new low substantially below the end of primary wave C at 1,810.10 should see this wave count discarded on the basis of a very low probability long before price makes a new low below 1,370.58.
DAILY CHART
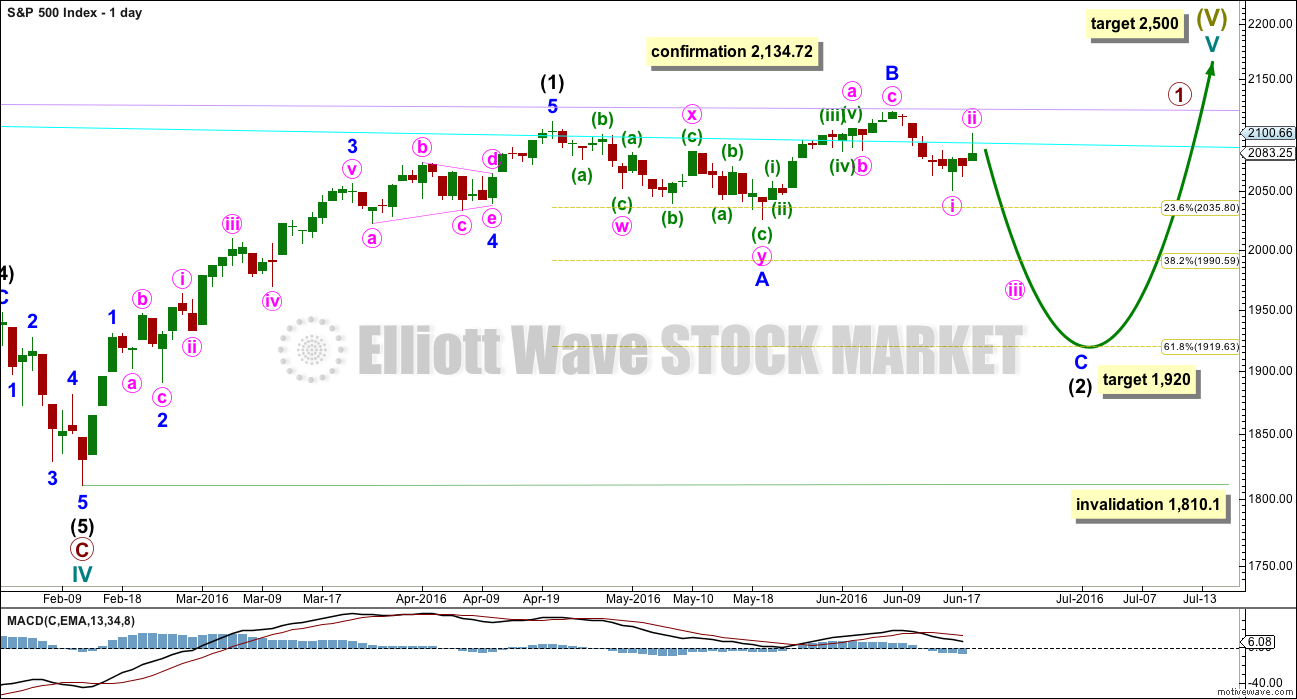
Intermediate wave (2) may still be an incomplete flat correction. Minor wave A will subdivide as a three, a double zigzag, and minor wave B may be seen as a single zigzag.
The most likely point for intermediate wave (2) to end would be the 0.618 Fibonacci ratio at 1,920.
Intermediate wave (2) may not move beyond the start of intermediate wave (1) below 1,810.10.
While it is possible that intermediate wave (2) may be a complete double zigzag at the low labelled minor wave A, this would be a very shallow and rather quick second wave correction. The first reasonable second wave correction within a new bull market should be expected to be deeper and more time consuming for this bull wave count, so intermediate wave (2) is expected to continue.
TECHNICAL ANALYSIS
WEEKLY CHART
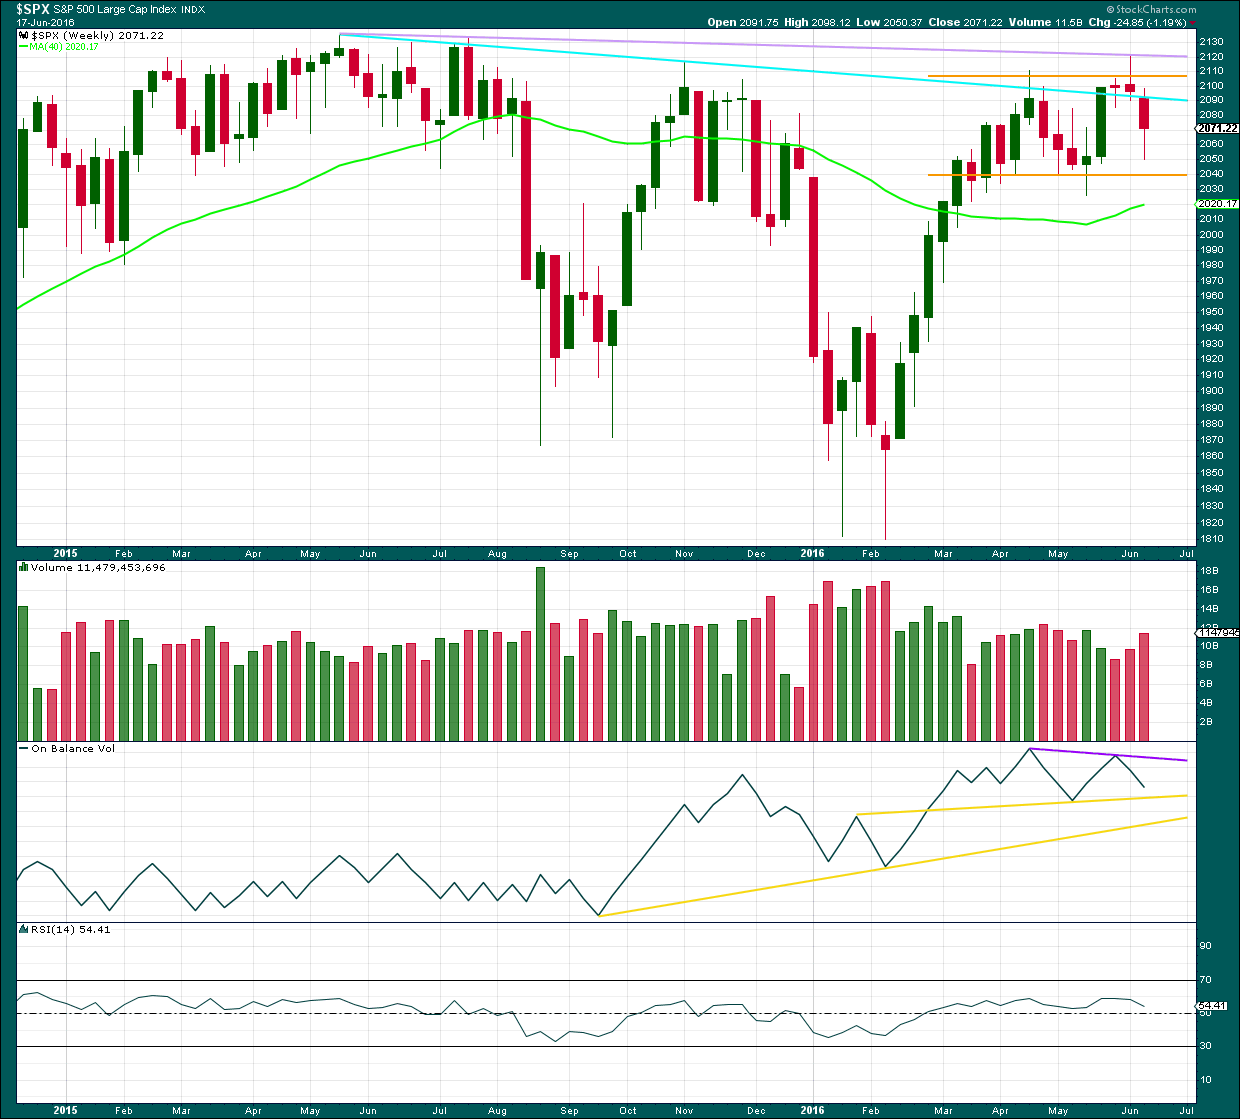
Click chart to enlarge. Chart courtesy of StockCharts.com.
The reversal implication of the shooting star candlestick pattern for last week is now confirmed by a strong red weekly candlestick which gapped down. This week’s candlestick pattern may be considered to have completed an Evening Doji Star pattern, albeit with two doji at the high.
Along the way down, price may find some support about 2,040.
Upwards movement made an important new high last week but could not manage to break above the final lilac line of resistance. That line remains intact and is now strengthened.
Volume has increased for a downwards week, but as this includes an options expiry date it should not be considered as definitive. Volume for the two downwards weeks prior also showed some increase, although volume was light. It looks like so far the market may be falling of its own weight; selling pressure is light. If selling pressure increases, then look out for a strong increase in downwards momentum.
On Balance Volume trend lines are redrawn this week: support in yellow and resistance in purple. OBV would allow for a little further downwards movement before it finds support at the first yellow line. This may indicate where a bounce may turn up.
DAILY CHART
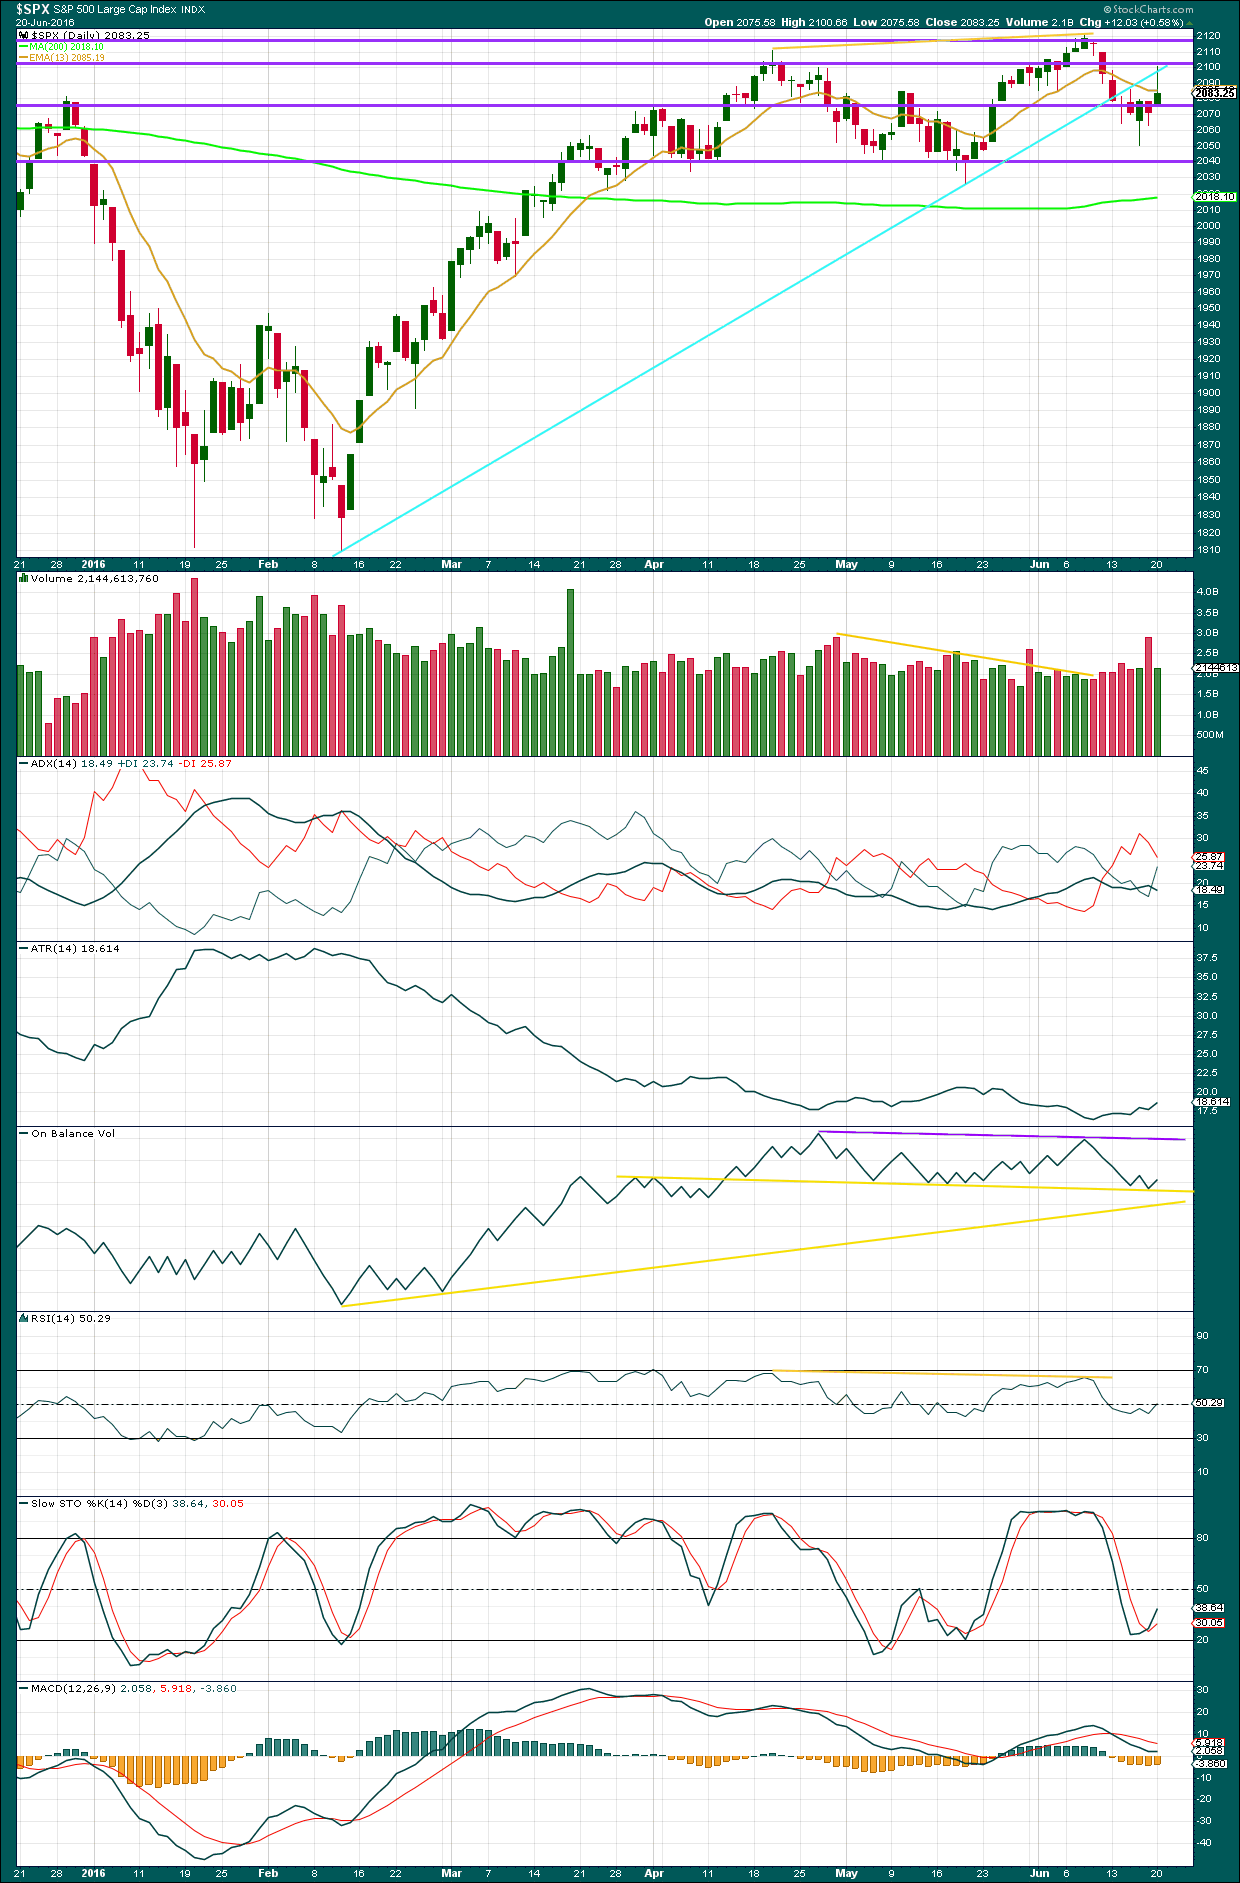
Click chart to enlarge. Chart courtesy of StockCharts.com.
Volume data on StockCharts is different to that given from NYSE, the home of this index. Comments on volume will be based on NYSE volume data when it differs from StockCharts.
NYSE volume data appears to be putting the options expiration volume in today’s candlestick, not Friday’s. StockCharts data appears to be putting it into Friday’s candlestick. Analysis of the 30 minute time frame on NYSE shows greater volume today for downwards movement than upwards. On balance, given conflicting volume data, my conclusion will be taken from the lower time frame: there looks to be more support today for downwards movement.
Today’s candlestick completes another shooting star candlestick pattern. The long upper wick today is bearish. The bearish implications of this candlestick are supported by the upper wick touching the resistance line about 2,100 and the cyan trend line.
ADX today turned downwards. The +DX and -DX lines are coming close together, so if they cross over that would indicate a trend change from down to up. For now ADX is not indicating a trending market.
ATR is now showing some increase indicating the market may be beginning a trend. When ATR and ADX are in agreement, then more confidence may be had in a trend.
On Balance Volume found support at the upper yellow line. A break below this line would be a strong bearish signal. There is room for OBV to rise though, the purple line offering resistance is some reasonable distance away.
RSI is neutral. There is plenty of room for price to rise or fall. Stochastics has not reached oversold. There is room for price to fall.
VOLATILITY – INVERTED VIX MONTHLY CHART
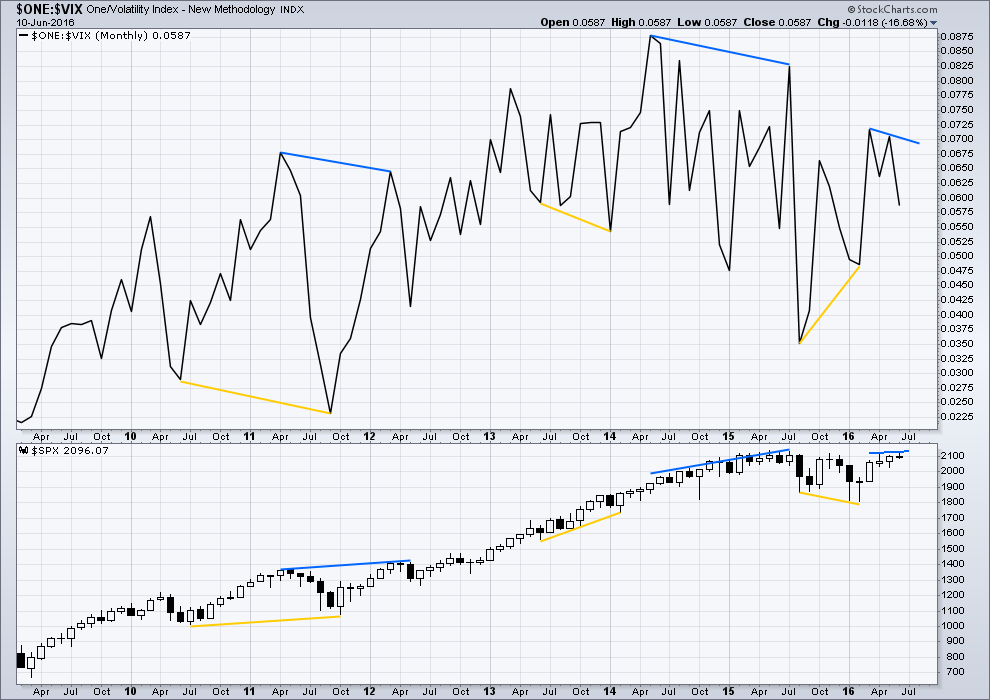
Click chart to enlarge. Chart courtesy of StockCharts.com.
Several instances of large divergence between price and VIX (inverted) are noted here. Blue is bearish divergence and yellow is bullish divergence (rather than red and green, for our colour blind members).
Volatility declines as inverted VIX rises, which is normal for a bull market. Volatility increases as inverted VIX declines, which is normal for a bear market. Each time there is strong multi month divergence between price and VIX, it was followed by a strong movement from price: bearish divergence was followed by a fall in price and bullish divergence was followed by a rise in price.
There is still current multi month divergence between price and VIX: from the high in April 2016 price has made new highs in the last few days but VIX has failed so far to follow with new highs. This regular bearish divergence still indicates weakness in price.
VOLATILITY – INVERTED VIX DAILY CHART
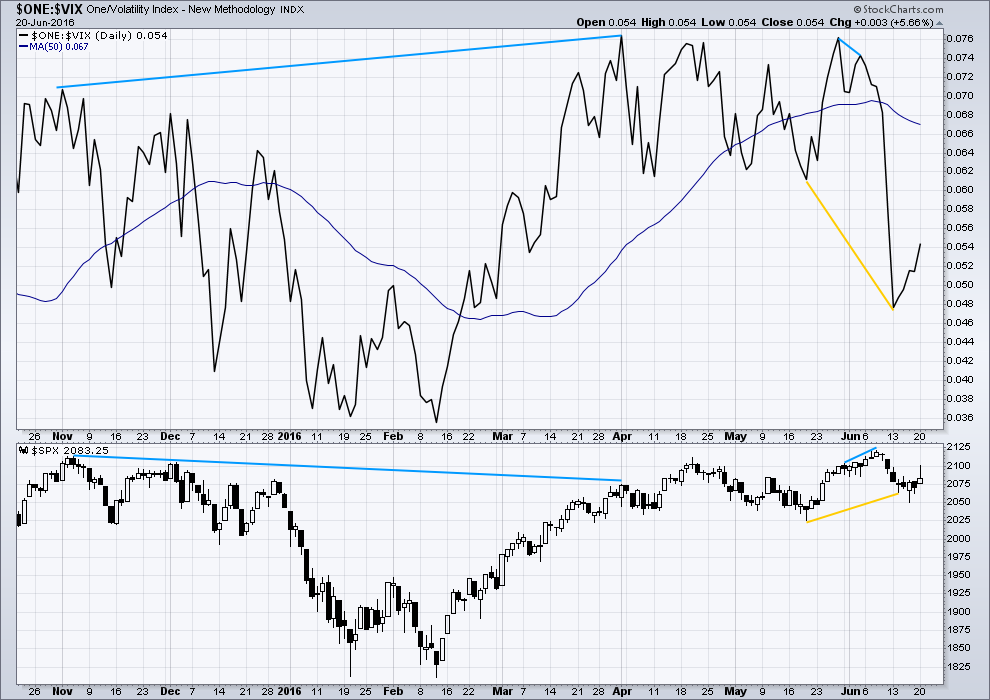
Click chart to enlarge. Chart courtesy of StockCharts.com.
There is now only one instance of hidden bearish divergence noted on this daily chart of price and VIX (blue lines). VIX makes higher highs as price makes lower highs. The decline in volatility is not matched by a corresponding rise in price. Price is weak.
VIX (inverted) has run away strongly from price. Volatility sharply increased beyond the prior point of 19th May (yellow lines) while price fell.
A divergence 101 interpretation of this is bullish. Volatility is stronger than it was on 19th of May, but this has not translated into a corresponding new low for price. Price is weak. Some upwards reaction would be a reasonable expectation about here to resolve this divergence. At this stage, it looks like that interpretation was correct as it has been followed by some upwards movement from price.
Price fell after the short term bearish divergence noted here (short blue lines). Now, after short term bullish divergence (yellow lines), price is rising.
Volatility declined today as price moved higher. This is normal. Price may now have moved high enough to resolve the short term bullish divergence.
While I would not give much weight to divergence between price and many oscillators, such as Stochastics, I will give weight to divergence between price and VIX. Analysis of the monthly chart for the last year and a half shows it to be fairly reliable.
BREADTH – ADVANCE DECLINE LINE
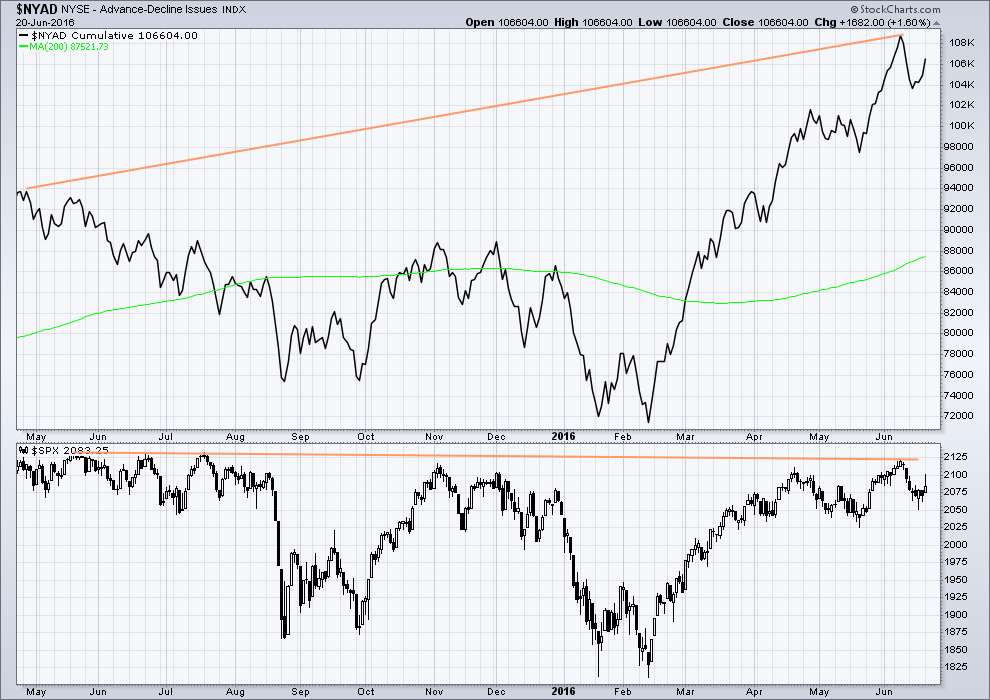
Click chart to enlarge. Chart courtesy of StockCharts.com.
With the AD line increasing, this indicates the number of advancing stocks exceeds the number of declining stocks. This indicates that there is breadth to prior upwards movement.
Taking a look at the bigger picture back to and including the all time high on May 2015, the AD line is making substantial new highs but price so far has not. While market breadth is increasing beyond the point it was at in May 2015, this has not translated (yet) into a corresponding rise in price. Price is weak. This is hidden bearish divergence.
DOW THEORY
The last major lows within the bull market are noted below. Both the industrials and transportation indicies have closed below these price points on a daily closing basis; original Dow Theory has confirmed a bear market. By adding in the S&P500 and Nasdaq a modified Dow Theory has not confirmed a new bear market.
Within the new bear market, major highs are noted. For original Dow Theory to confirm the end of the current bear market and the start of a new bull market, the transportation index needs to confirm. It has not done so yet.
Major lows within the prior bull market:
DJIA: 15,855.12 (15th October, 2014) – closed below on 25th August, 2015.
DJT: 7,700.49 (12th October, 2014) – closed below on 24th August, 2015.
S&P500: 1,821.61 (15th October, 2014) – has not closed below this point yet.
Nasdaq: 4,117.84 (15th October, 2014) – has not closed below this point yet.
Major highs within the new bear market:
DJIA: 17,977.85 (4th November, 2015) – closed above on 18th April, 2016.
DJT: 8,358.20 (20th November, 2015) – has not closed above this point yet.
S&P500: 2,116.48 (3rd Nobember, 2015) – has now closed above this point on 8th June, 2016.
Nasdaq: 5,176.77 (2nd December, 2015) – has not closed above this point yet.
It is a reasonable conclusion that the indices are currently in a bear market. The trend remains the same until proven otherwise. Dow Theory is one of the oldest and simplest of all technical analysis methods. It is often accused of being late because it requires huge price movements to confirm a change from bull to bear. In this instance, it is interesting that so many analysts remain bullish while Dow Theory has confirmed a bear market. It is my personal opinion that Dow Theory should not be accused of being late as it seems to be ignored when it does not give the conclusion so many analysts want to see.
This analysis is published @ 09:12 p.m. EST.

My position in the market has evolved a bit today. About 13 years ago when I was living in California there was a recall vote for the Governor. The polls kept showing 50/50 split, but at the end of the day, the only real motivated voter was the one who wanted him out. The Governor was recalled.
The motivated voter goes to the polling place and actually votes. I think Brexit voters will do the same. Even though a poll says you are for staying in, are you actually going to go and vote? Do what I do, not what I say.
Good morning. Another paint drying day. No clarity from the market today. Both wave counts the same and analysis will be the same mostly.
I’m keeping an eye on Peter’s idea, see my comment to that below.
As Olga rightly points out below, this is still intermediate (1). There will be plenty of small range days, a few doji on the way down. ATR may stay about 20-30. Today it is 17.75 so far, but then this is the very start of intermediate (1) still.
I am musing… maybe I need to move my degree of labelling for minor 1, 2 down one? Maybe that’s only minute i, ii?
If my alternative count doesn’t pan out there is no weird New Zealand custom like I have to ship 10 sheep down to you or something? Not sure how you NZ people roll….
No more sheep please, we have enough. 4.5 million people and over 30 million sheep….. so….
🙂
I take it there is no silence of the lambs in NZ…? 🙂
I’m still laughing!
or,, New Zealanders sleep well,,, plenty of sheep to count,,( said with a sheepish grin)
I just got an email reply from a sheep,,, she said that was a really BAAA-d joke
LOL!
I used to live in a rural section of Montana. Less than 1 million people in the state. (I had to leave because it was getting too crowded.)
10 million sheep and 12 million head of cattle. No one bothers to count the horses, domestic or wild. They have permits for catching and keeping wild horses just like hunting but keeping them alive.
Nah…..just some no. 8 wire will do.
LOL
I think only Kiwis may get that one Dermot… and those who have lived in NZ
I like the minute wave 1 down degree labeling. I have been looking hard at Peter’s idea as well. My main problem is that it would seem unlikely that a new ATH would not be achieved in the ending diagonal intermediate w(c). And, if that happens then the price structure would be outside of the cycle (b) channel by a large amount.
I think it could do it. My biggest problem is the channel.
but then, the S&P does not always play nicely with channels
IMO that large one on the daily chart should work though.
If this is what we are discussing regarding Peter’s idea, then it would surely be an epic head fake to a vast majority of long positions.
closed out my long e-minis from yesterday, got 10.25 basis points. Appears a “b” down is taking place of the Minor 3 up
Need to start down now if this idea is valid. The small degree waves are a little clearer on a 3 min chart, but this whole structure is really hard to count with high confidence.
A sell off here would make your count look very strong Gary.
Yes, but nothing really changed for Lara’s main count…need 2079.62 to the downside to eliminate 4th wave and 2100.66 to the upside to confirm minor w(2) incomplete.
I have the same count just concerned the banksters may kick in here at the end
I think we have a barrier triangle for a fourth wave. We should get one more spike up to end the tussle. Bye!
If this is a fourth wave, it certainly is getting a bit long in the tooth.
I really hate wrangling so close to round numbers so I am going hedge with a bullish SPY 208/206 put spread and go do something other than watch the bears play with their food. Looks like no one wants to make a move before Brexit gets decided. Cheerio!
O.K. Let see how the bears respond to that last cash dump; we should see some serious red now if they mean business or else I am off to other endeavours till tomorrow…
somebody get a defibrillator out and use it on the s&p
Thanks for the laugh. I needed that!
The bears must have heard me. They seem to be ready to stomp that shelf-buying cohort….should be an interesting tussle…those buyers are not going to go quietly I don’t think…If they break it, Friday’s gap will be quickly filled.
The support shelf on several indices being bought today very consistently. It is starting to almost look like algo trading. Very interesting and I am not sure why those particular levels are being supported….
Without some aggressive sellers stepping up to break that shelf this sideways tango could go on into the close…
And here are the sellers to assault that shelf!
I don’t know it’s relevant, but that shelf is the 50% retracement of the Friday afternoon low to the Monday morning high.
Anyone else get the feeling we’re about to sell off here? I just got short 1/4 position. waiting to see it break down before adding another 1/4.
Yes sir,
Oil, UVXY, and Nasdaq (I trade the SQQQ…) are all pointing south…
However, check out Peter’s chart below… I think it might be a good alternate.
You can look at it both ways:
1. The market may meander until Brexit vote, and then we’ll have a big move.
2. The uncertainty of the Brexit will create volatility going into the vote, that will continue after the vote.
Either way, I think markets will move down after the vote. IMHO, if its a “stay vote,” then sell the news. If its a “leave vote,” then we all know what that means 🙂
4 hour chart. Changed the 1-2-3-4-5’s to a-b-c’s for the waves 1, 3 and 5 up. As Lara pointed out to me the normal count is using a-b-c’s for waves 1, 3 and 5 up in an ending wedge (or diagonal). Noting i’ve seen 1-2-3-4-5’s in waves 1, 3 and 5 up in such a formation in commodities markets, but should use the preferred counting.
My base premise is Intermediate (C) in the daily bear chart is too short both in time and days/length, thus it is a smaller degree wave. Confirmation of this pattern in the chart will be when price go above 2120.52 with Minor 3 up.
Peter, the way the market is meandering here you might very well be onto something. Thanks for the count…
I charted it and I’ll keep any eye on it. This is possible Peter.
I don’t like how price has breached the channel (black) and is finding resistance at the lower edge. That doesn’t look right for this wave count.
If it shows itself to be true (probably before invalidation above 2,120.55) then I’ll publish it.
Looks like brexit is not going to happen. Ah….now the market and the world are safe.
We’ll see – I hoped in my lifetime it would be a country worth living in again (I was born there but left over 15 years ago), but maybe not. (Actually more like driven out as I could not take the situation there any longer)
What is striking for me is just how selfish the debate is. Every person I have heard / spoken to is only interested in what they are told is better for them personally – not what is better for the country.
My biggest customer is situated in Spain, but for the sake of the UK and particularly sovereignty & democracy I want out. This is a decision that is far more important than my company / bank account.
You only need to look at the list of people that want UK to stay in EU to know that it is not what is best for 99% UK population (imho) 🙂
I hear ya Olga. It makes my head absolutely spin to hear how some leaders peddle serfdom as being justifiable by some supposed economic benefit(which in itself is debatable). Astonishing that this is even a close vote… 🙁
I received this email that asks to forward on… Since the BREXIT Vote is upon us and the Election here in the USA in November… Citizens should wise up on how they are actually being manipulated…
Lara, if you want to pull this down… I fully understand… For those who have read any of Saul Alinsky’s work you would appreciate this (you can substitute for what your own country calls these items):
Almost Completed
Based on Saul Alinsky’s
8-steps from democracy to a socialist society.
Obama quoted him often in his book and
Hillary did her thesis on Alinsky.
Of the 8-levels of control that must be obtained before you are able to create a socialist/communist
State, the first is the most important; 5 OF 8 ARE DONE, AND THE LAST 3 ARE ALMOST THERE!
1. Healthcare: “Control
Healthcare and you control the People”
DONE!
2. Poverty: Increase the Poverty level as high as possible.” Poor People are easier to control and will not fight
back if the government is providing everything for them to live.
DONE!
3. Debt: Increase the National Debt to an
unsustainable level.” That way you are able to increase Taxes, and this will produce more Poverty.
DONE!
4. Gun Control: Remove the ability to defend themselves from the Government. That way you are able to create a
Police State – total local control.
ALMOST THERE, AND WORKING HARD ON IT!
5. Welfare: Take control of every aspect of their lives (Food,
Livestock, Housing, and Income).
DONE!
6. Education: Take control of what People read & listen to; take control of what Children learn in School.
ALMOST THERE!
7. Religion:Remove
faith in God from the Government and Schools.ALMOST THERE!
8. Class Warfare: Divide the People into the Wealthy against the Poor. Racially divide. This will cause more discontent
and it will be easier to Tax the Wealthy with full support of the voting Poor.
DONE!
For the most part the bases are all covered! We are ripe!
I’ll leave it up Joe, but I will point out that it is an extremely US focussed viewpoint. I’m pointing that out because this membership is global, although about 25% of members are in the USA.
There are plenty of examples of what I would define as socialist countries which have happy well off (mostly) citizens, such as those in Scandinavia. Socialism and communism are not the same thing.
NZ has a strong socialist history, and a large portion of us in NZ are still okay with that.
Feedback: socialism is the collective ownership by all the people of the factories, mills, mines, railroads, land and all other instruments of production. Whereby the Govt. directly runs things too. The Scandinavian countries are more ‘welfare countries’. But interestingly they really built their wealth back when they were more capitalistic. Then, as to each individual country the question is to what degree is the Govt. involved? Haven’t studied NZ so don’t know, your the resident expert on that.
Socialism isn’t necessarily the ownership of the means of production, it can also be the regulation of the market
“a political and economic theory of social organisation which advocates that the means of production, distribution and exchange should be owned or regulated by the community as a whole”
With that definition NZ was highly socialist up to 1984. Thereafter much of what was built and owned by the state has been sold, starting with the old NZ Post (now Telecom), through to banks, railroads (which government had to buy back after the private owners mismanaged it) and currently state housing.
Since 1984 NZ has elected relatively right wing neo liberal governments who advocate a laissez faire approach, expecting the market will take care of the population and economy if left to itself. Our trade barriers and subsidies for local industry were removed quickly after 1984. Selling state owned assets has taken longer.
NZ was a relatively egalitarian society prior to 1984, and since then inequality has widened, and unemployment is relatively high and persistent (high compared to historic levels for NZ). We have serious problems with environmental degradation and risk losing our “clean green” image, which IMO we don’t deserve at all.
Of all the changes I’ve seen in NZ in my life time I tend to get most upset about the disrespect and degradation for our beautiful environment. I think the people get the government they deserve, but the environment doesn’t get to vote 🙁
I’ll add that I’ve noticed my definition of socialism is not shared by many in the USA. Their definition of socialism is what I would define as communism.
I can find dictionary sources (such as the one I quoted) which define socialism as government regulation of production, distribution and exchange, not necessarily ownership. I was under the impression that government ownership of the means of production was communism, not socialism? If not, then what would you say the difference is? I’m genuinely interested in your answer as an economist. Maybe I’m getting it entirely wrong.
In NZ prior to 1984 the government did own large portions of infrastructure, some of which was profitable business (the old Post Office was the telecommunications company as well as postal service). It was heavily involved in the economy. Not so much today.
Absolutely spot on Olga I’m based in the UK and share your frustrations. To much short term selfish thinking, I want a better UK for the sake of my children and the younger generation in general, even though it would probably hit me financially in the short term. I’m afraid the tragic shooting of the pro remain MP has meant it’s now an odds on certainty we will remain.
The point from which that triangle thrust initiated completely reversed. We now need a break of the mini support shelf from 2082.50 to 2083.50 for the decline to get going…
Back to the short term trend line. Looks like a grind higher for now.
Again, this does not look like a three down. I wonder if we’ll ever ever get a three down?
The vast majority are still believing the Fed CON JOB!
That is why three down has yet to show itself.
When people stop being lazy and actually do the analysis on their own… they will quickly see that the USA and the World is a House of Cards! The truth will come to light! It always does.
As long as we are making money I don’t see that it matters. Lara has gone over the previous bear market in fine detail – you may wish to refer back to that.
Lara’s wave counts also make it clear that we could still be in Minor 2.
Never wise to pre-judge price action. Let’s just see what the market does and then decide… 🙂
Amen 🙂
I’m fresh out of crystal balls so probability and price is the best I’ve got atm.
The market is distorted and being manipulated! All is not what it seems.
But that will all change at some point. Then price will go back to its proper valuation and well below proper valuation. It has over shot up… it will over shoot down. History tells us that… Those that fail to know & understand history are doomed.
It will not be different “this time”.
If UVXY and NASDAQ are any indication, we’ll be having a move south shortly. But I still don’t think it will be a polarizing 3rd wave. You have to remember we’re still in intermediate 1… which means that intermediate 2, whenever it shows up, will most likely bring us back close to the SPX 2100 level also…
The market is not being aggressively sold and despite the obvious cash dumps is drifting lower under its own weight. The round number pivot continues to act as a magnet and we really should be soon falling away from it to confirm the bearish count. The next ham-handed move by the FED will in all likelihood be announcement of another round of QE at the end of intermediate one down…
Looking for IWM to be the first to fill the open gap from last Friday for a clue as to when SPX will follow suit…
The real aggressive… mass dump selling will only take place with a break of and clear move away from 1810 to the down side. That is when all hell will break loose.
Between here & there it will be selling on gradually increasing volume in the range of .75 to 1.25% a day over a couple of weeks.
I say break below 1810 because nobody believes this is a sustained Bear Market. The vast majority believes the Fed CON JOB! There is Gross Complacency! Only accelerating away from the underside of 1810 will begin to change that mindset.
We could also get the 30% decline in one day which will accomplish that all at once.
FLATLINED Market! Not even Yellen’s BS CON JOB moving it one bit. FLATLINED!
Gross Complacency!
Futures suggesting alternate will be invalidated in the a.m.
I am expecting a typical notable announcement of its arrival by the next wave down taking out the open gap from last Friday’s close at 2071.22, at which time remaining dry powder will ignited…
How is it the futures are suggesting the alternate hourly bear count will be invalidated?
Took out 2079.62…
UVXY certainly not buying this ramp atm.
Really want to see 2079 taken out today – will lighten my short as we get closer and re-enter just under it.
Draghi just announced further stimulus is in the pipeline.
The sycophants on the German court just gave him virtually unlimited bond buying authority. He may single handedly ignite a movement in Germany to leave the E.U. That would be interesting; would that be a Gexit?
Or a Gerexit?
Or a Wurstexit
O.K. I am biting on the Brexit bait- bought the July EUFN 18.00 strike straddle @ 1.50 per contract. What is interesting is the option price does not reflect the one-sided bullish bets supposedly made recently – the puts are twice as expensive as the calls! I thouhgt if anything, optimism for a remain was supposed to have risen the last few day…Hmmnnnn…! 🙂
From Goldman Sachs today: “In the first quarter, the U.S. stock market recorded net sales of $7 billion with foreign investors dumping $27 billion worth and mutual funds unloading $4 billion. Corporations remained the single biggest source of support for the equity market with buybacks totaling $173 billion. Exchange-traded funds, meanwhile, bought $3 billion, which comes out to $12 billion on an annualized basis, significantly below $175 billion in purchases for 2015. Pension funds will also be net sellers to the tune of $150 billion in 2016 after unloading $62 billion in shares in the first quarter, he said.” Most interesting to me is the collapse of money into ETF’s.
An interesting metric often cited by demographics expert Harry Dent is the approximately 10K baby boomers retiring every day. Not only will those regular contributions to retirement accounts end, there will likely begin withdrawals from those invested accounts; a pattern continuing into the foreseeable future.
Price has gone up a bit after hours. I’ve added to my short position, entry 2,091.40, stop set just above the invalidation point on the alternate hourly at 2,120.55. Target for now 1,423 but again that will probably change.
Jim, do you mind sharing the tos study that generated the histogram…thats super helpful
Done
Hi Lara,
I was wondering whether it is bothersome that an impulse wave that took allmost 2 weeks to fall possibly completed correcting in a day and a half ?
No, not really. Zigzags can be quick.
In the last P3 bear market minor 1 lasted 7 days, minor 2 lasted 8 days.
But that was followed with minute i lasting 3 days and minute ii lasting just one day.
So it is entirely possible. Especially as it’s over the 0.618 Fibonacci ratio.
I used to be a teeny bit concerned for the bearish case with the protracted nature of the corrections until Lara pointed out the fact that we saw similar price action during the last bear market. One thing that I would expect as the pull of a P3 down takes hold would be for corrections to start becoming briefer…
European markets held the bankster pump yesterday better than the US markets did. Despite being up over 3% overninght FTSE is in the red and CAC and DAX are barely positive. US futures still slightly positive but if yesterday was any indication, that too will probably change.
Today I learned that “2” counts as a fibonacci number.
As is 0 and 1.
The Fibonacci sequence is seeded with 0 and 1.
it is
0, 1, 1, 2, 3, 5, 8, 13, 21, 34, 55, 89… etc.
Fibonacci ratios are the ratios converged upon when one number in the sequence is divided by another an equal distance away in the sequence.
So 0.5 is not a Fibonacci ratio. Even though you can get 0.5 by dividing 2 by 1, that is not the ratio that is converged upon from the Fibonacci sequence.
0.786 isn’t a Fibonacci ratio either. It’s the square root of the Fibonacci ratio 0.618.
Yet 0.5 and 0.786 are called Fibonacci ratios by traders and used as such on trading platforms. But they’re not. I do find that annoying.
Market makers are expecting a move down this week. SPY 208 puts as of close today had an intrinsic value of only 0.15 points. Traders are willing to pay (bid) 2.00 points for SPY 208 puts expiring this week giving those contracts an premium of 1.85, very rich indeed. Traders expect SPY to be below 206 at week’s end. It is getting expensive to get positioned on the short side if you are trading options…
Just FYI for members looking to short the market:
A good alternative to short the market for me has been the SQQQ. I loaded up on September call options today near the market highs (already in the green 🙂 ). For a 3x bear ETF it holds its price well without much erosion…
Some modeling that I follow that uses AI neural networks to predict the market for a long time showed QQQ tanking more aggressively than SPY. Now interestingly it shows the DOW tanking the fastest, then QQQ then SPY. I wonder what economic or market circumstance would cause the DOW to drop more than the others?
Generally a good sign you you timed a trade perfectly! I am just at about break-even on my UVXY spread having closed the short side yesterday for a very nice profit and long the beast compliments of Mr. Market. 🙂
DJIA did not confirm the new recovery high of SPX on June 8; this inter-market non-confirmation may be showing signs of greater DOW vulnerability….
Also, here is a distribution of the SPY June quarterly options (6/30). Looks like the Put strikes that are the most popular are 200 at 205. Put outweigh Calls 616K vs 399K contracts.
Jim….do you mind sharing with me your study on tos? you can email me at jules_bassale@yahoo.com
Thank you
Will do.
Interesting. Usually the one with the most contracts looses….guessing that will be the shorts short term.
Hey Verne,
SPY did a nice little poke above the upper bollinger band today at the 4H and with /ES it was more prominent with the wick nicely placed 🙂
I did not notice that precise wick placement until Lara pointed in out. The upper BB penetration is probative! I missed it…
Hi!
Hey Verne!
Howdy!
First!!