
A correction was expected to continue during Friday’s session. A small range day with a higher low fits the expectation overall.
Summary: Upwards movement is most likely to continue early next week for another two sessions to a target at 2,092 – 2,094 or alternatively (less likely) to 2,099 – 2,102. It is possible still that a big surprise to the downside may begin on Monday. This would increase in probability below 2,050.37.
Trading advice (not intended for more experienced members): Short positions entered above 2,100 should at least have stops moved to break even if not a little below. Position traders holding short positions opened reasonably above 2,100 may like to hold onto those; 2,100 should offer strong resistance now for any bounce.
Looking at the bigger picture, any short positions entered here should be profitable next week and may still offer a very good risk / reward set up. However, any members entering short here must understand there is a risk the position may be underwater for several days before becoming profitable. With that in mind, it is essential to manage risk: no more than 2-3% of equity should be risked if entering short here.
Choosing to be patient and wait may offer a better entry but runs the risk of missing a strong downwards movement. On balance, it is still my judgement that price will continue up for a reaction to test the trend line, so I will still not be adding to my short position until the trend line is again touched. If I did not yet have a short position, I may choose to enter a small position here and wait to enter another slightly larger position higher up.
Stops (and risk) for new positions must be just above 2,120.55.
Last published monthly charts are here.
New updates to this analysis are in bold.
BEAR ELLIOTT WAVE COUNT
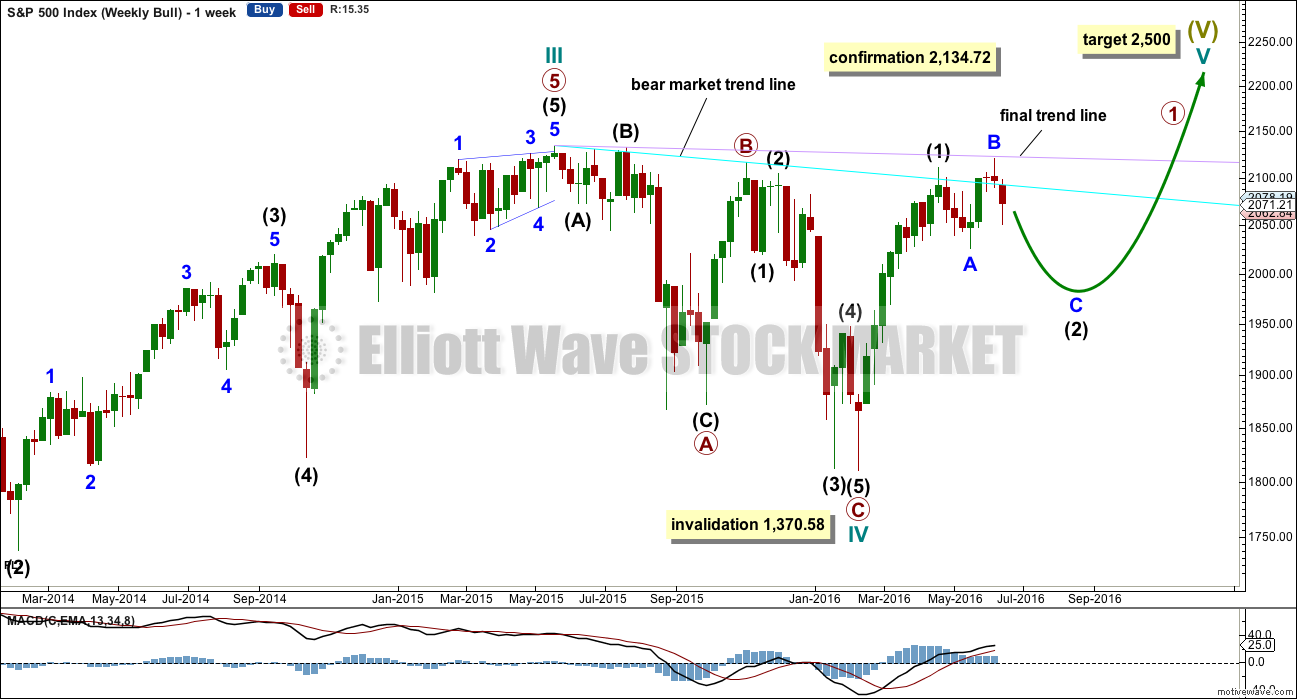
WEEKLY CHART
Click chart to enlarge.
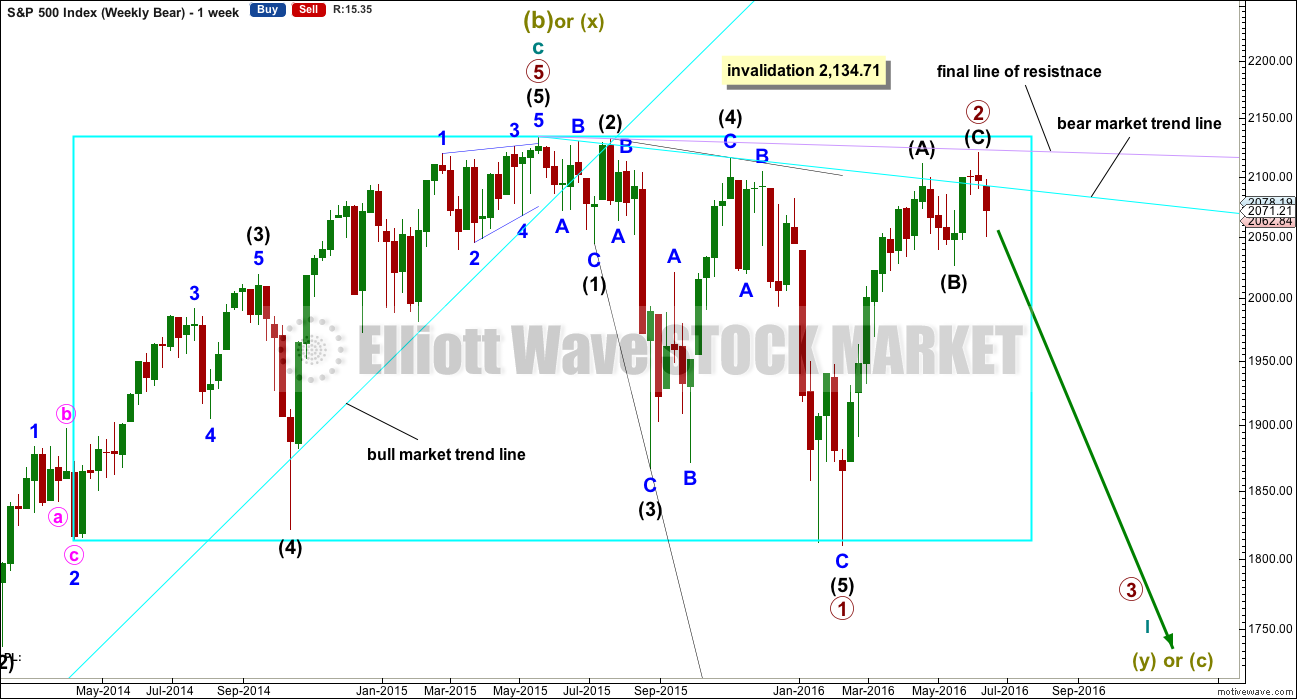
The box is added to the weekly chart. Price has been range bound for months. A breakout will eventually happen. The S&P often forms slow rounding tops, and this looks like what is happening here at a monthly / weekly time frame.
Primary wave 1 is seen as complete as a leading expanding diagonal. Primary wave 2 would be expected to be complete here or very soon indeed.
Leading diagonals are not rare, but they are not very common either. Leading diagonals are more often contracting than expanding. This wave count does not rely on a rare structure, but leading expanding diagonals are not common structures either.
Leading diagonals require sub waves 2 and 4 to be zigzags. Sub waves 1, 3 and 5 are most commonly zigzags but sometimes may appear to be impulses. In this case all subdivisions fit perfectly as zigzags and look like threes on the weekly and daily charts. There are no truncations and no rare structures in this wave count.
The fourth wave must overlap first wave price territory within a diagonal. It may not move beyond the end of the second wave.
Leading diagonals in first wave positions are often followed by very deep second wave corrections. Primary wave 2 would be the most common structure for a second wave, a zigzag, and fits the description of very deep. It may not move beyond the start of primary wave 1 above 2,134.72.
So far it looks like price is finding resistance at the lilac trend line. Price has not managed to break above it.
DAILY CHART
Click chart to enlarge.
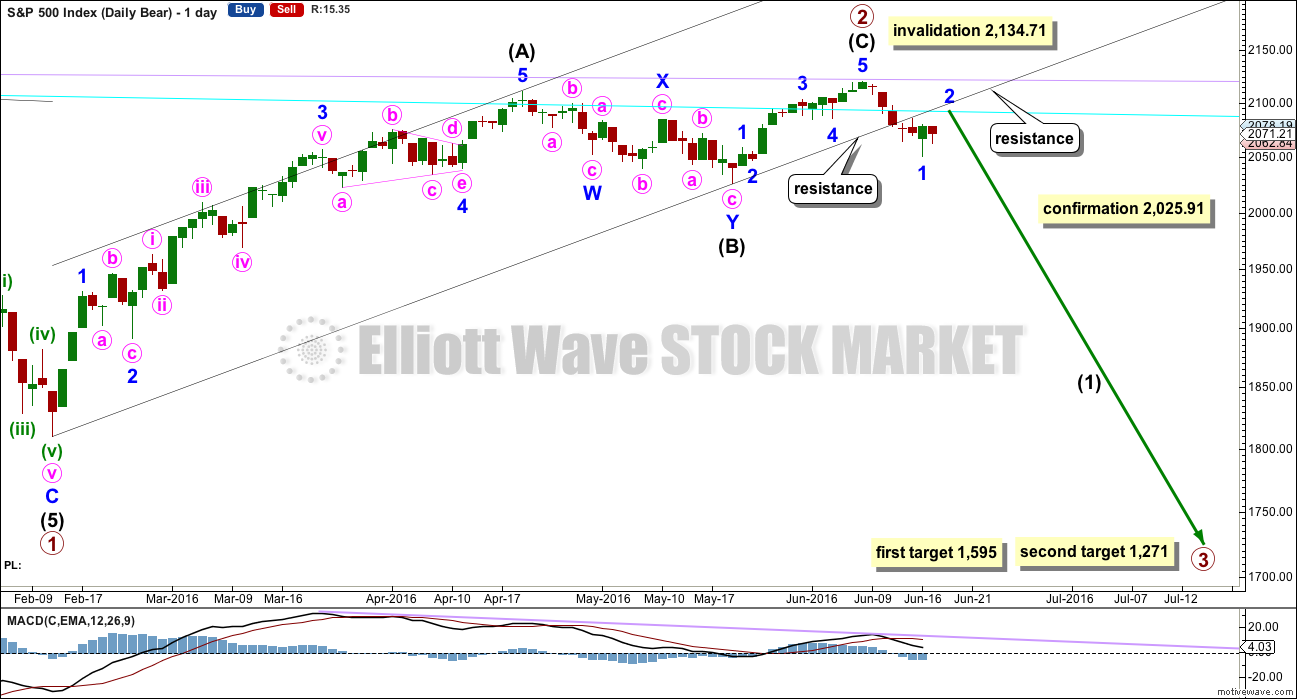
Primary wave 2 would be a 0.96 correction of primary wave 1. Second wave corrections following first wave leading diagonals are commonly very deep, so this fits the most common pattern if primary wave 1 was a leading diagonal.
The most common structure for a second wave correction is a zigzag.
There is no Fibonacci ratio between intermediate waves (A) and (C).
Draw a channel about primary wave 2 using Elliott’s technique for a correction: draw the first trend line from the start of the zigzag, then a parallel copy on the end of intermediate wave (A).
Intermediate wave (C) is a complete impulse and primary wave 2 is a complete zigzag. With a two full daily candlesticks below the wide black channel and not touching the lower edge, there is some confidence that primary wave 2 is over.
At this stage, it looks like minor wave 1 may have more likely ended at the low for this week and minor wave 2 may have begun there. Minor wave 2 would be very likely to come up to test resistance at the lower edge of the black channel; that would be very typical behaviour, so it should be expected. A throw back would offer a good low risk entry opportunity to join the downwards trend.
So far minor wave 2 may have lasted one day. It may be expected to continue for another two to four days to total a Fibonacci three or five.
Intermediate wave (C) lasted a Fibonacci thirteen days. Intermediate wave (B) lasted a Fibonacci twenty-one days and intermediate wave (A) lasted forty seven days (not a Fibonacci number). Primary wave 2 would have lasted eighty one days (also not a Fibonacci number). If primary wave 3 exhibits a Fibonacci duration, then a reasonable estimate would be a Fibonacci 144 days.
A new low below 2,025.91 would provide final price confirmation of a trend change. At that stage, downwards movement could not be a second wave correction within intermediate wave (C) and so intermediate wave (C) would have to be over.
The targets calculated are provisional only. They come with the caveat that price may yet move higher which means the targets would move correspondingly higher. They also come with the caveat that at this very early stage a target for primary wave 3 may only be calculated at primary degree. When intermediate waves (1) through to (4) within primary wave 3 are complete, then the targets may change as they can be calculated at more than one wave degree. Primary wave 3 may not exhibit a Fibonacci ratio to primary wave 1.
The first target at 1,595 is where primary wave 3 would reach 1.618 the length of primary wave 1. This target would most likely not be low enough because primary wave 2 is very deep at 0.96 the length of primary wave 1. Primary wave 3 must move below the end of primary wave 1, and it must move far enough below to allow subsequent room for primary wave 4 to unfold and remain below primary wave 1 price territory. Normally, there is a gap between first wave and fourth wave price territory, particularly in a bear market.
The next target may be more likely. At 1,271 primary wave 3 would reach 2.618 the length of primary wave 1.
If primary wave 3 does not exhibit a Fibonacci ratio to primary wave 1, then neither of these targets would be correct.
Well before these targets, it should be obvious if the next wave down is a primary degree third wave. It should exhibit increasing ATR, strong momentum, and a steep slope. However, please note that although it may begin very strongly it does not have to. It may also be that intermediate wave (1) maintains an ATR about 20 – 30 and has some deep time consuming corrections within it. That was how the last primary degree third wave began within the last bear market, so it may happen again.
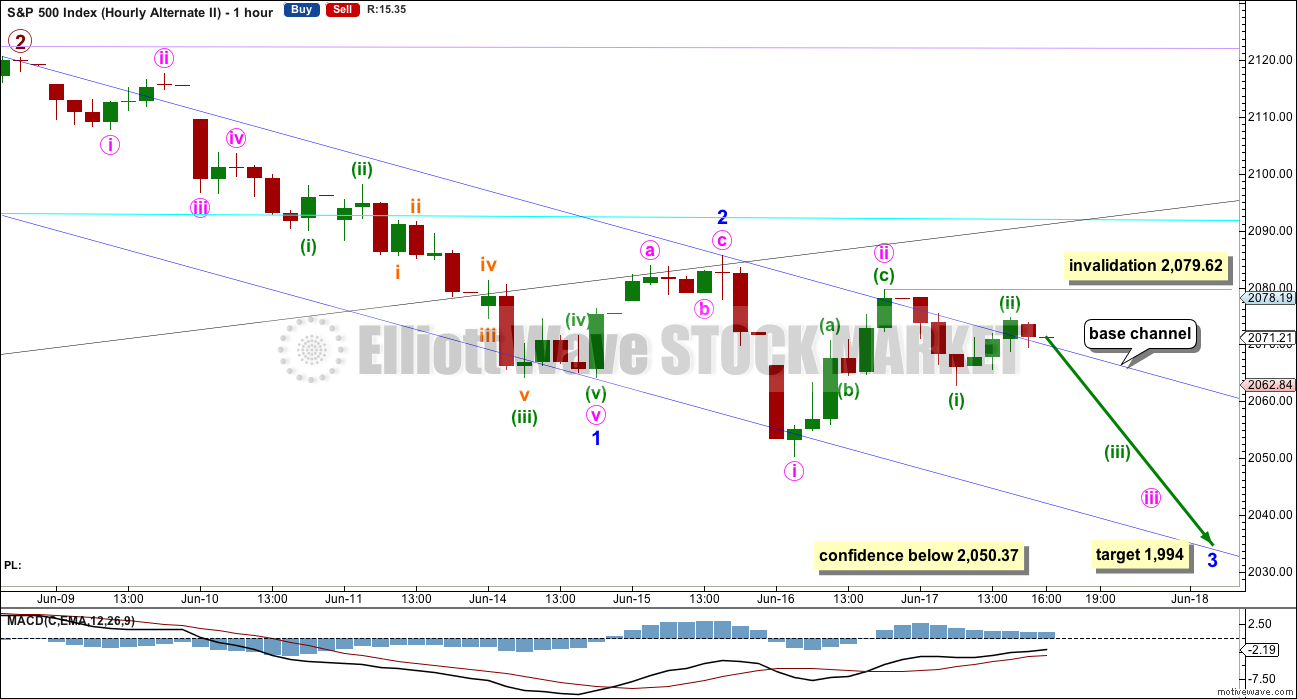
MAIN HOURLY CHART
Click chart to enlarge.
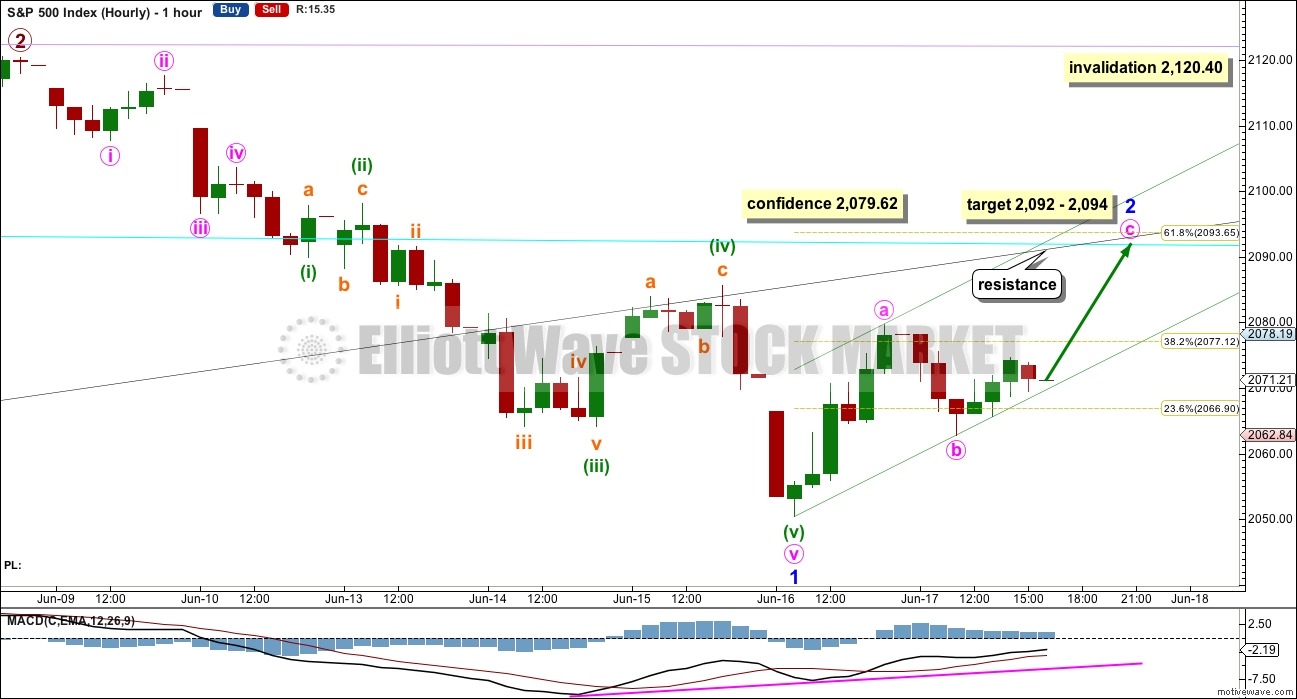
Ratios within minor wave 1 are: minute wave iii is just 0.24 points longer than 1.618 the length of minute wave i, and minute wave v is 1.69 points short of 2.618 the length of minute wave iii.
Ratios within minute wave v are: minuette wave (iii) is 1.72 points short of 2.618 the length of minuette wave (i), and minuette wave (v) is 1.26 points longer than equality in length with minuette wave (iii).
With excellent Fibonacci ratios, this labelling has a good probability. The only problem is the proportion of minuette wave (iv) to minuette wave (ii), but the S&P does not always exhibit good proportions.
Minor wave 2 may be any corrective structure except a triangle. At this stage, it looks like it may be unfolding as a zigzag with minute wave a upwards within it subdividing as either a five wave impulse or a three wave double zigzag on the five minute chart. It is impossible to tell with certainty which structure this is, so both possibilities, a three or a five, must be considered.
For this reason, unfortunately, there is no lower invalidation point for minor wave 2 for next week.
If minor wave 2 is a zigzag (most likely), then within it minute waves a and b may be complete. At 2,092 minute wave c would reach equality in length with minute wave a. This is very close to the 0.618 Fibonacci ratio at 2,094 giving a two point target zone with a good probability. If minute wave b moves lower (and it may), then the lower edge of this target zone no longer applies.
If minor wave 2 is a zigzag, then within it minute wave b may not make a new low below the start of minute wave a at 2,050.37.
If minor wave 2 is a flat correction, then within it minute wave b would be incomplete. Minute wave b would have to retrace a minimum 0.9 length of minute wave a at 2,053.30. The normal range for minute wave b within a flat would be 1 to 1.38 the length of minute wave a at 2,050.37 to 2,039.26. The maximum limit for minute wave b (not a rule but a convention, the difference is important) would be 2,021.12. This hourly wave count would be discarded below this point; minor wave 2 would be over.
Draw a trend channel about the start of minor wave 2. If this labelling is correct, then along the way up to the target corrections within minute wave c should find support at the lower edge of this small green channel. A breach of the lower edge of the channel would indicate minute wave b is not over and is continuing sideways and / or lower. If that happens, then minor wave 2 may be longer lasting and more complicated than this chart suggests.
If price comes up to touch the lower edge of the black channel next week, then short positions should be entered there with stops just above 2,120.40.
Minor wave 2 may not move beyond the start of minor wave 1 above 2,120.40.
A new high above 2,079.62 now would invalidate the second alternate below and provide some confidence for this main hourly wave count and the first alternate hourly wave count.
FIRST ALTERNATE HOURLY CHART
Click chart to enlarge.
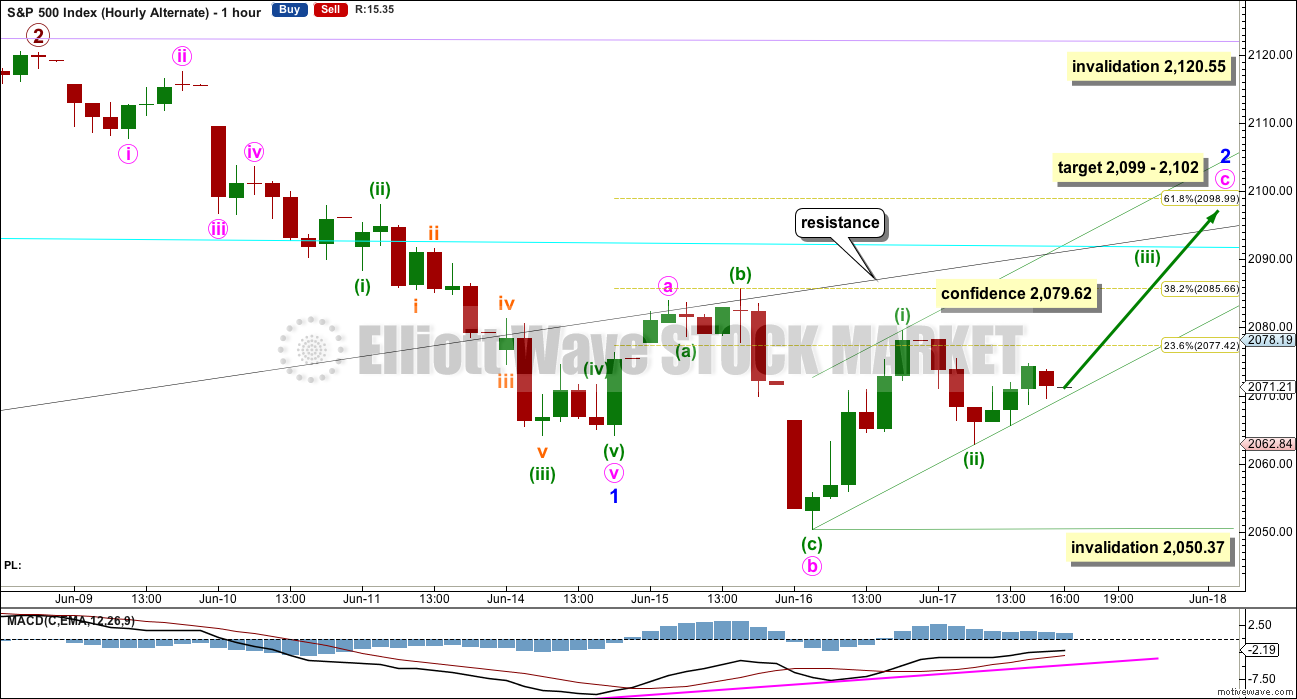
Minor wave 2 may be unfolding as an expanded flat correction. Divergence between price and MACD at the hourly chart level supports this wave count, but it is not supported at lower time frames.
Minor wave 2 may also be unfolding as a combination but at this stage that structure looks less likely, so for clarity’s sake it will not be charted.
Ratios within minor wave 1 are: minute wave iii is just 0.24 points longer than 1.618 the length of minute wave i, and minute wave v has no Fibonacci ratio to either of minute waves i or iii.
Ratios within minute wave v are: there is no Fibonacci ratio between minuette waves (i) and (iii), and minuette wave (v) is just 0.06 short of 0.382 the length of minuette wave (i) (ratios here calculated on the five minute chart).
With reasonable Fibonacci ratios for this labelling, it has a reasonable probability.
Within minor wave 2, minute wave b would be a 1.69 length of minute wave a. This is longer than the common length but within allowable limits.
At 2,102 minute wave c would reach 2.618 the length of minute wave a. This is close to the 0.618 Fibonacci ratio of minor wave 1 at 2,099 giving a 3 point target zone.
If it lasts long enough, this target may be met when price comes up again to touch the lower edge of the black channel.
A new high above 2,079.62 would invalidate the second alternate below and provide some price confirmation of this wave count.
Within minute wave c, no second wave correction may move beyond the start of its first wave below 2,050.37.
SECOND ALTERNATE HOURLY CHART
Click chart to enlarge.
Look out for a possible surprise to the downside early next week. This wave count must be understood to be possible, although it is my judgement that it has a lower probability.
Low probability does not mean no probability; sometimes low probability outcomes occur. When they do, they are never what was expected as most likely.
If minor wave 2 was over already, then it would be a very quick shallow correction, but it did retest the lower edge of the black channel. It would have corrected to 0.383 of minor wave 1, just above the 0.382 Fibonacci ratio. It would have subdivided as a single zigzag which is the most common structure for a second wave.
The reason why I judge this wave count to have the lowest probability is the brevity of minor wave 2. It would have lasted just one session to the four sessions of minor wave 1; it would barely show on the daily chart.
The implications of this alternate are important. It is possible that there may now be a series of three overlapping first and second waves. If price makes a new low below 2,050.37 on Monday with a strong increase in downwards momentum (preferably at the hourly chart level), then this wave count would increase in probability. If price breaks below the lower edge of the dark blue base channel, then this wave count would be preferred. At that stage, the middle of a third wave would be expected to be underway.
At 1,994 minor wave 3 would reach 1.618 the length of minor wave 1.
Minuette wave (ii) may not move beyond the start of minuette wave (i) above 2,079.62.
BULL ELLIOTT WAVE COUNT
WEEKLY CHART
Click chart to enlarge.
Cycle wave IV is seen as a complete flat correction. Within cycle wave IV, primary wave C is still seen as a five wave impulse.
Intermediate wave (3) has a strong three wave look to it on the weekly and daily charts. For the S&P, a large wave like this one at intermediate degree should look like an impulse at higher time frames. The three wave look substantially reduces the probability of this wave count. Subdivisions have been checked on the hourly chart, which will fit.
Cycle wave II was a shallow 0.41 zigzag lasting three months. Cycle wave IV may be a complete shallow 0.19 regular flat correction, exhibiting some alternation with cycle wave II and lasting nine months. Cycle wave IV would be grossly disproportionate to cycle wave II, and would have to move substantially out of a trend channel on the monthly chart, for it to continue further sideways as a double flat, triangle or combination. For this reason, although it is possible, it looks less likely that cycle wave IV would continue further. It should be over at the low as labelled.
At 2,500 cycle wave V would reach equality in length with cycle wave I.
Price has now broken a little above the bear market trend line. This line is drawn from the all time high at 2,134.72 to the swing high labelled primary wave B at 2,116.48 on November 2015. This line is drawn using the approach outlined by Magee in the classic “Technical Analysis of Stock Trends”. To use it correctly we should assume that a bear market remains intact until this line is breached by a close of 3% or more of market value. Now that the line is breached, the price point at which it is breached is calculated about 2,093.58. 3% of market value above this line would be 2,156.38, which would be above the all time high and the confirmation point.
This wave count requires price confirmation with a new all time high above 2,134.72.
While price has not made a new high, while it remains below the final trend line (lilac) and while technical indicators point to weakness in upwards movement, this very bullish wave count comes with a strong caveat. I still do not have confidence in it. It is produced as an alternate, because all possibilities must be considered. Price managed to keep making new highs for years on light and declining volume, so it is possible that this pattern may continue to new all time highs for cycle wave V.
The invalidation point will remain on the weekly chart at 1,370.58. Cycle wave IV may not move into cycle wave I price territory.
This invalidation point allows for the possibility that cycle wave IV may not be complete and may continue sideways for another one to two years as a double flat or double combination. Because both double flats and double combinations are both sideways movements, a new low substantially below the end of primary wave C at 1,810.10 should see this wave count discarded on the basis of a very low probability long before price makes a new low below 1,370.58.
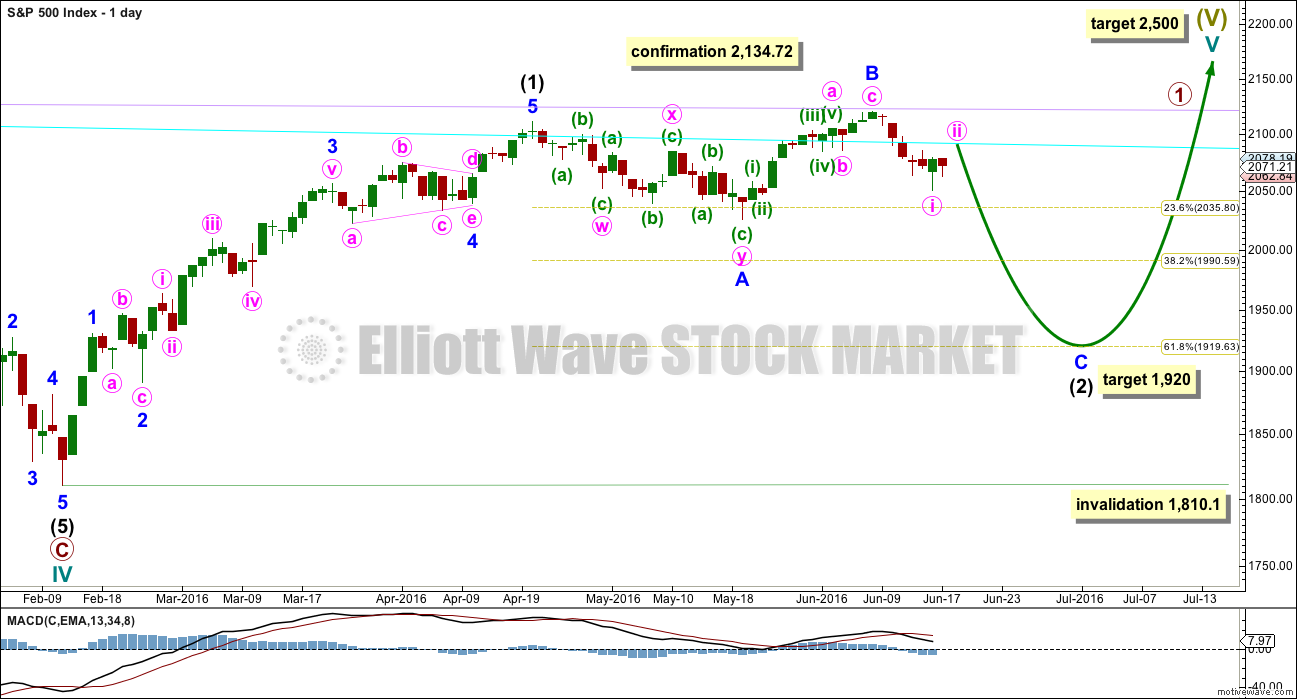
DAILY CHART
Click chart to enlarge.
Intermediate wave (2) may still be an incomplete flat correction. Minor wave A will subdivide as a three, a double zigzag, and minor wave B may be seen as a single zigzag.
The most likely point for intermediate wave (2) to end would be the 0.618 Fibonacci ratio at 1,920.
Intermediate wave (2) may not move beyond the start of intermediate wave (1) below 1,810.10.
While it is possible that intermediate wave (2) may be a complete double zigzag at the low labelled minor wave A, this would be a very shallow and rather quick second wave correction. The first reasonable second wave correction within a new bull market should be expected to be deeper and more time consuming for this bull wave count, so intermediate wave (2) is expected to continue.
TECHNICAL ANALYSIS
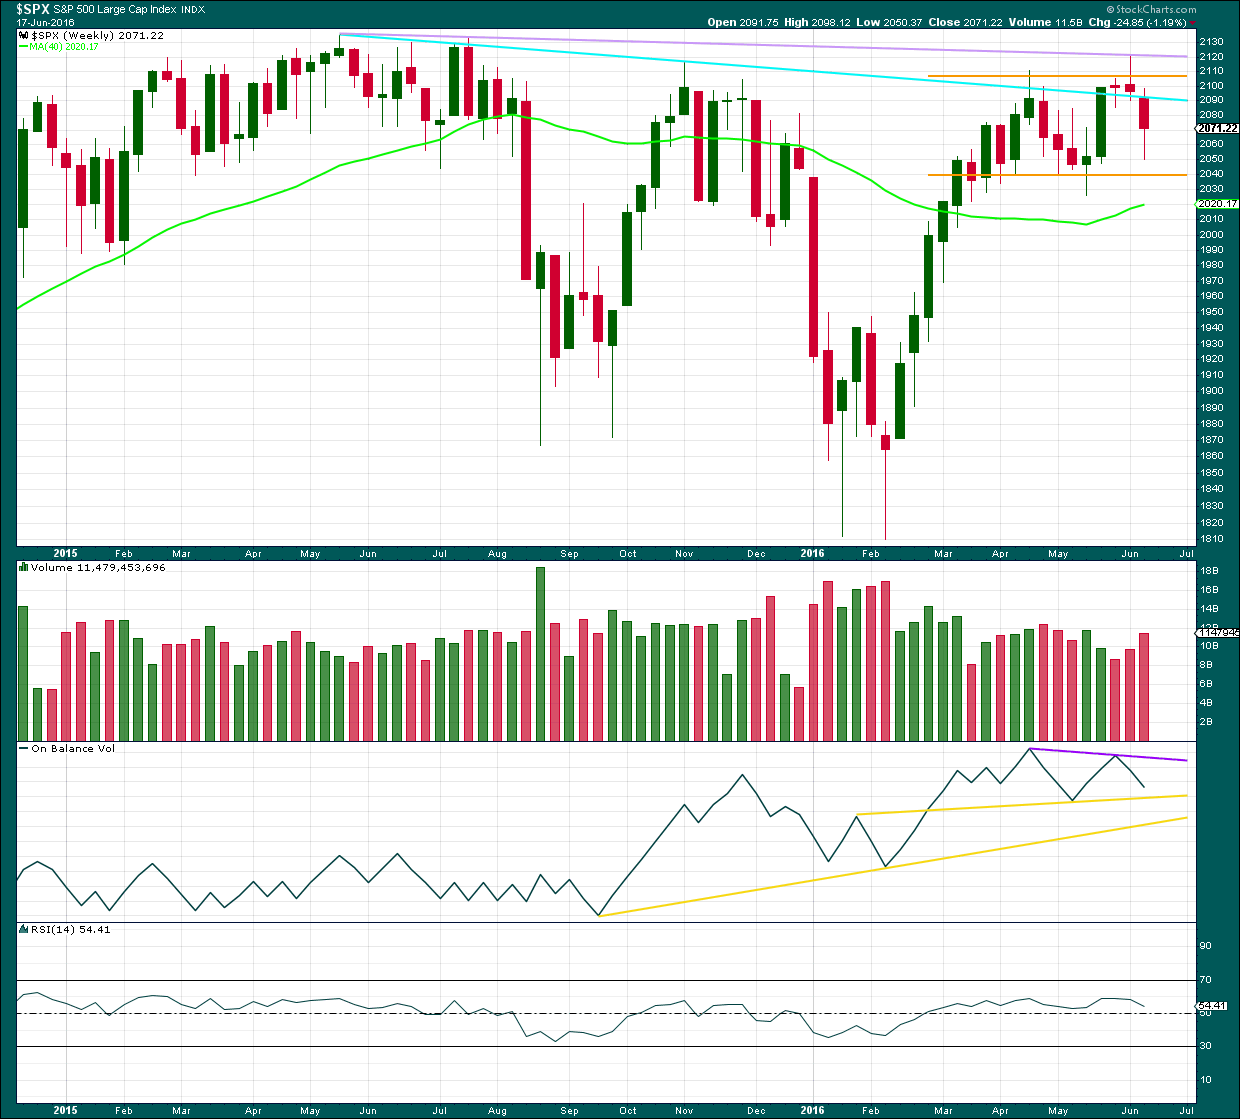
WEEKLY CHART
Click chart to enlarge. Chart courtesy of StockCharts.com.
The reversal implication of the shooting star candlestick pattern for last week is now confirmed by a strong red weekly candlestick which gapped down. This week’s candlestick pattern may be considered to have completed an Evening Doji Star pattern, albeit with two doji at the high.
Along the way down, price may find some support about 2,040.
Upwards movement made an important new high last week but could not manage to break above the final lilac line of resistance. That line remains intact and is now strengthened.
Volume has increased for a downwards week, but as this includes an options expiry date it should not be considered as definitive. Volume for the two downwards weeks prior also showed some increase, although volume was light. It looks like so far the market may be falling of its own weight; selling pressure is light. If selling pressure increases, then look out for a strong increase in downwards momentum.
On Balance Volume trend lines are redrawn this week: support in yellow and resistance in purple. OBV would allow for a little further downwards movement before it finds support at the first yellow line. This may indicate where a bounce may turn up.
DAILY CHART
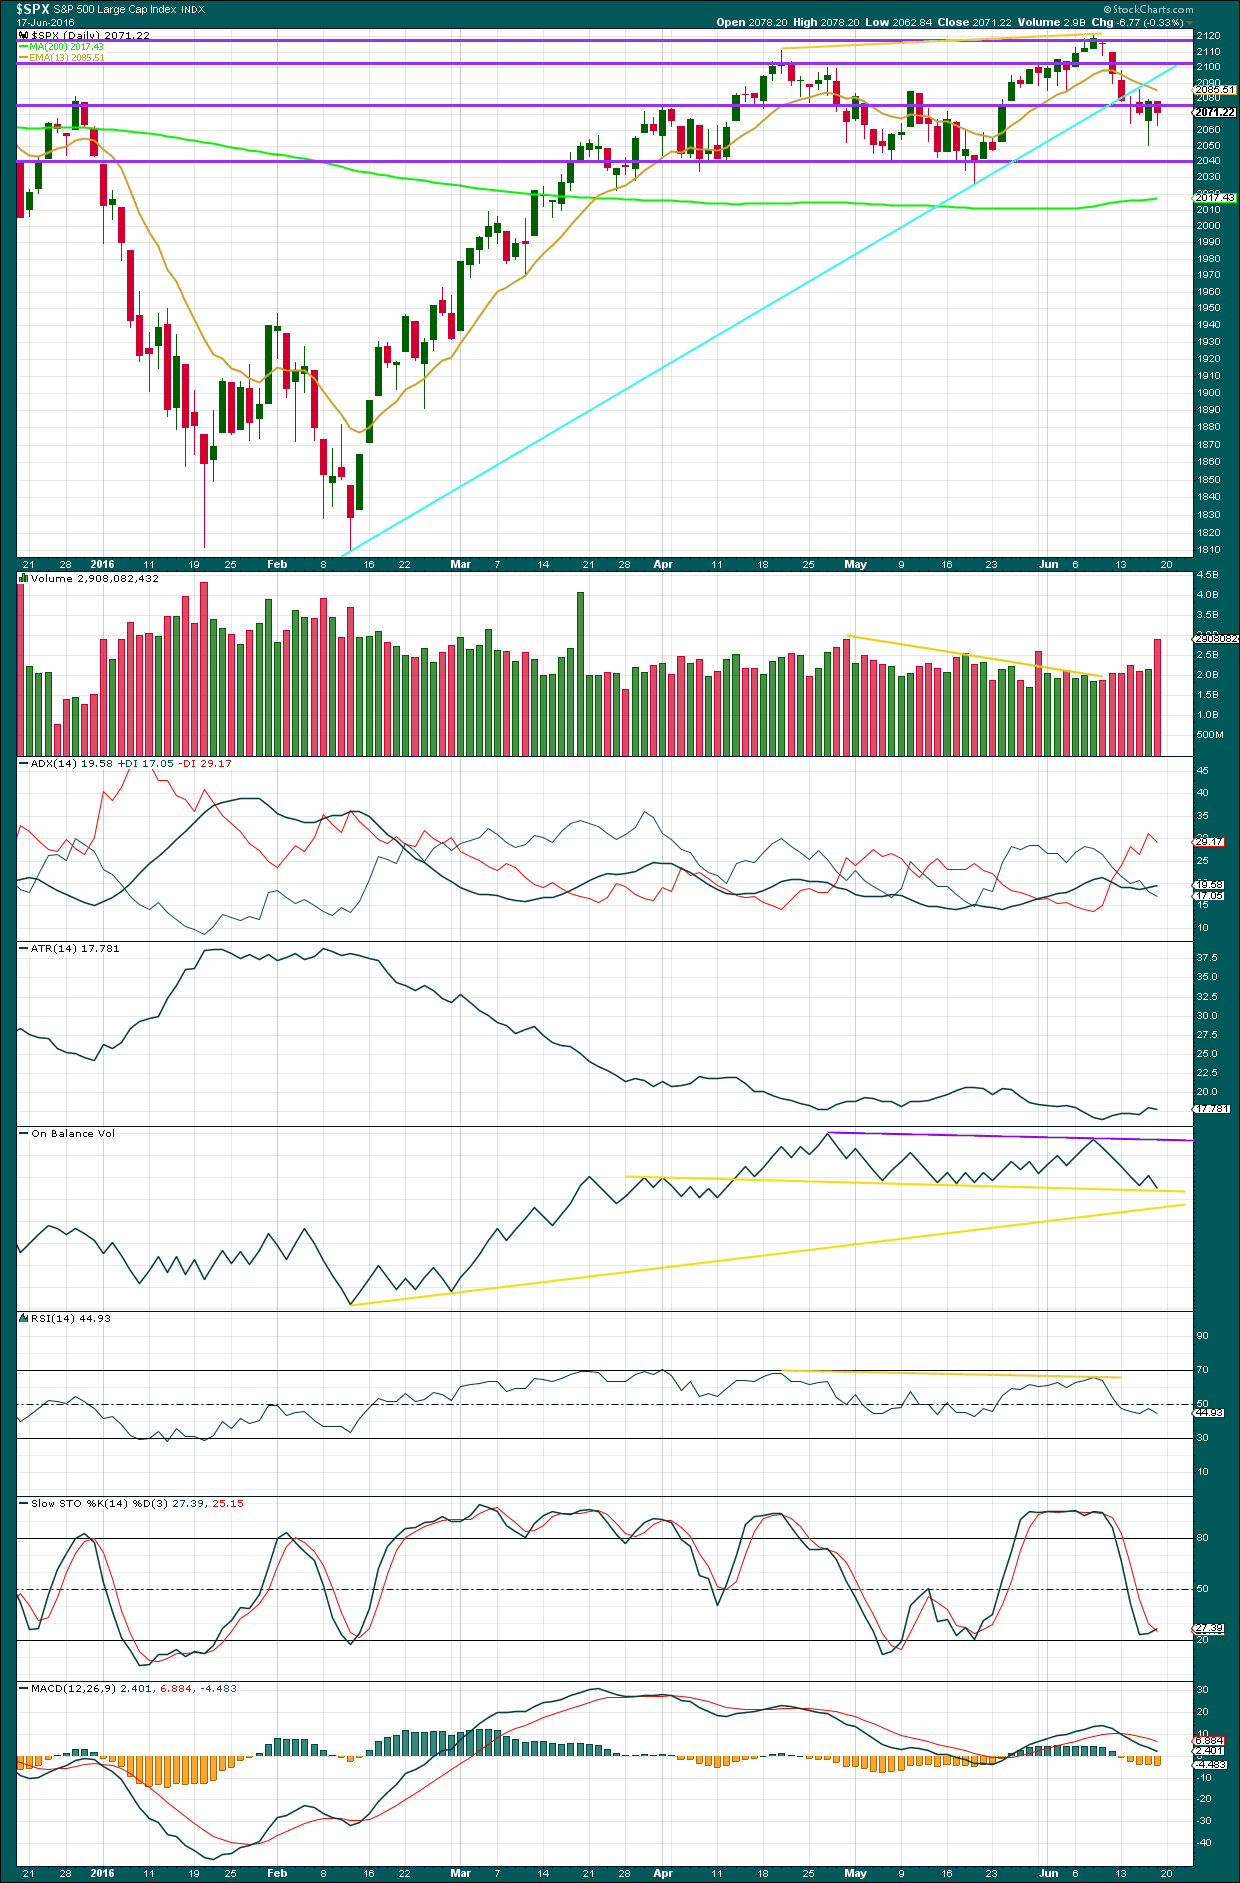
Click chart to enlarge. Chart courtesy of StockCharts.com.
Volume data on StockCharts is different to that given from NYSE, the home of this index. Comments on volume will be based on NYSE volume data when it differs from StockCharts.
Overall, volume increased (ignore volume for the options expiry date of Friday) as price fell for the week. The one green daily candlestick during the week came with relatively light volume. Overall, the fall in price has some slight support from volume, but the market appears to be falling mostly of its own weight.
At the low for this week is a bullish engulfing candlestick pattern: although volume for that session was relatively light, it was slightly stronger than the prior downwards session. This indicates a bounce from this point and supports the first two hourly Elliott wave counts over the third. Friday’s session did not move above the bullish candlestick for Thursday, so some more upwards movement would be a reasonable expectation to follow this reversal signal.
ADX is increasing now indicating a downwards trend is in place. At the end of the week, ATR is not clearly agreeing as it is mostly flat. Some disagreement for these two indicators at the start of a trend is to be expected. If ATR begins to be clearer in an upwards direction, then a trend would be more clearly indicated.
Trend lines today for On Balance Volume have been redrawn on the daily chart: yellow for support and purple for resistance. OBV for Friday has come down to find support at a significant trend line. This may hold price up here for a bounce early next week. A break below this line would be a strong bearish signal. A break below the lower yellow line would be a further bearish signal. At this stage, no more support lines can be found for OBV. Below the lower yellow line is free fall territory.
There is divergence at the last high between price and RSI indicating weakness to upwards movement at the last high. There is also divergence between price and MACD indicating weakness.
Stochastics is not oversold. There is room for price to fall further.
RSI is still close to neutral. There is plenty of room for price to fall. A low may be found when RSI reaches oversold and then shows divergence with price between lows.
VOLATILITY – INVERTED VIX MONTHLY CHART
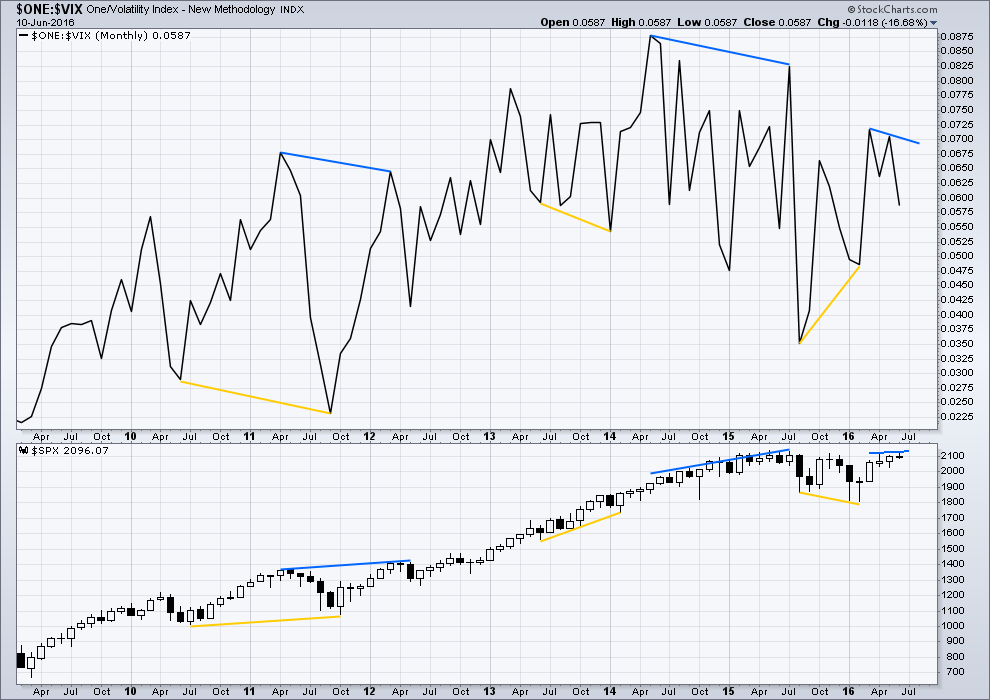
Click chart to enlarge. Chart courtesy of StockCharts.com.
Several instances of large divergence between price and VIX (inverted) are noted here. Blue is bearish divergence and yellow is bullish divergence (rather than red and green, for our colour blind members).
Volatility declines as inverted VIX rises, which is normal for a bull market. Volatility increases as inverted VIX declines, which is normal for a bear market. Each time there is strong multi month divergence between price and VIX, it was followed by a strong movement from price: bearish divergence was followed by a fall in price and bullish divergence was followed by a rise in price.
There is still current multi month divergence between price and VIX: from the high in April 2016 price has made new highs in the last few days but VIX has failed so far to follow with new highs. This regular bearish divergence still indicates weakness in price.
VOLATILITY – INVERTED VIX DAILY CHART
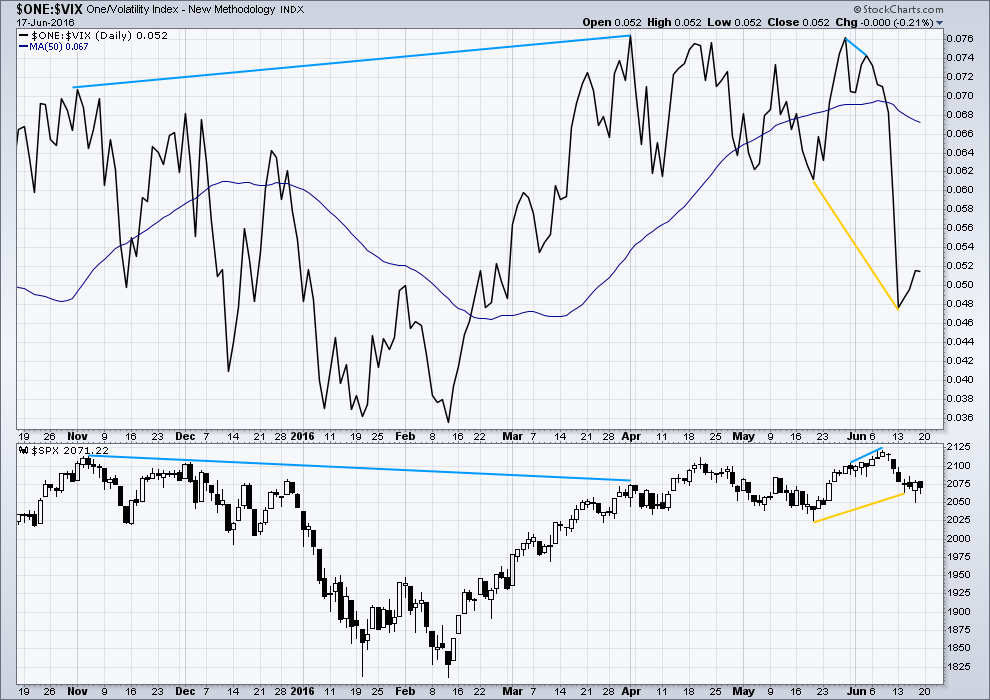
Click chart to enlarge. Chart courtesy of StockCharts.com.
There is now only one instance of hidden bearish divergence noted on this daily chart of price and VIX (blue lines). VIX makes higher highs as price makes lower highs. The decline in volatility is not matched by a corresponding rise in price. Price is weak.
There is also very short term regular bearish divergence (short blue lines). VIX did not make a corresponding new high as price made a new high. This indicates exhaustion for bulls and underlying weakness in price.
Price moved higher for three days in a row (6th, 7th and 8th of June) completing green daily candlesticks yet VIX moved lower. This short term divergence between price and VIX is unusual. It indicates further exhaustion from bulls. This trend in price is weak, especially for the last three days up to the last high.
VIX (inverted) has run away strongly from price. Volatility sharply increased beyond the prior point of 19th May (yellow lines) while price fell.
A divergence 101 interpretation of this is bullish. Volatility is stronger than it was on 19th of May, but this has not translated into a corresponding new low for price. Price is weak. Some upwards reaction would be a reasonable expectation about here to resolve this divergence. At this stage, it looks like that interpretation was correct as it has been followed by some upwards movement from price.
Volatility has declined this week while overall now price has moved mostly sideways. Sideways movement may not be enough to resolve the bullish divergence seen, so it is still my interpretation that at least some more upwards movement is likely. This supports the first two hourly Elliott wave counts over the third.
While I would not give much weight to divergence between price and many oscillators, such as Stochastics, I will give weight to divergence between price and VIX. Analysis of the monthly chart for the last year and a half shows it to be fairly reliable.
BREADTH – ADVANCE DECLINE LINE
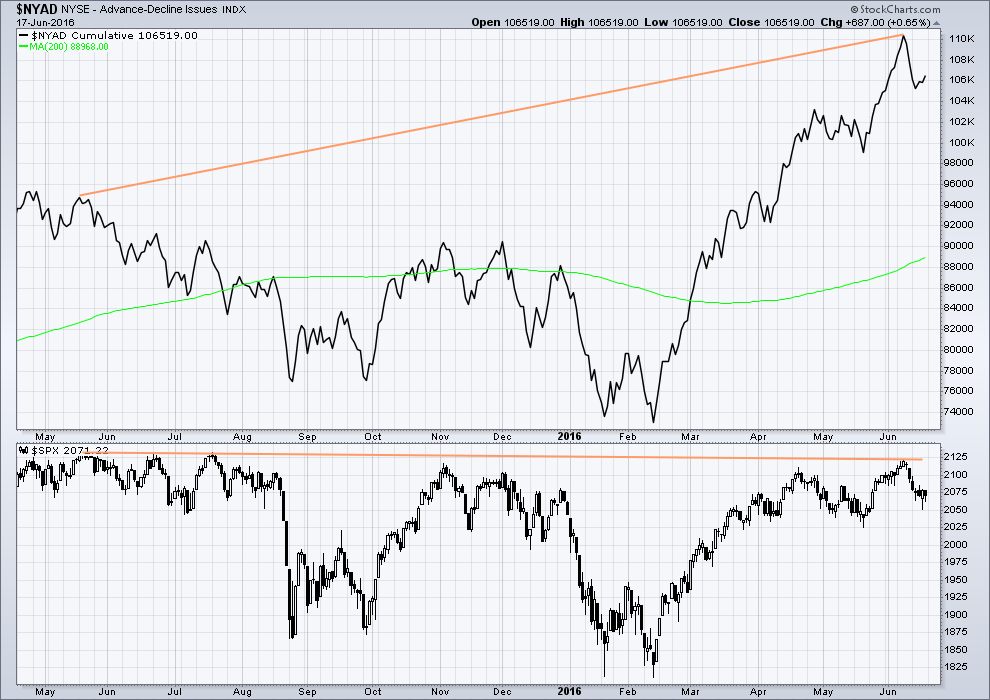
Click chart to enlarge. Chart courtesy of StockCharts.com.
With the AD line increasing, this indicates the number of advancing stocks exceeds the number of declining stocks. This indicates that there is breadth to prior upwards movement.
Taking a look at the bigger picture back to and including the all time high on May 2015, the AD line is making substantial new highs but price so far has not. While market breadth is increasing beyond the point it was at in May 2015, this has not translated (yet) into a corresponding rise in price. Price is weak. This is hidden bearish divergence.
DOW THEORY
The last major lows within the bull market are noted below. Both the industrials and transportation indicies have closed below these price points on a daily closing basis; original Dow Theory has confirmed a bear market. By adding in the S&P500 and Nasdaq a modified Dow Theory has not confirmed a new bear market.
Within the new bear market, major highs are noted. For original Dow Theory to confirm the end of the current bear market and the start of a new bull market, the transportation index needs to confirm. It has not done so yet.
Major lows within the prior bull market:
DJIA: 15,855.12 (15th October, 2014) – closed below on 25th August, 2015.
DJT: 7,700.49 (12th October, 2014) – closed below on 24th August, 2015.
S&P500: 1,821.61 (15th October, 2014) – has not closed below this point yet.
Nasdaq: 4,117.84 (15th October, 2014) – has not closed below this point yet.
Major highs within the new bear market:
DJIA: 17,977.85 (4th November, 2015) – closed above on 18th April, 2016.
DJT: 8,358.20 (20th November, 2015) – has not closed above this point yet.
S&P500: 2,116.48 (3rd Nobember, 2015) – has now closed above this point on 8th June, 2016.
Nasdaq: 5,176.77 (2nd December, 2015) – has not closed above this point yet.
It is a reasonable conclusion that the indices are currently in a bear market. The trend remains the same until proven otherwise. Dow Theory is one of the oldest and simplest of all technical analysis methods. It is often accused of being late because it requires huge price movements to confirm a change from bull to bear. In this instance, it is interesting that so many analysts remain bullish while Dow Theory has confirmed a bear market. It is my personal opinion that Dow Theory should not be accused of being late as it seems to be ignored when it does not give the conclusion so many analysts want to see.
This analysis is published @ 08:33 p.m. EST on 18th June, 2016.
accumulating longs here with e-minis
Peter, That’s what I saw too in the emini’s today. I believe that’s what you are talking about also…correct? If so, that same accumulation that I saw kept me on the sidelines all day today. I couldn’t bring myself to short this move. Reminded me of the move on 6/7.
If this has indeed turned back down, I’ll short the next rally.
I know bearish when I see it. Price action is bearish. Adding UVXY bullish put credit spread…
…uvxy moving up after hours
alas, now rolling over
He! He! They are ramping futures again. Didn’t we just do that? 🙂
That the heavyweights are accumulating this animal is pretty clear. I would not be at all surprised by another gap open. I have never seen this beast fail to close ALL remaining open gaps less than a month old ahead of a new SPX high.
Not quite a hammer in VIX, pretty close in UVXY. Cheerio!
Good morning every body. I’m looking now to add to my shorts. Price came up for a throwback to slightly overshoot the black trend line, also slightly overshooting the cyan line.
There is now what looks like a fairly reasonable five down and three up on the hourly chart.
A new low below 2,079.62 would give confidence that the trend is still down; at that stage downwards movement could not be a fourth wave correction within an unfolding impulse upwards. The last wave up would then be confirmed as a complete three.
A green daily candlestick with lighter volume would add confidence to seeing the trend at this stage as down.
Oops! Hi Lara!
Didn’t mean to post right over your comments. Did not notice you had arrived. Good morning! 🙂
No worries, good morning Verne the Venusian
Remember that is Ven-ooo-sian..! Gotta get that pronunciation correct… as I am sure you did! 🙂 🙂 🙂
Is that a Caribbean accent with the oooo ? 🙂
Shades of Harry Potter with little Emma Watson as Hermione Granger giving spell pronunciation lessons….I know it’s silly, but I have that kind of sense of humor… 🙂
LMAO
I get it 🙂
How annoying. I missed the perfect entry while I slept. Now price is falling… I”m going to wait and watch for a bounce after hours to enter short.
Any intrusion into the open gap above 12.09 confirms ongoing UVXY accumulation; will trigger bullish 11/9 put credit spread expiring next week…
UVXY 13.92 looks to be in play before the close…
Anyone chasing the pop this morning definitely not feeling too spry…
I’m going to suggest that max pain is to go slow and sideways into Mon/Tues next week as premium get’s taken out. That assumes Brexit is a bit of non-event, and portends a complex end to this corrective move up.
My position is currently net short futures at the 2099 area, but now with about 3/4 of that position offset by selling slightly out of the money puts.
A move below 2062.84 and I get very interested in selling bounces again.
Yet another 3,3,5 off the low…
We are basically back to the price level that existed at the conclusion of the 1st 1 min. candle (9:31AM) today 2089.99.
So the rest of the day One Big NOTHING!
The entire move up controlled and manipulated by the Overnight Crew… whoever they are.
Volume TODAY at 3:00PM Now Lower than 57% of the Volume of each of the last 30 Days!
VIX rise off the lows slow but steady.
Strong implication that this massive run up in futures here and across the pond nothing more than a bankster engineered artifact; devoid even of the kind of volume that would suggest bullish euphoria or even big distribution to johnny-come-latelys…waiting patiently for UVXY 13.92….
They could well keep this thing propped up into the close to maintain appearances… will probably load another hedge in the form of a bullish put spread if that happens just in case…
I’m currently short but got a feeling this might be W4 of (c) of Minor 2 with one pop higher to go perhaps to 2107 (76.4fib) (looks better on hourly chart).
Not liking the price hesitation or the lack of enthusiasm in UVXY despite it not crumbling on this move up today.
With all that said, we are still getting 3 waves up and 5 waves down so I’m sitting tight unless some of todays swing highs start getting taken out.
His more stable counterpart (VIX) may be giving a clue. Nice hammer developing with move below 16.59 being firmly rejected…
Well, SPX looks to me more like its in a bullish flag formation than it does a 5 wave down on the 5 min chart. And UVXY on the 1 min. chart looks the same! Something’s got to give.
Agree on the SP 5 min.
I’ve now lowered my stop to 2095.28 after that slight move lower – if we now go above there right now then this move down from todays high will look like a corrective 7 wave double zig zag to me.
I’m seeing 1min RSI div atm
Vern,
Checkout PCLN, it is on a run like they discovered some secret cure. The company lowered the estimates for coming qtr (as the normally do every qtr to beat them), yet the stock is marching higher.
Looking like a corrective pop to me. Somebody ought to short that puppy. Maybe it will kiss the upper BB before the plunge… 🙂
Truncation! SPY 208.69 next….thank you! 🙂
2091.14 SPX…
Nothing to do but wait for VIX to start a vertical climb…*Yawn*
45 min to go for this hour, but take a peek at the SPX hourly candlestick pattern developing today.
I just LOVE this Quote… President Obama says “now is the best time to invest in the United States.”
Depends on what – if bankruptcy specialists / liquidators / auctioneers etc – then I agree (and not only in US).
Unfortunately weapons manufacturers will probably also continue to do quite well
Exactly…
I have a whole group of friends & family beginning the process to purchase.
Whilst not exactly textbook it looks to me like we have 5 down now at a reasonable degree (not sure atm exactly what degree) – a 3 wave bounce now would be nice (might need another small pop lower first to finish W5 of 5 down from todays high).
Whilst we continue impulsing down and correcting up I’ll remain happy 🙂
Still got my suspicious head on atm, but I’m in the water anyway.
“Whilst?!”
Waxing Shakespearean? I must say I do like it! 🙂
The Volume pace continues to slow today… Back to previous levels at this time of day going back 30 days.
So it’s back to where it has been for the last 30 days atm for the most part and continuing to slow.
4 hour SPX chart. From EW rules – a wedge, or ending diagonal can be at the end of a “c” correction, here an Intermediate (C). Wave 1 is usually the longest, wave 3 just cannot be the shortest of 1,3 and 5. As noted on the chart 3 and 5 up can be a-b-c’s or both can be 1-2-3-4-5’s pattern too. Trendlines are converging, ran out of room a little but you get the idea of what I drew. Noting again my boxed numbers are Minute waves as my platform doesn’t allow drawing a circle around the number.
when Minor 3 tops out it will give two points to draw the upper trendline, which in turn will give the angle of the slope, which will give a price target for Minor 5 up. Where there can be a throw over too of wave 5 ending, then plunging down.
Thanks Peter. This chart is quite helpful for me to understand your thought.
C waves may subdivide as impulses or ending diagonals.
Ending diagonals must have all their subwaves as zigzags. They cannot be impulses.
That’s leading diagonals.
The rules for ending and leading diagonals are slightly different.
Normally an ending diagonal is 3-3-3-3-3. And 5-3-5-3-5 is normally a leading. But both have been seen at an ending pattern, mainly in commodities. Hence my note at the bottom right in the chart above itself. The Minute waves were drawn using circled numbers (my system can only make boxes) and for sure I should have used a-b-c’s for Minute 3 and Minute 5 instead of numbers 1-5, as it is the preferred. But it was noted in my comments just above the chart too. Same conclusion however: Intermediate (C) in my opinion is not finished, thus Primary 2 is not finished (yet). Confirmation will be when Minor 1 in the above chart is taken out to the upside.
Picture not clear to me at all. Contradictions all over the place. Can’t tell if this market is going up or down, but currently thinking up…at least on the 5 min chart…FWIW.
Will wait on the sidelines before committing money in either direction.
Hi all….this is what i see..
need more time to enter to uvxy..or shorts.
Lara what do you think ?
Thanks!
Looks good….
C could be over though. If the first wave within it is a leading contracting diagonal. With the size of downwards movement at the end of todays session it looks more likely that the correction is over.
But generally, yes. This is the same idea as what I’ll have for my main wave count today
Looks like a small impulse down to my eyes…now for three corrective wave up and a nice big fat red candle down….
I’m not liking this hesitation – want to see it start picking up momentum soon.
Could be a larger degree 4th wave sideways correction. Could do with taking out the 2079 high from a couple days back for a start.
Yep. I was expecting one more pop higher; it may still come…
Prices on option chain calls showing steady erosion and now below this morning’s open. This is not the stuff of which third waves up are made folk…I would be very careful on the long side here….
Yep, the duration price skew from this morning has corrected itself. Looking normal.
Unicorn on the move. Stand by…eyeing 13.92 VERY carefully! 🙂
If we are done today, look for VIX to plot a course directly North of the border…
Vern,
I have been trying to get some PUT on SPY/OEX all morning but MM aren’t playing ball. It has been very tough to get puts in the market and now that it is off the highs, it will get tougher…
This is what they do at inflection points and why I like to get positioned ahead of time with spreads. They will absolutely make you pay nose-bleed premiums to get positioned ahead of a big wave to the downside. You may want to take a bit of the sting out of getting positioned by selling some bearish call spreads a month or so out…
Closing the long side of my SPY 206/205 bull spread. On final pop higher will sell bearish call spread and maintain short side SPY 205 puts…
With vol this high maybe a UVXY buy-write is worth a look…
What volume is “this high”???
Overall Market volume is NOT “this high”!
Sorry – I was referring to UVXY’s IV rank, not volume.
Okay Thanks
It sure looks to me like US traders are fading this pop. We already have a noticeable upper wick in today’s candle. Unless they fill it out that’s bearish…
Distortions all over… One is… UST Yields materially higher & dollar weaker for example.
This is unexplainable! Anyone care to try?
We’re in a wedge. In my opinion this is not a Minute c of a Minor 2 up, where a Minor 3 down would be immediately thereafter, part of an overall larger Intermediate wave 3 down. Advances are 3524; decliners 440. This is one indication it is a real impluse wave, not a rotted from the inside c up just before a Minor 3 in a Intermediate 3 down. The count of Minute 3 up of Minor 3 up. From the June 16th low we are in the a of the Minute 3. Then b of Minute 3 down, then c of Minute 3 up which is the one that will take out the 2021.52 high. It could go to 2022-2025ish, then do the Minute 4 down, then Minute 5 of Minor 3 will could hit the 2134 high as a major double top all the way back to May 2015.
Peter I believe the only motive waves, according to EW rules, that can have a third wave with an a,b,c subdivision is a diagonal. If you believe it to be an impulse it has to be a five wave structure…furthermore, today’s volume profile I think militates against a third wave up…
An ending diagonal, or wedge, has a count of 3-3-3-3-3 (waves 1, 2, 3, 4, 5 to complete the Intermediate (C) up). The current Minor 3 up we are in will have a five wave pattern upwards in its “a”. Three waves coming downward in its “b”. Then five waves upward again in its “c” to complete the Minor 3 of Intermediate (C). With Minor 4 and Minor 5 yet to go, in Minute a of Minor 3 now. A wedge is a five wave structure, Minor 4 down will typically overlap Minor 1 up too. The entire structure is considered an impulse wave.
A picture is worth a thousand words. If you have time, I’d love to see your thoughts on a chart. Thanks Peter
Thanks Peter for your thoughts. Its good to have someone following the possible bull wave count closely. Worst thing for a trader is tunnel vision…
Keep your updates coming…
Couldn’t agree more
Oh, I’m not following the bull count, this is a BEAR count. Will post a chart up above.
Peter It is my understanding that while diagonals have an impulsive pattern, they are not considered to be impulses. Not all motive waves are impulses.
O.K I think I get it. You are saying the diagonal is just part of a larger impulsive structure. I just re-read what you said.
Have a look at the SPX on May10…. Then today…
See any similarities?
If the market is kind enough to play that fractal out then it’s gonna be a good week for shorts 🙂
We might currently be carving out a small 4th wave. Still not out of the danger zone yet – this move down might still end up being corrective.
Really need to see 5 down and 3 up reversal pattern going below 2095.40 to have more confidence imho. (1min chart)
Yep! I agree. We need one more pop higher at least for clarification. Keeping an open bid on the long side of by SPY bull spread in the hope of getting filled on the next pop higher…it should at least approach this monring’s lows on the next move up…
This move getting a bit old now to be the wave iv on my chart imo – so maybe the first impulse down finished at the 2095.60 low and we are now in a small wave 2, or maybe we are tracing out a double zig zag correction from todays high.
Below 2095.40 I’ll be shorting with a stop at todays high.
EDIT: Back all in – with stop at todays high
Stop moved down to 2097.94 – move down from todays high might still be corrective.
SPX Volume 1st One Hour Candle 9:30-10:29:599AM….
127.284 Million – TODAY
315.710 Million – Friday
This will be meaningless the rest of the day so this is final post on volume.
Buying back UVXY hedging calls…still holding SPY bull spread that is going absolutely nowhere despite this morning’s pop. MMs are not “buying” it…neither should we….
UVXY not dropping as much as expected!
Sold all my UVXY last week so want to reload, but was hoping for much cheaper.
Looking at calls…
What does that tell ya….hmmmnnn?! 🙂
SPY 206 put bids already up 30% off this morning’s lows….
UVXY calls are expensive too, with not much spread between short and long duration, with some weird price skews – i.e. 39 day’s are cheaper than the 32 days.
When that happens you know a big move is upon us.
This pop is as phony as a 9 dollar bill. Spread bids clearly show MMs setting up eager bull sheeple for a serious fleecing…puts remaining stubbornly expensive considering the big pop, UVXY still well above 9.35 recent low suggesting limited upside… 🙂
The BULL Talking Heads all GIDDY at the moment… They can’t even control their laughter!
Numbskulls! Or probably worse, misleading fraudster porpagandists… 🙂
Printed 2,100 now moving higher..
Almost at extreme greed!
http://money.cnn.com/data/fear-and-greed/
Not extreme enough. I noticed it was in the 80’s early June….
I’d expect it to be much higher ATM actually. A bit concerning TBH
I might have the structure wrong but atm I’m still playing this move up as a terminal thrust out of a triangle. Target is the same as Lara at around 2099
If it is… and it certainly looks like one, then the final head fake and Trap.
As soon as I see a reversal pattern it’s on like Donkey Kong 🙂
Being careful not to jump the gun atm
SPX Volume 1st 30 Min Candle 9:30-9:59:599….
315.710 Million – Friday
88.435 Million – TODAY
Sorry… correction on 1st candle volume for Friday S/B 276.533 Million
I will post the 1st full hour when final.
Watching bids on my bull spread like a hawk; as soon as I see the put side bids pop back to above this morning’s open we’ll know the head fake is over…sneaky little #@$%^ aren’t they?!
If UVXY closes that 13.92 gap today…Farewell Spanish Ladies… 🙂
If we impulsively move below 2095.40 in the near future I’ll start piling in.
2100 ish good resistance so far.
Yep! We well may be looking at a one day wonder…! The banksters clearly had a huge collusion party this weekend…! 🙂
The Unicorn is giving ’em the finger….er…I mean the horn….we’ll probably see at least one more spastic spike…put side bids almost back to open prices…Wow!!
UP 20.50ish at the open (1st 3 min)… WTF????
It’s All part of a BREXIT CON JOB! And/Or the after effect of the Triple expiration non-event from Thursday & Friday.
If you have to ask, “Is this a 3rd wave?” it is probably not a 3rd wave. We have been repeating this statement as we await some sort of 3rd wave down.
With the action off the 2050 low a couple of days ago it looks like a 3rd wave. We have a strong reversal with decent volume. There was a bullish engulfing candlestick. MACD showed a positive divergence. What looks to be a Wave 1 from 2025 to 2118 can be counted as an impulse. That same move produced a higher high with a higher low produced two days ago. Now we are going to have a very strong gap up. We will have a move to start the 3rd wave of over 1% in the SPX. Something we have not seen in a while. VIX has come back into its daily Bolinger band after pushing it upwards and gave us a SPX buy signal. The lower band is all the way down at 10.50.
I must admit It looks like a third wave to me. The question is, “Is it a 3rd wave in a corrective C of Minor 2?” or “Is it a 3rd wave following a wave 1 up from 1810 to 2111?”
Right now I am thinking the odds are in favor of the latter and a new all time high is on the way. Price is the foremost and final indicator and in a few days we should have the answer to the above questions.
For any of you who think I am crazy, I offer the words of my friend, Sheldon. “I am not crazy. My mother had me tested!”
Rodney,
I am with you on the expectations for ATH.
I don’t believe the third wave up scenario begins until later in the year, but (like everything else) it’s technically possible.
I still believe we are in a corrective structure and this move up today is a c wave of B in a larger corrective structure. (to form a wave 2 after the impulse up from Feb low)
Trades wise I’m loading up with shorts here again as I think we will get a C down very soon. No doubt this will have lots of folks believing the world is about to end, again, and Gartman will flip bearish, again.
Still maintain the position if we don’t break the mid 19’s, the bull market ain’t over just yet, but we won’t see those levels until later in the summertime
A quick heads-up for you nimble traders trading the market to the upside – as much as you enjoy admiring the green numbers in your brokerage account, I would not leave profits sitting in this market.. “Nuff Said! 🙂
Agree
Locked profits on OEX long positions opened into the close on Friday. Now watching the markets develop.
You just gotta love the banksters! This possible minor two top is shaping up to be just as dramatic, if not even more so, than the P2 top. Remember the nail-biting, hold-your-breath excitement as we watched and wondered if the ATH was about to be taken out?! Well, here they come again. I seriously doubt there are going to be too many bears around after what the European markets have done today. It will be interesting to see how long the euphoria lasts. I cannot imagine a more story-book prelude to the start of the serious leg of a P3. Could we be looking, in real time, at the mother of all bull traps?! Seems kinda fitting! I will be on the look-out for the mother of all bearish engulfing candles….have an absolutely awesome trading day everybody! 🙂
UVXY already struggling to hold $11 and given the uber bullishness, we are likely to see it go down to $10-$9 level today…
New lows on the way in all likelihood. Glad I hedged my long trade with that bearish credit spread.
Looking at futures before bedtime… it’s exciting how it’s following Lara’s counts.
And what a gift Mr. Market is possibly presenting us. It was Olga who once said “Mr. Market and I have scores to settle…” or something like that.
Well, here we go… I’m not missing this train 🙂
Looking forward to another week of interesting posts.
GLTA 🙂
In Frankfurt watching the S&P futures rocket up. Saying goodbye to my minute w(iv) triangle idea..Totally on board with minor 2 up now. Futures appear to be putting some kind of ending diagonal now so don’t know how this will influence cash market this morning. I believe Vern has it right.
General(not scientifically) mood here in Germany is about 50-50 on Grexit. Flying back to Houston in couple hours so will be missing the action today. Staying short with a buy stop higher to add to position. Everyone have a great trading day!
Posted late in the last daily board and here again: Beginning with the Bear daily count chart, wave (C) was much less of a move in points than (A) wave. Noting wave C’s are typically a ratio of A such as 0.618; equal to; 1.618; 2.618. Wave (C) was dramatically less in time too versus (A): 73% less. This is worrisome to me as a Bear.
Adding – Alt count: intermediate wave (C) on the Bear daily count is much too small, both in price and time. It is a wave of a smaller degree: a minor. My gosh – intermediate wave (C) is not over with yet! Meaning larger primary wave 2 (with circle around) is not over yet either. The high of June 8th is minor wave 1 up of intermediate (C); June 16th low was and a-b-c down of minor 2 of intermediate (C). We are in minor 3 up right now of intermediate (C). Plus there is minor wave 4 down and 5 up yet to completed, then Primary 2 will be done. I’ll chart it in the morning.
Peter, if you want to play around with the wave labels, I think your thoughts would be most welcome, as many others continue to do so and really contribute to everyone’s understanding of the situation as we have progressed.
However, if I am reading you correctly, what you are suggesting violates an important EW rule, i.e. that wave 2 cannot ever trace more than 100% of wave 1. As Lara has traced it, primary 2 already has retraced more than 95% of primary 1. To go more than a few insignificant points beyond that is not possible, because primary one began right at the all time high. How are you going to get around that basic problem?
There is a way, looking at it now….busy looking at the markets now for possible trading.
Difficult to see a minor third wave up now without a new ATH which would invalidate a P2 top. I suspect we are about to see another ferocious impulse up completing intra-day to conclude minor two up. Once again, volatility will tell the tale…
That is why the final price confirmation point for the wave count is 2,025.91. Only below that point would the alternate you outline be invalidated.
If intermediate (C) is incomplete then minor 3 would have to be short, and minor 4 shallow, for it to unfold and remain below the invalidation point of the ATH. I don’t think there’s enough room for that to work.
That idea sees a third wave up beginning now. It should show an increase in momentum and it should have strong volume. If upwards movement has neither, then no matter how close to the invalidation point on the hourly chart it gets then a third wave would not look right.
So before invalidation there should be an indication if the idea is right from volume and momentum.
2hr SPX chart
and the boxed numbers are supposed to be circles for Minute waves…but the platform I’m using can’t draw a circle around a number.
Anyone paying attention to or doing TA onBaltic Dry Index(BDI)? In the past it has been a good gauge of economic activity as it shows the trading strength.
Ris, I haven’t tracked it and am not aware of anyone who does on a regular basis. Its only one indicator of economic activity and its global in scope. It just doesn’t correlate with our stock market. I’ve found that its more helpful to stick with tracking those sectors or other indicators that tend to act as indicators for our market–canaries in the coal mine, if you will. Banks, semi’s, high yield debt and transports tend to work well in that way.
6 month stable up off low, 1 month view dip down but early to see if a trend.
Well Futures popping higher, a nice gap and hopefully an oppurtunity laying before us all
Most auspicious indeed! I rarely root for the banksters but I am delighted at the opportunity they are presenting us here. Let’s hope they can keep things ramped up at least through the open and we do indeed get a nice pop higher towards the wave count’s targets. Go banksters!! 🙂 🙂 🙂
Yup I saw the same and they might run it higher for shorts to chase the market. It is a tough market to trade and you have tone very nimble.
A few folks on various TA calling for top in the markets around 1st July or so.
Meant to be very nimble
I can say not surprised at all..
First Brexit Poll Since Jo Cox Killing Has ‘Remain’ in Lead By Simon Kennedy
http://bloom.bg/1Owe9BB
Hopefully the intelligence of the British folk will prevail and they will realize how shamefully they have been manipulated. The ruthlessness of these globalists is nothing short of astonishing; I suspect that even that so-called poll is nothing but more psi ops propaganda. The people of the UK should be hopping mad over what these malevolent creatures are doing to them….
Vern,
They are caught in a tough spot, unless they want to endure the pain of recession for few years there is only one option left for them.
I agree wholeheartedly Verne, but unfortunately, it looks like the momentum has shifted, post shooting. Can’t help but wonder whether it was really a random event.
I’ve just had a brief convo with a new member about NZ and tips for a visit here, and I thought just so you all know, if any members are considering a visit to New Zealand let me know. I’ll give you all the local tips I know and help out with making sure your visit goes smoothly. I’ve lived all over the North Island and have visited the South Island, and have family there. I know my country pretty well.
If any members visit NZ it would be fabulous to meet in person.
Very generous and welcoming! New Zealand looks like a beautiful country and I will have to make the trip. 🙂
Thank you so much Lara! Just spent one short overnight in NZ many years ago, when I hardly saw more than the airport, but would love to visit it sometime. From your comments, it sounds like a beautiful and inviting place.
NZ sounds like paradise from the perspective of the U.S. rustbelt 🙂
Plus – the NZ wine is excellent.
We have four vineyards, a couple of olive groves and a chocolate factory in Mangawhai where I live. Stunning white sand beaches, great surf (especially for long boarders) and forests with waterfalls and Kiwi living in them just behind.
I think it’s a close to paradise as you can get IMHO.
*not biased at all*
Thanks Lara. I really like the main hourly bear count with Minor 1 ending at the swing low. This makes much more sense to me over Alternate I with the higher end to Minor 1. It looks better on the daily chart as well.
I think there may be a very good chance we will see Minor 2 go higher than the 61.8% retrace just like Primary 2 did.
yo Rodney,, found a song for you ,,since we are both from nowhere,,https://www.youtube.com/watch?v=yRv34Cat3Vw your welcome,, from the Turd ,,,at least we are from nowhere, unlike Verne the Venusian,,
“Verne the Venusian!”….has a rather nice ring to it…emphasis on the “U”….thank you! 😉
Thanks doc I needed that to sort of lift me today. The Beatles were the greatest group ever, without any doubt. They were followed by this group with one of their famous songs:
https://www.youtube.com/watch?v=pTQiT58AbE0
Both of these groups had the #1 hit through #5 songs at the same time. The only groups or individuals ever to do that. The second group did it twice.
Cheers Rodney, and you may well be right. Minor 2 may take it’s time, and may be deep.
If it is I’m predicting that it will turn some bears here bullish.. short term anyway. Then it will have done it’s job and the market shall be ready to fall in a third wave.
turd again
Second!! 🙂
First!! 🙂