
Downwards movement unfolded as expected for Friday’s session.
Summary: In the short term, a bounce up on Monday looks likely, which may end about 2,109. If it is very deep, it may end when price finds resistance at the lower edge of the blue channel on the hourly chart. Downwards momentum may show some increase once the bounce is complete. We may have confidence in a trend change with a new low below 2,085.36. Further confidence may be had with a low below 2,025.91. How low this next wave goes and how strong it is will indicate which wave count, bull or bear, is correct. So far technical analysis still favours the bear wave count.
Last published monthly charts are here.
New updates to this analysis are in bold.
BEAR ELLIOTT WAVE COUNT
WEEKLY CHART
Click chart to enlarge.
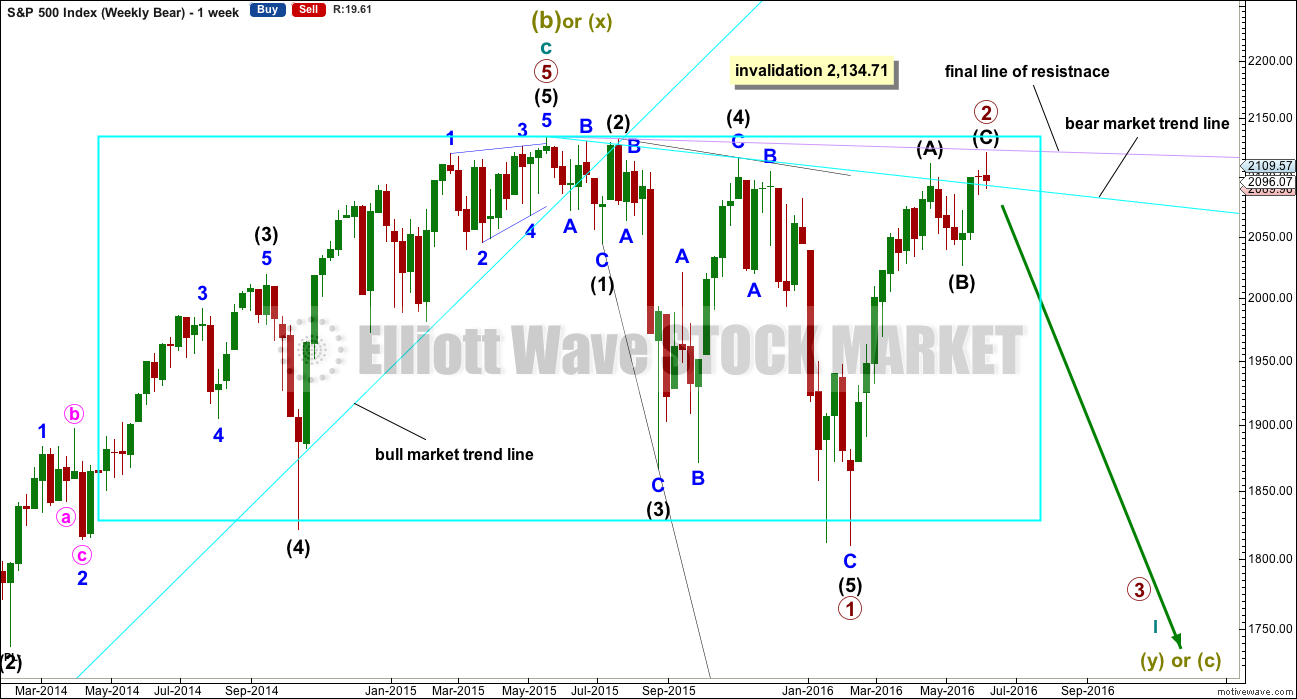
The box is added to the weekly chart. Price has been range bound for months. A breakout will eventually happen. The S&P often forms slow rounding tops, and this looks like what is happening here at a monthly / weekly time frame.
Primary wave 1 is seen as complete as a leading expanding diagonal. Primary wave 2 would be expected to be complete here or very soon indeed.
Leading diagonals are not rare, but they are not very common either. Leading diagonals are more often contracting than expanding. This wave count does not rely on a rare structure, but leading expanding diagonals are not common structures either.
Leading diagonals require sub waves 2 and 4 to be zigzags. Sub waves 1, 3 and 5 are most commonly zigzags but sometimes may appear to be impulses. In this case all subdivisions fit perfectly as zigzags and look like threes on the weekly and daily charts. There are no truncations and no rare structures in this wave count.
The fourth wave must overlap first wave price territory within a diagonal. It may not move beyond the end of the second wave.
Leading diagonals in first wave positions are often followed by very deep second wave corrections. Primary wave 2 would be the most common structure for a second wave, a zigzag, and fits the description of very deep. It may not move beyond the start of primary wave 1 above 2,134.72.
So far it looks like price is finding resistance at the lilac trend line. Price has not managed to break above it.
DAILY CHART
Click chart to enlarge.
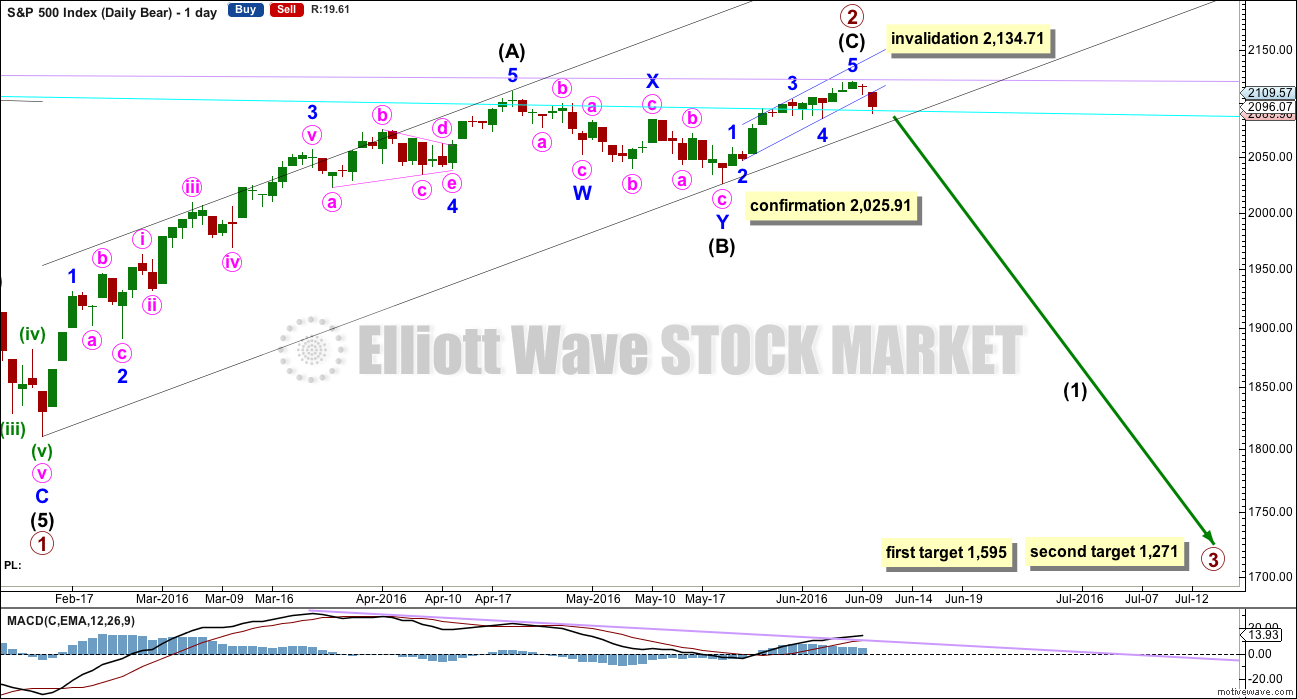
So far primary wave 2 would be a 0.96 correction of primary wave 1. Second wave corrections following first wave leading diagonals are commonly very deep, so this fits the most common pattern if primary wave 1 was a leading diagonal.
The most common structure for a second wave correction is a zigzag.
There is still no Fibonacci ratio between intermediate waves (A) and (C).
Intermediate wave (C) must be a five wave structure. It would be unfolding as an impulse, not a diagonal. The structure may be complete, but as yet there is no confirmation of a trend change. The strong red candlestick for Friday’s session is some indication of a possible trend change now.
If intermediate wave (C) was over, then it would have lasted a Fibonacci thirteen days. Intermediate wave (B) lasted a Fibonacci twenty-one days and intermediate wave (A) lasted forty seven days (not a Fibonacci number). Primary wave 2 would have lasted eighty one days (also not a Fibonacci number). If primary wave 3 exhibits a Fibonacci duration, then a reasonable estimate would be a Fibonacci 144 days.
Draw a channel about primary wave 2 using Elliott’s technique for a correction: the first trend line from the start of the zigzag, then a parallel copy on the end of intermediate wave (A). When this channel is breached by downwards movement it would be indicating a possible trend change. A new low below 2,025.91 would provide price confirmation of a trend change. At that stage, downwards movement could not be a second wave correction within intermediate wave (C) and so intermediate wave (C) would have to be over.
The targets calculated are provisional only because at the end of this session there is still no confirmation of a trend change. They come with the caveat that price may yet move higher which means the targets would move correspondingly higher. They also come with the caveat that at this very early stage a target for primary wave 3 may only be calculated at primary degree. When intermediate waves (1) through to (4) within primary wave 3 are complete, then the targets may change as they can be calculated at more than one wave degree. Primary wave 3 may not exhibit a Fibonacci ratio to primary wave 1.
The first target at 1,595 is where primary wave 3 would reach 1.618 the length of primary wave 1. This target would most likely not be low enough because primary wave 2 is very deep at 0.96 the length of primary wave 1. Primary wave 3 must move below the end of primary wave 1, and it must move far enough below to allow subsequent room for primary wave 4 to unfold and remain below primary wave 1 price territory. Normally, there is a gap between first wave and fourth wave price territory, particularly in a bear market.
The next target may be more likely. At 1,271 primary wave 3 would reach 2.618 the length of primary wave 1.
If primary wave 3 does not exhibit a Fibonacci ratio to primary wave 1, then neither of these targets would be correct.
Well before these targets, it should be obvious if the next wave down is a primary degree third wave. It should exhibit increasing ATR, strong momentum, and a steep slope. However, please note that although it may begin very strongly it does not have to. It may also be that intermediate wave (1) maintains an ATR about 20 – 30 and has some deep time consuming corrections within it. That was how the last primary degree third wave began within the last bear market, so it may happen again.
Draw a channel about intermediate wave (C) using Elliott’s second technique: draw the first trend line from the lows of minor waves 2 to 4, then place a parallel copy on the high of minor wave 3. Copy this small blue channel over to the hourly chart. Upwards movement may now find resistance at either the lower edge of this blue channel or at the lilac trend line.
At the end of the week, downwards movement found some support at the cyan bear market trend line.
HOURLY CHART

Click chart to enlarge.
There is now a fairly clear five wave structure downwards on the hourly chart. This is labelled minute wave i.
If there has been a trend change, minute wave i should be followed by a three up on Monday / Tuesday. If a three up is seen as expected, it would provide some structural confirmation of a trend change.
At the five minute chart level, it is not clear that minuette wave (v) is complete. It may very well move a little lower when markets open next week. However, at the hourly chart level, the green candlestick at the end of the session makes minuette wave (v) look complete.
Ratios within minute wave i are: minuette wave (iii) is just 0.24 points longer than 1.618 the length of minuette wave (i), and minuette wave (v) is 0.83 longer than equality in length with minuette wave (i). This adds a little confidence to the idea that minute wave i may be over.
Minute wave ii may end about the 0.382 or 0.618 Fibonacci ratios of minute wave i, with the 0.618 Fibonacci ratio at 2,109 favoured for a second wave. If it is deeper than this, then it may find resistance at the lower edge of the blue channel. If it is time consuming and very deep, then it should find final very strong resistance at the lilac trend line. If this wave count is correct, that trend line should not be breached.
A new low below 2,085.36 would provide earliest price confirmation of a trend change. At that stage, downwards movement could not be a second wave correction within minor wave 5, so minor wave 5 would have to be over.
Finally, a new low below 2,025.91 would provide final price confirmation of a trend change. At that stage, downwards movement could not be a second wave correction within intermediate wave (C), so intermediate wave (C) would have to be over.
A breach of the black channel containing primary wave 2 would also provide strong indication of a trend change.
Minute wave ii may not move beyond the start of minute wave i above 2,120.55.
At this stage, a possible trading approach to this market would be either to wait for price confirmation (for the less risk tolerant traders), or to enter at the end of minute wave ii with a stop just above 2,120.55. This offers a low risk opportunity to join this possible new downwards trend. Do not invest more than 3-5% of your equity on any one trade, and always use a stop loss. When entering a position at this stage the risk of a loss must be accepted, so it must be managed. Targets at this stage may be those calculated for the end of primary wave 3, with the understanding that as more structure unfolds these targets will probably change.
BULL ELLIOTT WAVE COUNT
WEEKLY CHART
Click chart to enlarge.
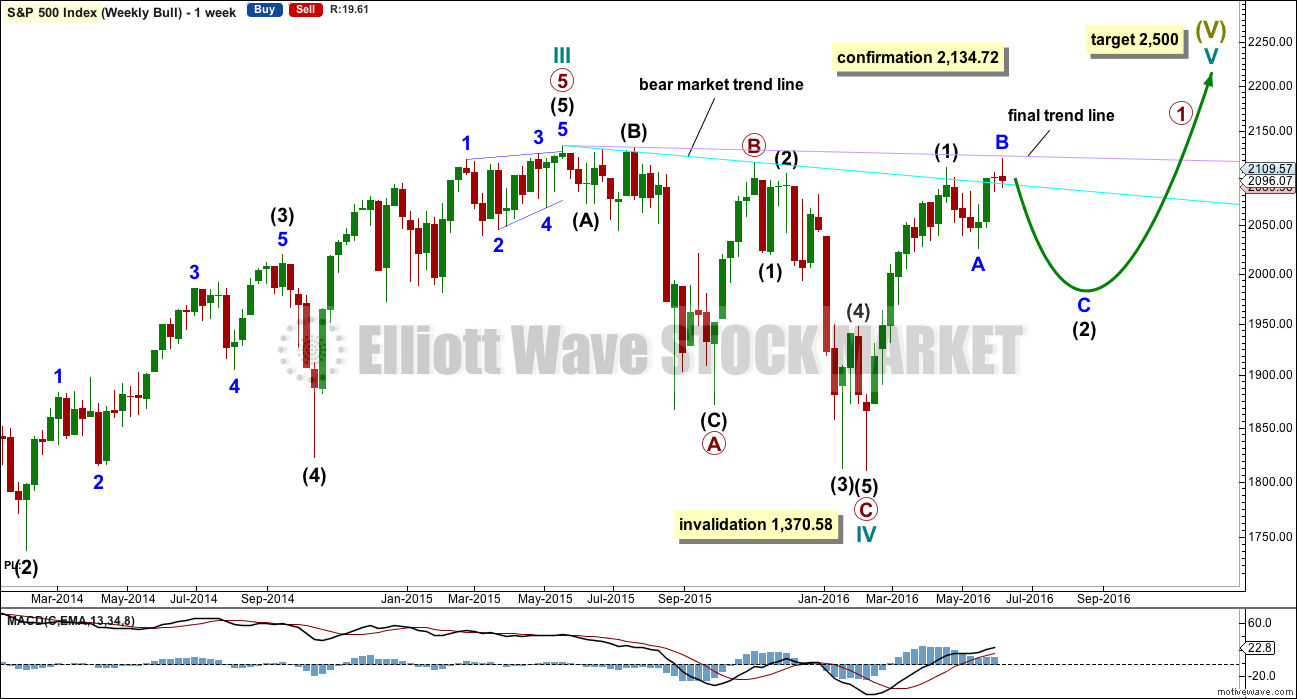
Cycle wave IV is seen as a complete flat correction. Within cycle wave IV, primary wave C is still seen as a five wave impulse.
Intermediate wave (3) has a strong three wave look to it on the weekly and daily charts. For the S&P, a large wave like this one at intermediate degree should look like an impulse at higher time frames. The three wave look substantially reduces the probability of this wave count. Subdivisions have been checked on the hourly chart, which will fit.
Cycle wave II was a shallow 0.41 zigzag lasting three months. Cycle wave IV may be a complete shallow 0.19 regular flat correction, exhibiting some alternation with cycle wave II and lasting nine months. Cycle wave IV would be grossly disproportionate to cycle wave II, and would have to move substantially out of a trend channel on the monthly chart, for it to continue further sideways as a double flat, triangle or combination. For this reason, although it is possible, it looks less likely that cycle wave IV would continue further. It should be over at the low as labelled.
At 2,500 cycle wave V would reach equality in length with cycle wave I.
Price has now broken a little above the bear market trend line. This line is drawn from the all time high at 2,134.72 to the swing high labelled primary wave B at 2,116.48 on November 2015. This line is drawn using the approach outlined by Magee in the classic “Technical Analysis of Stock Trends”. To use it correctly we should assume that a bear market remains intact until this line is breached by a close of 3% or more of market value. Now that the line is breached, the price point at which it is breached is calculated about 2,093.58. 3% of market value above this line would be 2,156.38, which would be above the all time high and the confirmation point.
This wave count requires price confirmation with a new all time high above 2,134.72.
While price has not made a new high, while it remains below the final trend line (lilac) and while technical indicators point to weakness in upwards movement, this very bullish wave count comes with a strong caveat. I still do not have confidence in it. It is produced as an alternate, because all possibilities must be considered. Price managed to keep making new highs for years on light and declining volume, so it is possible that this pattern may continue to new all time highs for cycle wave V.
The invalidation point will remain on the weekly chart at 1,370.58. Cycle wave IV may not move into cycle wave I price territory.
This invalidation point allows for the possibility that cycle wave IV may not be complete and may continue sideways for another one to two years as a double flat or double combination. Because both double flats and double combinations are both sideways movements, a new low substantially below the end of primary wave C at 1,810.10 should see this wave count discarded on the basis of a very low probability long before price makes a new low below 1,370.58.
DAILY CHART
Click chart to enlarge.
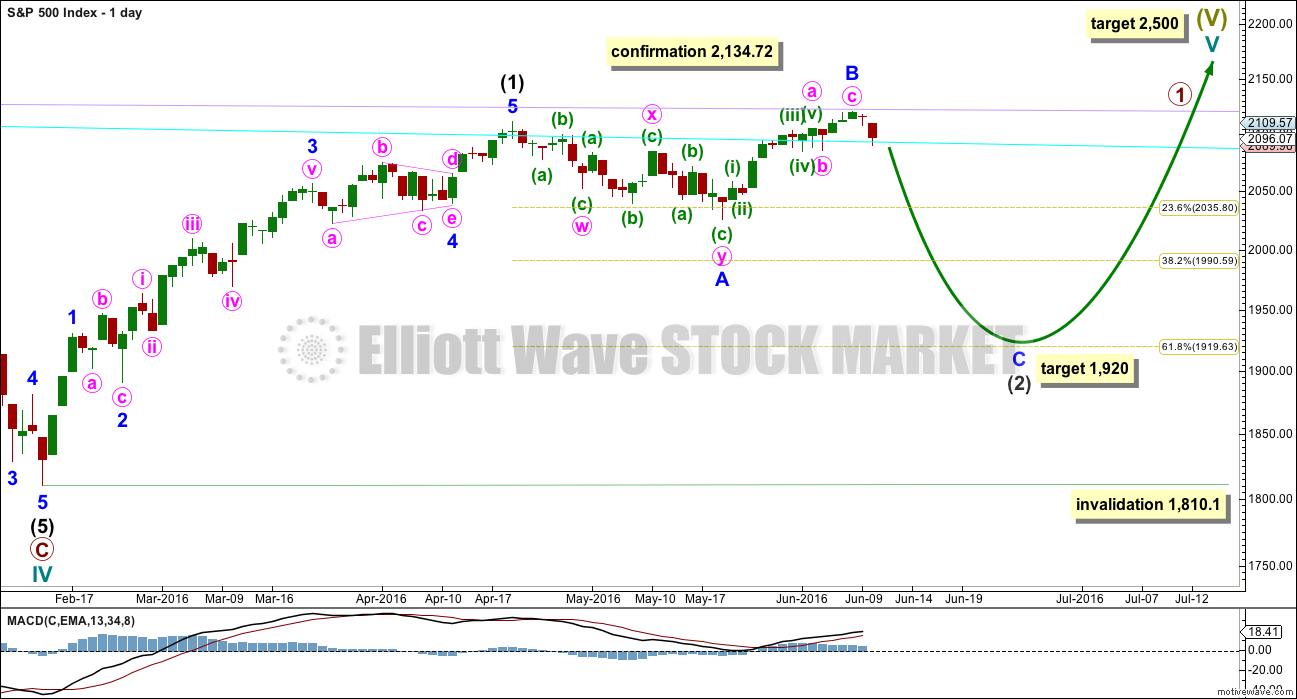
Intermediate wave (2) may still be an incomplete flat correction. Minor wave A will subdivide as a three, a double zigzag, and minor wave B may be seen as a single zigzag.
The most likely point for intermediate wave (2) to end would be the 0.618 Fibonacci ratio at 1,920.
Intermediate wave (2) may not move beyond the start of intermediate wave (1) below 1,810.10.
While it is possible that intermediate wave (2) may be a complete double zigzag at the low labelled minor wave A, this would be a very shallow and rather quick second wave correction. The first reasonable second wave correction within a new bull market should be expected to be deeper and more time consuming for this bull wave count, so intermediate wave (2) is expected to continue.
TECHNICAL ANALYSIS
WEEKLY CHART
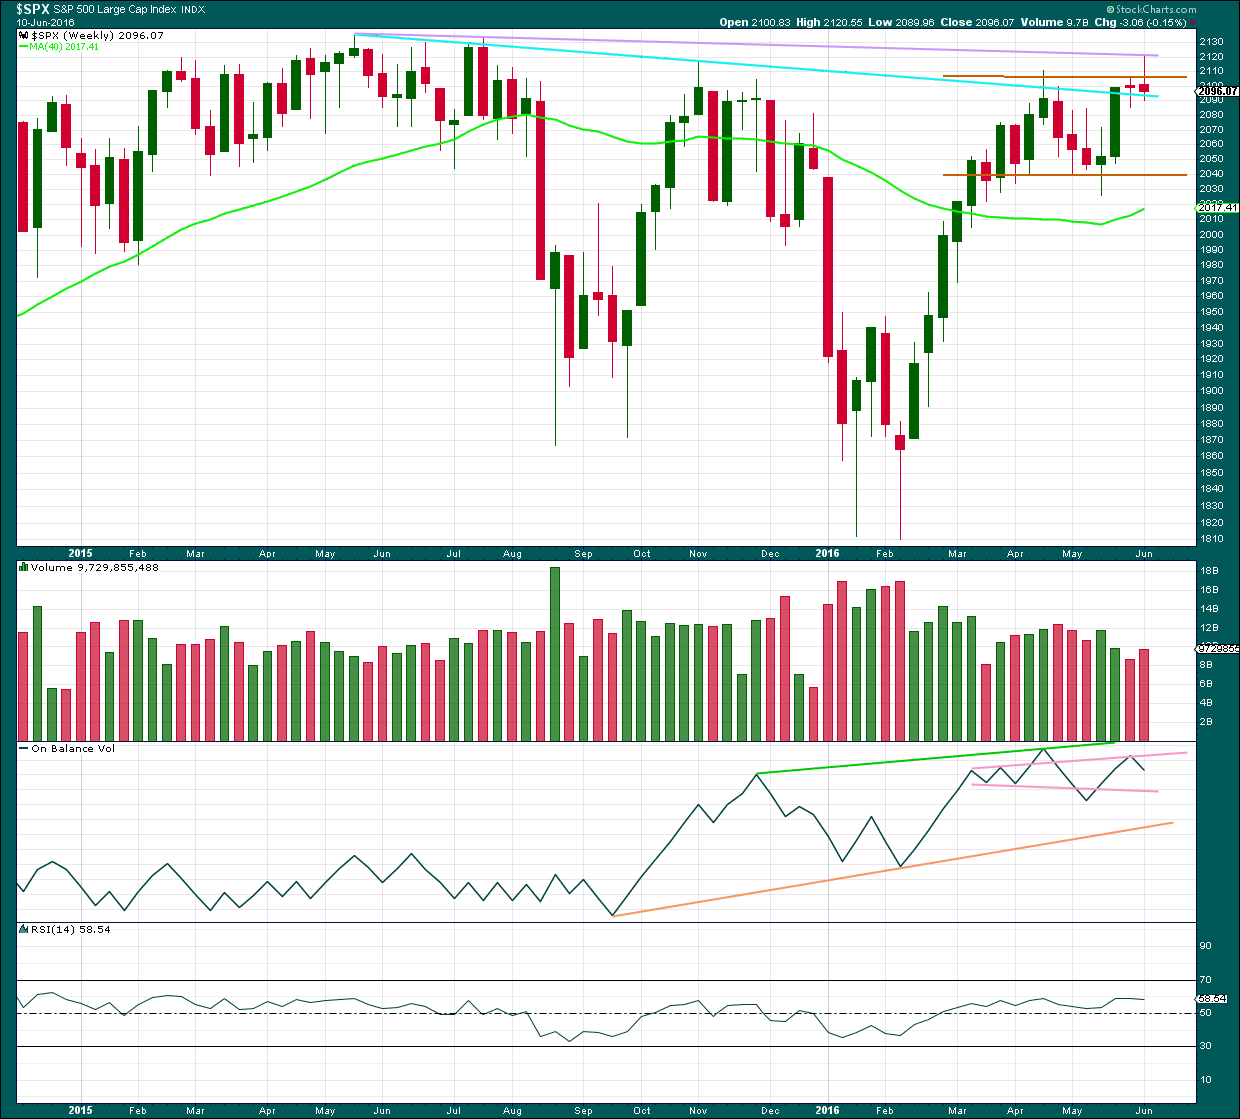
Click chart to enlarge. Chart courtesy of StockCharts.com.
Price is the final determinator and the most important aspect of market analysis. So what has price been doing since the all time high in May 2015?
Price has made an important new high above the prior major high of November 2015. Price is now finding resistance at the lilac line. It can no longer be said that price is making lower highs and lower lows because it no longer has a lower high. This is the most bullish indication from price for many months. This supports the bull wave count over the bear.
Last week completes a small doji pattern with lighter volume. This represents a balance between bulls and bears for the week and indecision. The long lower wick is slightly bullish while the red colour is slightly bearish. This week completes a shooting star candlestick, which is bearish but on its own not overly so. In this instance, because the upper wick of the shooting star is touching an important trend line, the strength of that line is reinforced and should hold if price again comes up to test it.
On Balance Volume this week gives a bearish signal with a move down and away from the upper pink trend line. There is bearish divergence between the last two highs and OBV: OBV could not make a corresponding new high while price this week made a new high above the prior high of 20th of April. This indicates weakness in upwards movement from price.
Volume is declining while price has essentially moved sideways for the last ten weeks in a zone delineated by brown trend lines. The longer price meanders sideways the closer a breakout will be. During this sideways range, it is a downwards week which has strongest volume suggesting a downwards breakout may be more likely. This week price overshot the upper edge of this range, but could not break out as it closed back within the range completing a red candlestick.
There is some increase in volume for this red weekly candlestick indicating there was some support for the overall fall in price.
The 40 week moving average has turned upwards, another bullish signal. However, this has happened before in October 2015 yet it was followed by a strong downwards wave. On its own this bullish signal does not necessarily mean price is going to make new all time highs.
DAILY CHART
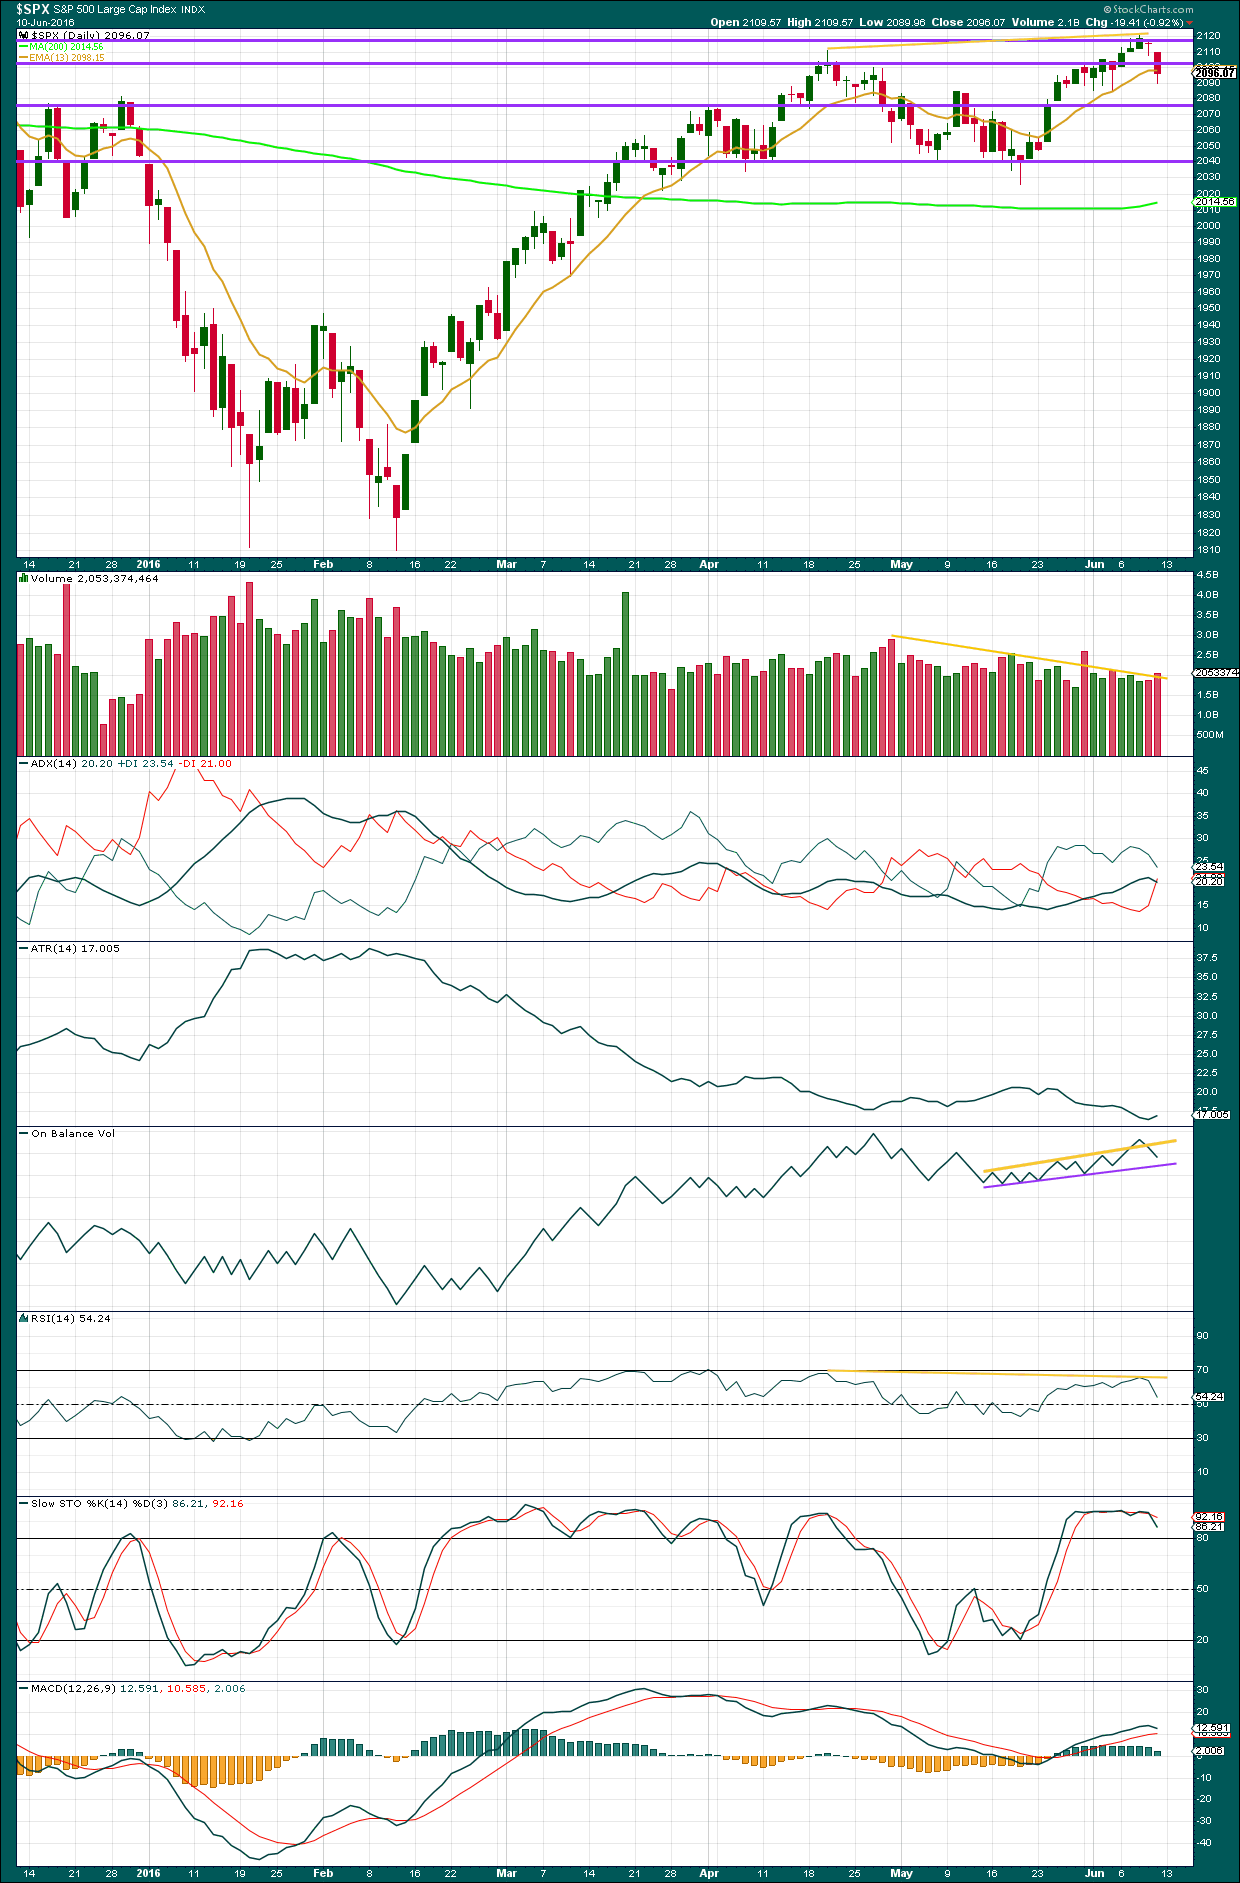
Click chart to enlarge. Chart courtesy of StockCharts.com.
Volume data on StockCharts is different to that given from NYSE, the home of this index. Comments on volume will be based on NYSE volume data when it differs from StockCharts.
The two candlesticks at the high for the week complete a harami cross reversal pattern; this pattern is more effective at highs than lows. In this case, the pattern is strengthened due to the doji of the second candlestick, but possibly may be seen as weaker due to the relatively small real body of the first candlestick in the pattern. On balance, it can be viewed as a reversal signal.
The downwards gap for Friday’s candlestick may be a breakaway gap, so it may provide resistance. This may serve to hold the expected bounce on Monday / Tuesday to no higher than about 2,110.
There was an increase in volume for Friday’s session which offers some support for the fall in price. The increase is only slight; volume is still relatively light.
ADX has turned downwards for Friday’s session indicating no clear trend. The +DX line has moved strongly lower while the -DX line is moving higher. If these lines cross over a trend change would be indicated by ADX.
At the end of the week, the ATR line is slightly turning upwards. If this continues, then it may be indicating a new trend is underway. For now it is not strong enough for any clarity.
On Balance Volume has given the first bearish signal in a long time with a break below the yellow trend line. A break below the purple line would be a stronger bearish signal from OBV.
RSI did not manage to remove the bearish divergence which materialised during the week, and did not manage to reach overbought. This bearish divergence still exists between the highs of 20th of April and 8th of June and indicates more downwards movement is likely. Divergence between price and RSI is usually fairly reliable, so it should be taken seriously.
There is also some bearish divergence with price and Stochastics at the high for this week, but this is not always so reliable. It is a weak signal. Stochastics has been overbought for several sessions now, so it may be expected to return to neutral.
MACD also exhibits bearish divergence with price between the two highs of 20th of April and 8th of June. This is an unreliable signal though, but it is still bearish.
The 200 day moving average has now clearly turned upwards during this week. This is also a bullish signal, but on its own is not enough to call for new all time highs. This has happened before during the bear market rally of November 2015, yet it was followed by a downwards wave that more than fully retraced that rally.
The most bullish indication this week came from price making a new high above the prior major high of 2,116.48 on 3rd November, 2015. However, with a strong downwards close for this week which made the new high the picture no longer looks clearly bullish.
VOLATILITY – INVERTED VIX MONTHLY CHART
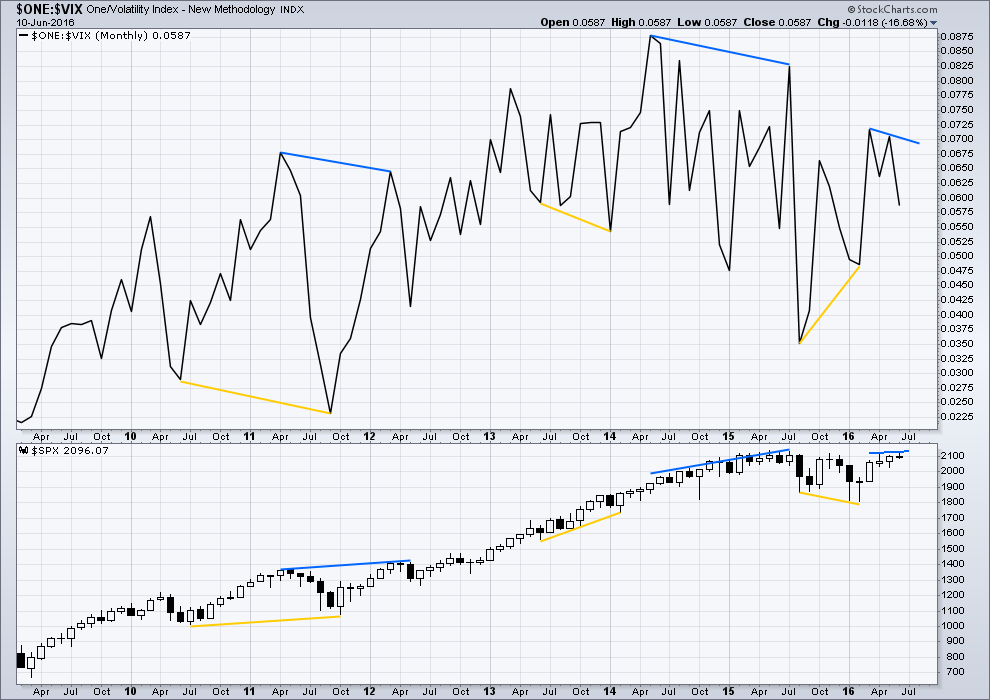
Click chart to enlarge. Chart courtesy of StockCharts.com.
Several instances of large divergence between price and VIX (inverted) are noted here. Blue is bearish divergence and yellow is bullish divergence (rather than red and green, for our colour blind members).
Volatility declines as inverted VIX rises, which is normal for a bull market. Volatility increases as inverted VIX declines, which is normal for a bear market. Each time there is strong multi month divergence between price and VIX, it was followed by a strong movement from price: bearish divergence was followed by a fall in price and bullish divergence was followed by a rise in price.
There is still current multi month divergence between price and VIX: from the high in April 2016 price has made new highs in the last few days but VIX has failed so far to follow with new highs. This regular bearish divergence still indicates weakness in price.
VOLATILITY – INVERTED VIX DAILY CHART
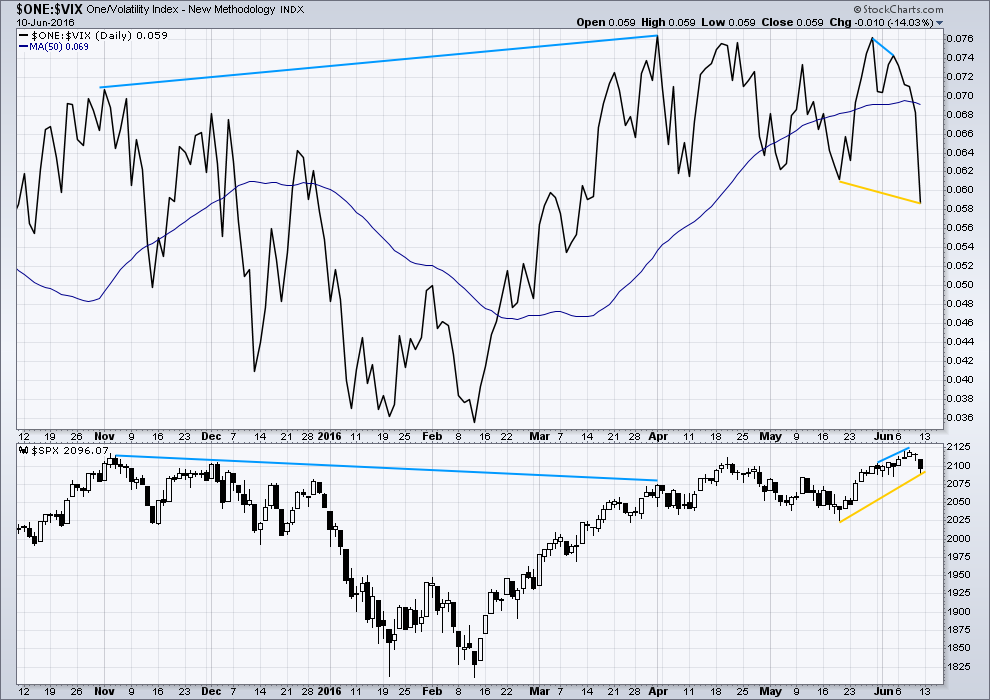
Click chart to enlarge. Chart courtesy of StockCharts.com.
There is now only one instance of hidden bearish divergence noted on this daily chart of price and VIX (blue lines). VIX makes higher highs as price makes lower highs. The decline in volatility is not matched by a corresponding rise in price. Price is weak.
There is also very short term regular bearish divergence (short blue lines). VIX did not make a corresponding new high as price made a new high. This indicates exhaustion for bulls and underlying weakness in price.
Price moved higher for three days in a row (6th, 7th and 8th of June) completing green daily candlesticks yet VIX moved lower. This short term divergence between price and VIX is unusual. It indicates further exhaustion from bulls. This trend in price is weak, especially for the last three days up to the last high.
VIX has moved strongly lower now at the end of the week to make a new low below the prior low of 19th of May. Price has not made a corresponding new low, so this is regular bullish divergence. It indicates that there is some weakness to this downwards movement from price as it does not match the increase in volatility. Some upwards reaction should be expected from here from price. This supports the Elliott wove count which expects some upwards movement from price Monday / Tuesday, and may very well support more upwards movement than the wave count expects. If price does move higher on Monday / Tuesday as expected, then VIX will be watched closely to see if this divergence is resolved by a following move from price, and if any further divergence manifests during any upwards movement.
While I would not give much weight to divergence between price and many oscillators, such as Stochastics, I will give weight to divergence between price and VIX. Analysis of the monthly chart for the last year and a half shows it to be fairly reliable.
BREADTH – ADVANCE DECLINE LINE
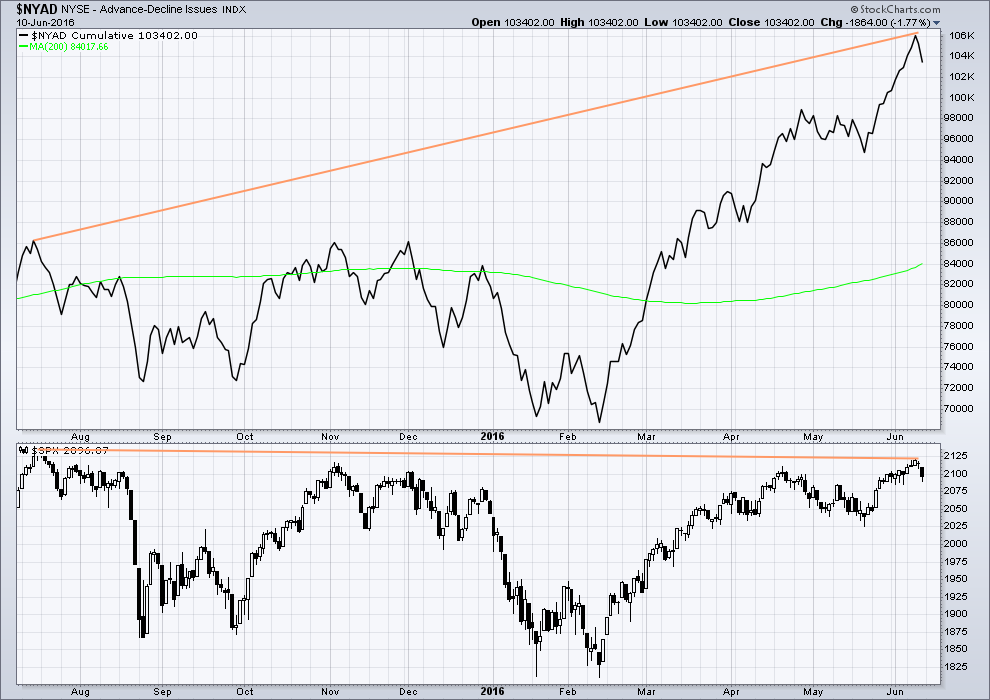
Click chart to enlarge. Chart courtesy of StockCharts.com.
With the AD line increasing, this indicates the number of advancing stocks exceeds the number of declining stocks. This indicates that there is breadth to prior upwards movement.
Taking a look at the bigger picture back to and including the all time high on May 2015, the AD line is making substantial new highs but price so far has not. While market breadth is increasing beyond the point it was at in May 2015, this has not translated (yet) into a corresponding rise in price. Price is weak. This is hidden bearish divergence.
For Friday’s downwards session, the AD line confirms: it too moved lower indicating there was breadth to the downwards movement from price.
DOW THEORY
The last major lows within the bull market are noted below. Both the industrials and transportation indicies have closed below these price points on a daily closing basis; original Dow Theory has confirmed a bear market. By adding in the S&P500 and Nasdaq a modified Dow Theory has not confirmed a new bear market.
Within the new bear market, major highs are noted. For original Dow Theory to confirm the end of the current bear market and the start of a new bull market, the transportation index needs to confirm. It has not done so yet.
Major lows within the prior bull market:
DJIA: 15,855.12 (15th October, 2014) – closed below on 25th August, 2015.
DJT: 7,700.49 (12th October, 2014) – closed below on 24th August, 2015.
S&P500: 1,821.61 (15th October, 2014) – has not closed below this point yet.
Nasdaq: 4,117.84 (15th October, 2014) – has not closed below this point yet.
Major highs within the new bear market:
DJIA: 17,977.85 (4th November, 2015) – closed above on 18th April, 2016.
DJT: 8,358.20 (20th November, 2015) – has not closed above this point yet.
S&P500: 2,116.48 (3rd Nobember, 2015) – has now closed above this point on 8th June, 2016.
Nasdaq: 5,176.77 (2nd December, 2015) – has not closed above this point yet.
It is a reasonable conclusion that the indices are currently in a bear market. The trend remains the same until proven otherwise. Dow Theory is one of the oldest and simplest of all technical analysis methods. It is often accused of being late because it requires huge price movements to confirm a change from bull to bear. In this instance, it is interesting that so many analysts remain bullish while Dow Theory has confirmed a bear market. It is my personal opinion that Dow Theory should not be accused of being late as it seems to be ignored when it does not give the conclusion so many analysts want to see.
This analysis is published @ 04:36 a.m. EST on 11th June, 2016.
What makes the move on VIX and UVXY even more impressive is the lack of big price movement down in the market. We still have not closed 1% down yet on the SPX, going on its 26th session in a row failing to do so…
You a’int seen nothin’ yet. Just wait till intermediate three shows up…! 🙂
Knowing the way the CB operatives think, my own suspicion is that we have a complete minor one down today or quickly tomorrow. Anyone jumping on this last move down from the short side will be subject to the usual and customary face-ripping reversal in a brutal three wave up for minor two, that will see UVXY filling two of the three open gaps and re-igniting all kinds of bullish animal spirits by its intensity. And then…well, you know…! What say ye? 🙂
I think it was Jim that posted an interesting chart about us bears really wanting the second wave after the initial decline. I think he is right on the money on that one as it looks like that is exactly what we are about to get.
I don’t know if the fed will raise or not but if we have the brexit that has been talked about we could have some safe haven buying of the dollar. This could cause a huge downdraft in the market. Vix being bought as insurance. Could have the inverse if the Brits stay in…with a big rally.
Too soon to bet on BREXIT with any VIX type instrument!
+ all you are hearing on BREXIT are scare tactics. To scare Brits into voting to stay in. UK & its citizens are better off long-term to exit.
As I mentioned a few days ago regarding DAX, Kimble makes this relevant observation…
http://blog.kimblechartingsolutions.com/2016/06/global-leadership-germanydax-breaking-support/?goal=0_b4b2358e39-e5ceb5f606-40018945
possible wave count
So I have to go out today and so I must start this analysis now. Because I can access NYSE volume data I’ll start the S&P first. Will come back to comments when I’ve finished the EW portion of that to see what peoples comments are on VIX.
I must admit, I see it as bullish divergence but I bow to Verne’s superior knowledge and experience of this indicator. Anyone else with deep knowledge and experience (Olga?) please put your two cents worth in.
Analysis will be early today 🙂
We’ve also seen bearish divergence off the 1800 lows…..some chalked it up to a short covering rally. Could be same thing here with VIX…the move is a massive move over 3 days, looks similar to how it went last August. Gapping up and closing near the highs.
Volume is the about the same as Friday… difference within my error margin of 4 to 10 million.
Blushing! 🙂
We should get a good clue how bullish the move up (assuming it is indeed up) is by keeping an eye on what happens with the open gaps tomorrow…
Maybe this?
Momentum has been weak today.
I’m a bit concerned though about the explosion Verne’s expecting, and I’ll second Rodney’s advice to sit down Verne before you do some damage with the over enthusiasm… 🙂
Now, what to make of VIX behaviour? (inverted VIX this is) It’s exploded to the downside. Now a divergence 101 reading of that would say this is very bullish indeed. While volatility has increased substantially today price has made a weak fall, with declining momentum. Price isn’t mirroring VIX. Volatility is much higher than price warrants.
From the Divergence Cheat Sheet:
When the oscillator (in this case inverted VIX) makes a lower low and price makes a higher low it should be hidden bullish divergence. Which makes sense in my thinking above.
minuette (b) is now 1.72 X minuette (a)
momentum at the last low is weak, fitting for a B wave indeed
yeah Verne,, sit down before you strain a groin,, wouldnt want to put you on IR
I’ve gotta ask, what’s IR Doc?
Injured reserve,, sports teams put injured players on IR
VIX up 3.89 today to 20.92… ditto to below.
VIX up 3.97 today to 21.00… ditto to below.
I think this is just the end of minute wave 1. Minute 2 to start shortly
Forghettabboudit!!
so your reading of what VIX is up to today indicates a substantial increase of volatility which you expect should then lead to price falling hard?
Is that your interpretation Verne?
I must admit, what VIX has done today is very odd indeed
does VIX usually lead price? or should I interpret this as bullish divergence?
In past years VIX has lead price… but not so much the last year. At least that is what I have noticed. I am no expert on this though.
Either a hard fall, or a meteoric rise.
When volatility runs this far ahead of price (in either direction) it is either VERY wrong or VERY right, in my humble experience…I am leaning towards bullish divergence because of the upper BB penetration…I have a few VIX puts just in case…
EWI is also correctly reporting two standard deviations above 21 DMA for VIX. A close back within it generally signals start of a short term rally, EXCEPT during a third wave decline…
Okay. Thanks Verne.
That’s clear as mud then…
It works except sometimes it doesn’t. Like pretty much all TA really.
Okay… I’m finishing up this analysis now and going with the balance of what I see… a bounce tomorrow expected. Support for price, On Balance Volume and strong bullish divergence with VIX are my reasons.
Oh also, the Elliot wave picture would look much better.
Agreed!! …on all counts… (no pun intended!) 🙂
SPX, DJIA, DJTA, NASDAQ, NYA all have daily RSI crossing 50 and pointing down. Only RUT has yet to do this. Another bearish indicator.
We are going to see run-away futures over-night I suspect. The big question is – what direction??!! 🙂
This going to be so much fun!!
FTSE and DAX look like their about to fall apart too.
We should be at S&P 2000 right now.
FTSE has hit strong support.
3 minute charts looking like series of 1,2’s as Corey has been posting today. This may be what Vern is seeing in VIX. Pretty bearish if correct.
There is indeed an explosion coming…not sure what kind…bullish or bearish…I think I am going to sit down before I hurt myself… 🙂
Yes, please do that!
Is it also possible that the volatility action we are seeing is telling us that this market is in a whole heap of trouble??!!! I am shaking my head in absolute amazement at what I am seeing today…and I am not joking….my UVXY double I sold earlier is up another 30%! Not that I am greedy or anything as it easily met my profit target but this thing is going straight up and looking back! Now kissing upper BB as well…
Maybe, just maybe, it is telling us the Fed will raise rates on Wednesday. Insiders leak information all the time.
Aaaahhhhh…!!! Ya think??!! NYaaah! They are not THAT clueless. Each 0.25 basis point rise translates into a trillion of losses in bonds….
Farewell and Adieu…
To you Spanish Ladies…!
Farewell and adieu….
Ye Ladies of Spain….!
Possible ending diagonal w5 on the 5 minute chart?
Yes, it fits
Well, looks like the UVXY 14.50 shorts are covering. Buy signal at 14.51 issued; will be triggered with a close above at or above, but I think I am going to put a hold on that trade until I see what VIX does today….that upper BB penetration is uncharacteristic at the start of a major decline…the reversion to the mean trade is one of the most reliable trades I know, and right now VIX is shouting that it is about to revert to the mean big time…we should know more by the close…
VIX up 3.33 today to 20.36… I will ask again why this 3 day spike from 12ish ???
Equity price movement including SPX… NOT moving in accordance with a spike up in VIX of that magnitude!
VIX up 3.70 today to 20.73… ditto
I think wave needs to be moved up one degree as Vern suggested earlier. Seem to making minute w(iii) down, but the sub-waves are really unclear ATM. I’m working on 3 minute charts now….no real nice looking solutions yet.
I was thinking he was referring to the monthly chart?
This could be cycle II not primary 2?
Or am I wrong there on what you were referring to Verne?
Either way, I was looking at the monthly chart and considering the degree at that level.
I was thinking up one degree to minor from minute….at the least….VIX suggesting a bigger than minute degree bounce …
Update to Gary’s chart below…
If we have another expanded flat then minuette (c) up is just beginning.
Minuette (b) is 1.35 X minuette (a), nicely within normal range of 1 to 1.38.
At 2,100 minuette (c) = 1.618 X minuette (a). So that’s the target.
Maybe a doji today, and a green candlestick tomorrow?
It still looks to me like the chart counts cleaner with 4 embedded 1-2s.
Not pressing my short position by any means, but definitely not getting too cute for 10 pt bounce…especially if we could open down 30 tomorrow.
The wave structure could be, but look at the middle of the third wave. It’s a sheer drop in 15 mins with very strong momentum.
If this is a series of overlapping first and second waves it should show either stronger momentum or same, but not a decline like this
anyway, a new low scarpers that idea
I hate to be a negative nelly, but this move looks like it’s stalling to me. I just covered all of my shorts. I trade very short term and on the 5 min & 30 min charts, I see bullish divergences.
GLTA
I think we have a correction upwards from here.
Spike in VIX and UVXY is saying otherwise. But in a way I’m with you from the way the charts look. I’ve cut my shorts by 25% myself here
Low of 2085.06 on TOS charts
Confidence 2085.36 now breached again with a 2084.87 low atm.
My source has the same as your’s Joe, a low of 2084.87 today at 2:05 PM.
If we can break below it, then I think the correction (minute ii) would be over.
Now showing 2082.76 as the low. With UVXY up over 20% – odds are on for a big move.
trade SVXY and UVXY…consistently view the corresponding charts (intraday, daily, weekly) for SVXY, UVXY, & SPX…pay no mind to VIX charts…
to be clear, “pay no mind to VIX charts” when deciding when to enter or exit a SVXY or UVXY position…
VIX up another 2.24 to 19.27………. So why the spike?
Certainly not reflected in SPX prices or any other Index. So what does this three day spike mean???
Question for the VIX expert, Vern…. OR anyone else????
Could it mean a 30%+++ move in one day is near???
IN direction of the main count.
This VIX thing is NOT BREXIT effecting markets as the talking heads would like you to believe. That is their latest CON JOB!
To really appreciate the strangeness of what is happening right now look at the level VIX penetrated its upper BB on May 19, the day of the last low. SPX made a low of 2025.91
VIX made an upper BB penetration high at 17.65 with a long upper wick. The question is why are we seeing a higher VIX reading without a corresponding lower low in SPX?
There are only two possibilities.
!. We are about to see a hell of a bounce due to extreme divergence in this price action.
2. All hell is about to break loose to the downside (smart money ahead of the crowd).
I have no idea what is going on folk….
Closing screens and waiting for the drama to resolve itself…’Bye….
Vern I think you have it right with #2 … imho
#2 might make sense in that Asian markets closed about 3% in the red and European markets closed +1% to 1.85% in the red. Perhaps the smart money knows the US markets will follow.
I am not sure why we are printing an indecisive candle in the middle of this decline. Hopefully we get some resolution by the close of trading….it looks like there is some kind of rumour mongering going on…never underestimate the wiliness of the banksters, and the gullibility of the masses- something is rotten in Denmark methinks….
The UVXY big move not reflected in market. I would have thought DOW down easily triple digits??
Some strange things are going on no doubt. The UVXY correlation with VIX was severed during primary one down. I did a bit of checking into what was going on and figured out that there are so many short sellers trading it (they just issue more shares to meet demand and distort the VIX futures corrleation). That may be happening again. It really ought to be illegal to do this since it stops being a real indicator of VIX futures when unlimited shares are being issued without regard to the put/call ratio out beyond thirty days. This is the main reason so many people get hammered trying to trade it- it often bears no resemblance whatsoever to reality…I depend more on VIX to tell me what is more likely to be really going on…
Look at the UVXY 12.50 call expiring this week. If it trades below 1.00 today a bounce is already underway…
Selling 12.50 UVXY this week’s calls for another quick double. I am a bit concerned about that upper BB penetration by VIX this early in the decline. The bands should have expanded to signal additional upside. It may be wave count needs to be moved up one degree…
I have considered that TBH
Will step back again to the monthly chart and think about that some more….
Minuette w(b)…target
Thanks for the chart Gary!
Nice, thank you Gary!
I have it pretty much the same. Only some small differences here and there.
I think minuette (b) has ended now.
VIX has gapped up past upper BB and the bands have not expanded much. I am not liking the look of that at all…we need to complete minor one down today for that issue to get resolved imo…
Minor 1? Today? We have only completed minute i on Lara’s bear count.
I know. It is a bit of a puzzle. VIX should not be outside its upper BB so early in the decline. That is usually a terminal move. It could be doing something different from in the past but that move usually signals an impending mean reversion. I have ignored it in the past because of the expected wave count and that was a mistake I don’t want to repeat….sold my short term positions until I can figure out what’s up…
Well it could indicate a deep minute ii is imminent
Possible, but not likely. The pull-back for a minute degree correction should remain beneath the upper BB. Something weird is going down here….I’m starting to think the bottom is going to drop out of this screwed-up, manipulated market…
Minor one down should bounce at the 200 DMA around 2015.33, probably just in time for “Yammerin’ Yellen” to assure us that “the data” does not forecast an interest rate hike in the immediate future. The funny this is I think it does not matter what she says, it will ultimately be interpreted as bearish, so I am looking for a sharp, but relatively short minor two bounce…..
Final bearish signal I’m looking for is for UVXY to clear 14.50 today, either by way of steady assault on that target, or intra-day gap past it…
50 DMA at 2076.81. Any failure to take out this pivot today tells a cautionary tale for the immediate bearish case. Even at lower degrees, the start of a primary wave decline should be announcing its arrival with the signature demolition of pivots such as this one.
Move below 2088.30 confirms 3,3,5 expanded flat correction off this morning’s gap down low….
VIX suggesting more downside….
I’m still a bit conflicted in that I see a series of 1-2s on the hourly…either way a 3rd down should be getting close (either a 5 wave or a series of 3-4s).
Also, wouldn’t an expanded flat have to go above 2097.88?
Which it literally just did.
We have a three wave corrective move completed. It could be all of minute 2 or just minuette a of minute 2. I am guessing the former.
Another spectacular sign of a top. Satya Nadella is paying 26.2 billion for Linkedin, a 45% plus premium to its Friday close. I have executed a contingency order to short it on the next 5% decline from today’s close. I predict we will see that in less than 90 days.
Vern,
They will probably write this investment just as they did for Nokia. Sign of top on MSFT and IMHO LNKD looks like a good short once the excitement settles down.
All that cash is burning a hole Nadella’s deep pockets. Let’s hope he holds back some of it to service his bonds when their revenue falls through the floor…
Two areas to watch for bounce.
1) 2084-2085 is low from payroll report last week, also 38% retrace from 5/19 low to last week’s high.
2) 50 DMA at 2076 would also correspond to a gap fill from 5/25.
I mention these only as places to potentially scalp.
Joseph,
Your thoughts on the recent article on negative yields
“Gross: Global yields lowest in 500 years of recorded history. $10 trillion of neg. rate bonds. This is a supernova that will explode one day
— Janus Capital (@JanusCapital) June 9, 20”
No comments at this time… I have expressed my views on certain issues several times over a long period of time.
Not going to comment on others when they touch on the topics I discussed.
HI Ris:
Since Joe declined to comment I will tell you what I did about the insane situation in the bond market today- Jan 2018 TBT 40 strike calls at 2.75 per contract! If last Friday was not the low for this ETF, I think we are pretty close. I will keep you posted! 🙂
On Friday, jbarnett11 mentioned some possible VIX and UVXY targets for Primary 3. Below are some Fibonacci retracement targets. I am not sure this works for UVXY but it provides some guidelines and is interesting for discussion. Notice the 61.8% retracement gives a target of 42.
Great chart Rodney. Thanks for posting it. I don’t post my UVXY trades as often as I did previously as I realized that perhaps some our new members were being influenced by my running commentary. Just a few quick points.
99% of traders should stay away from UVXY 100% of the time. if you don’t know what you are doing it will eat you alive. Plain and simple. I know there is at least one other trader on the forum who trades it skillfully so I liked to compare notes. This person understands that 99% of the time the only way to trade UVXY successfully is to scalp it. These kinds of trades are executed in hours, not days.
Having said that, UVXY is the only instrument I know that will let you easily and predictably double or triple your trade once or twice a year on average. If you time it right, ten- baggers are also very do-able.
A usually reliable signal for a long trade has been a second green close after a new 52 week low. That signal has been triggered and negated three times in the last month. I have never ever seen that happen. We may be looking at a very significant low. I have executed several doubles, and one triple trade in UVXY the last three trading days so I am still scalping. As soon as it closes above 12.20, I plan on taking a significant position with a one point trailing stop to sell while it remains under 20. Above 20 the trailing stop will be adjusted to 5 points. If we are in a primary wave three decline, fib re-tracement levels are meaningless for this beast. We are in completely uncharted waters so far as volatility potential is concerned. Trade safely.
Thanks for the thoughts and advice Verne. I have learned much from you including the realities of VIX and its derivatives. I have also learned applying EW counts and classical technical analysis to VIX and derivatives does not work the same.
I listed the chart only to point out another view of where it might go in the future. In fact, if we are in a Primary third wave, it will not be retracing previous moves. Rather it will be developing an impulsive wave.
Thanks for all you do for this forum.
Most welcome my friend; great to be in such good company! 🙂
Rodney,
I see similar price projections on UVXY but like we have seen before the manipulation will be enforced to control these monstrous moves as these will result in a lot of folks going under especially when a large majority are attached to the manipulators. I am with Vern and have been taking quick profits as that is more safe compared to holding for a big pay day.
Smart. The next safe big money trade will be on penetration of the upper BB at the conclusion of intermediate one down. The gap from the 9.79 close on June 7 will in all likelihood be filled on intermediate two up. It will be literally a once-in-a-trading-lifetime opportunity. I suspect the pullback for minor two is going to be shallow and that is when I plan on backing up the truck for calls at least three weeks out; will grab my contingent of actual shares today if we close above 12.20, and capture exploding premium by selling covered calls against my long position with the intention of getting called away. Trading at 13.06 so unless something changes by the open, we will see yet another gap up open today – the third day of “stacked gaps”….
Thanks Ris. I am holding a larger short position. I plan on closing the trade at the completion of Minor 1 or even minute 3 which may start today.
Well I haven’t traded the SPX in some weeks now, looking for more clarity, but these charts are now looking interesting, and the 3rd wave story is making more sense here. One forward looking indicator that I watch actually predicted the drop of last week by a couple of days. It showed a big shift away from SPY calls and into SPY puts, across several timeframes. Will be interesting to see whether that predictive value continues.
European futures a sea of red. Minute two looks like it was as short as any dream…
Vern,
US futures reaction seems muted compared to the overseas markets. I was expecting fairly large drop in the futures but so far not seeing it. I suspect some more hand holding till FOMC is done on Wednesday. But I am being very careful as the hidden hand(s) might be setting up a trap for bears.
Frenetic buying both here and across the pond. You are right to be careful but I don’t think they are going to be able to hold back the tide. They are attempting a “managed decline” and possibly could maintain that illusion until minor three down gets going…
#TeamLilacTrendLine
“Hold the door!…Hodor”
GLTA
A harbinger of darkening social mood may be upon us here in the US. We have just had the most horrific mass shooting in history with at least 50 confirmed dead in an Orlando night club. Early reports suggest an ISIS sympathiser is the shooter.
Certainly a dark day in US and world history. This will add fuel to the fire of banning immigration of Muslims into the US. When I learn of such horrific events, I am glad I live in a very small rural town far from anywhere notable.
May God comfort the families of the deceased and injured.
EWI published their short term update on Saturday this week and finally put some labels on their waves; they are calling the 2111.05 top on April 20 minor one of intermediate five up.
The 2025.91 low of April 19 they have labelled minor two. The recent high of 2120.58 on June they are calling minute one up of minor three. It would appear to me that either the banksters have pummeled them into quivering, simpering bullish submission, or they are trying to get rid of a quite a few of their remaining subscribers! What exactly is going on over there??!!
If they are right, VIX should blow past the upper BB and put in a long upper wick in the next few days on completion of a minor wave down – something I have never, ever seen it do – not for a minor two correction!
If they are not, their subscribers trading that count are had better have very tight stops…!
I have a feeling the second wave correction when it shows up will most likely continue through Wednesday’s FOMC meeting as FED will do its best to keep the markets from a big downwards movement. Can anyone say “expanded flat???” 🙂
And then the next downward thrust begins as the uncertainty over Brexit grips and pulls the markets down… IMHO!
But Friday’s downward move was definitely some honey for an exhausted Bear…
Another possibility is that minute two is brief, and the market rapidly completes minor one down with strong declines on Monday and Tuesday, with minor two up coming just in time for dovish yammerings from Frau Yellen…. 🙂
My “canary” UVXY calls did not give back much value on that final green candle on Friday and that usually means a brief corrective move…
Curious as the whether the old trickster SPX will clamber back into the recently breached bull channel with a deep second wave re-tracement to throw unwary bulls off track on Monday. Impulses down continue to complete intra-day.
We have seen this manouevre so often, we should almost be expecting it…talk about a set-up for miles of smiles…. 🙂
Weekly SPX chart. The real top us bears are looking for came where the “2’s” are labeled on the chart – not the “1’s”. The first big top back in May 15th, 2015 really topped out in the 3rd week in July for the big plunge downward. That took 9 weekly bars. The next top was the week of Nov.2nd but the real top for the plunge down was 4 weekly bars later. With everyone and their brother, and sisters, looking at the charts the surmisation is it will take the market much less than 4 weeks this time to recognize the next big drop. The question is is it a linear or logrithmic decrease? Dealing with humans log might be the odds on favorite.
Wow. First again.
Well done 🙂 I was just popping in to see who was first….