
Downwards movement did materialise as expected but not by much. Confirmation points have not been breached and price remains within the channel on the hourly chart.
Summary: Price is persistently weak but no trend change is yet indicated. Earliest confidence in a trend change would come with a new low below 2,085.36. A breach of the large black channel on the daily chart would provide further confidence. Finally, a new low below 2,025.91 would provide confirmation.
Last published monthly charts are here.
New updates to this analysis are in bold.
BEAR ELLIOTT WAVE COUNT
WEEKLY CHART
Click chart to enlarge.
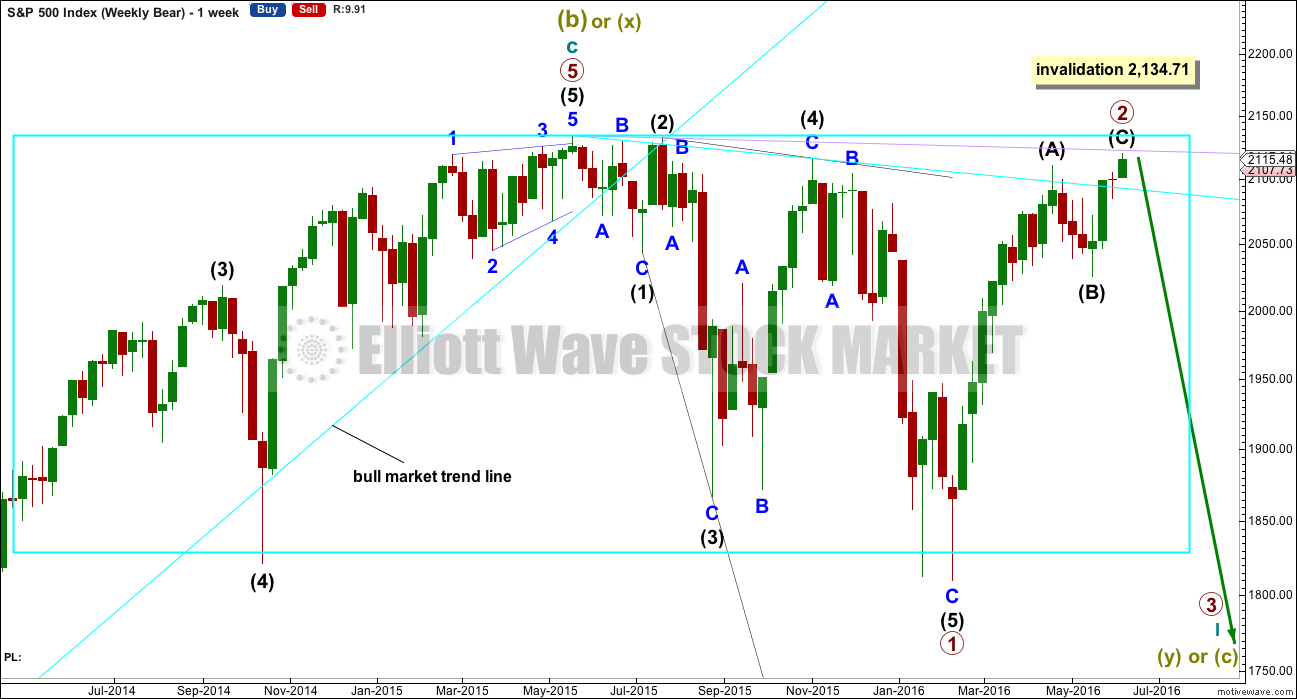
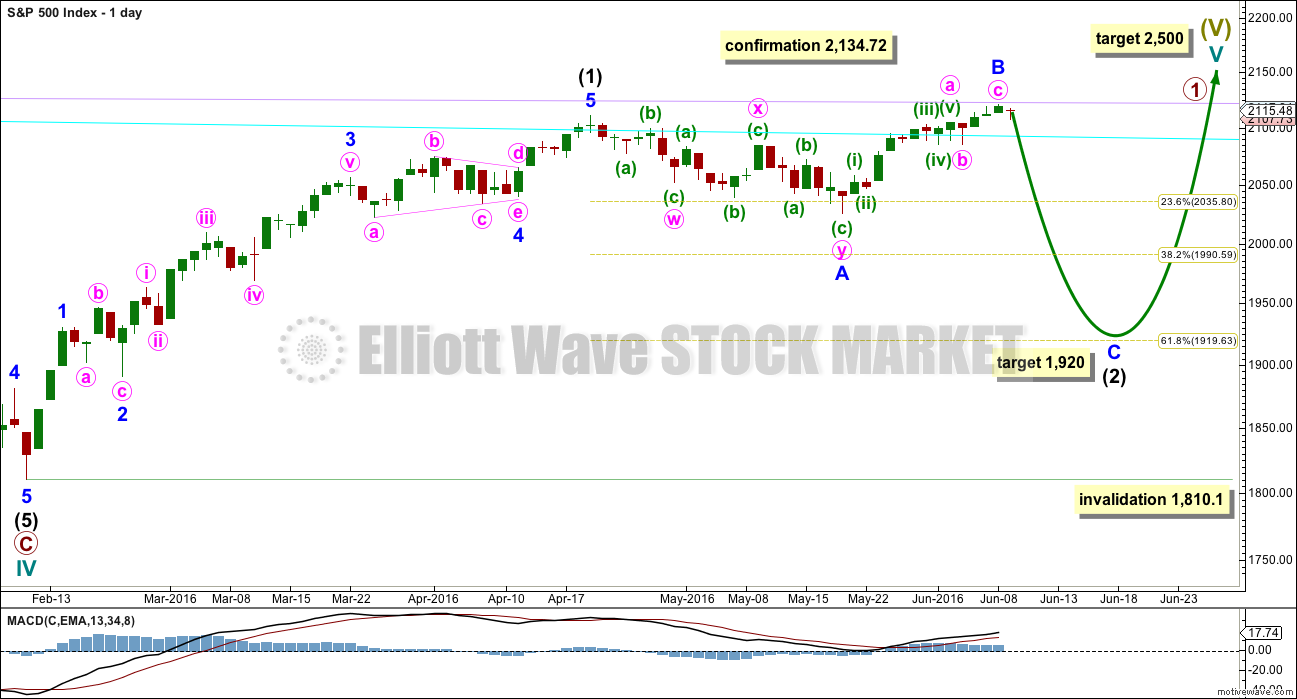
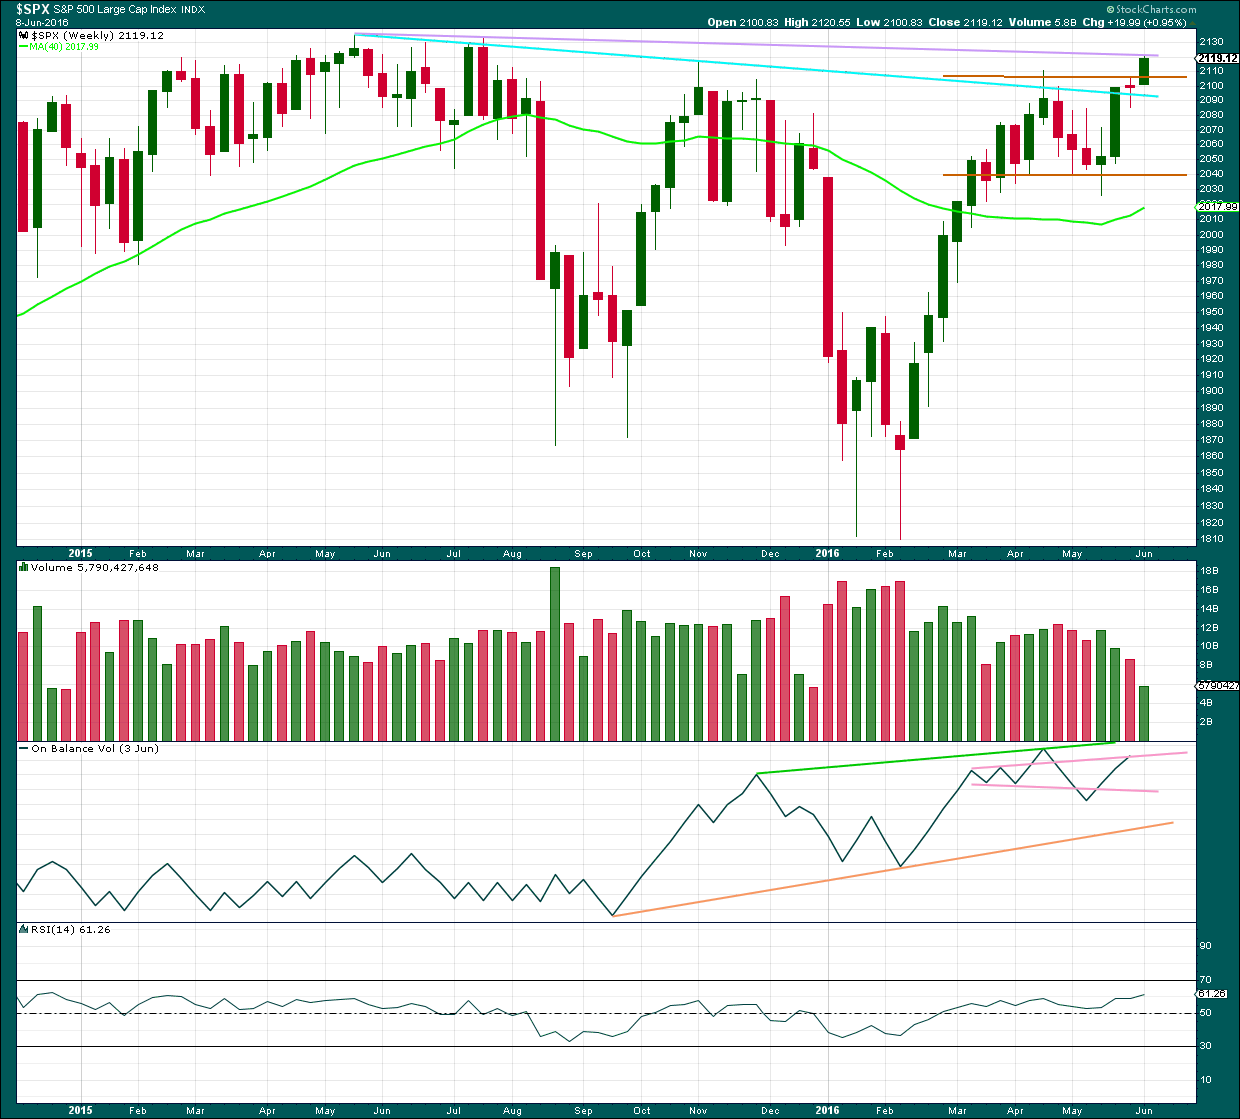
The box is added to the weekly chart. Price has been range bound for months. A breakout will eventually happen. The S&P often forms slow rounding tops, and this looks like what is happening here at a monthly / weekly time frame.
Primary wave 1 is seen as complete as a leading expanding diagonal. Primary wave 2 would be expected to be complete here or very soon indeed.
Leading diagonals are not rare, but they are not very common either. Leading diagonals are more often contracting than expanding. This wave count does not rely on a rare structure, but leading expanding diagonals are not common structures either.
Leading diagonals require sub waves 2 and 4 to be zigzags. Sub waves 1, 3 and 5 are most commonly zigzags but sometimes may appear to be impulses. In this case all subdivisions fit perfectly as zigzags and look like threes on the weekly and daily charts. There are no truncations and no rare structures in this wave count.
The fourth wave must overlap first wave price territory within a diagonal. It may not move beyond the end of the second wave.
Leading diagonals in first wave positions are often followed by very deep second wave corrections. Primary wave 2 would be the most common structure for a second wave, a zigzag, and fits the description of very deep. It may not move beyond the start of primary wave 1 above 2,134.72.
So far it looks like price is finding resistance at the lilac trend line. Price has not managed to break above it for the last three days.
DAILY CHART
Click chart to enlarge.
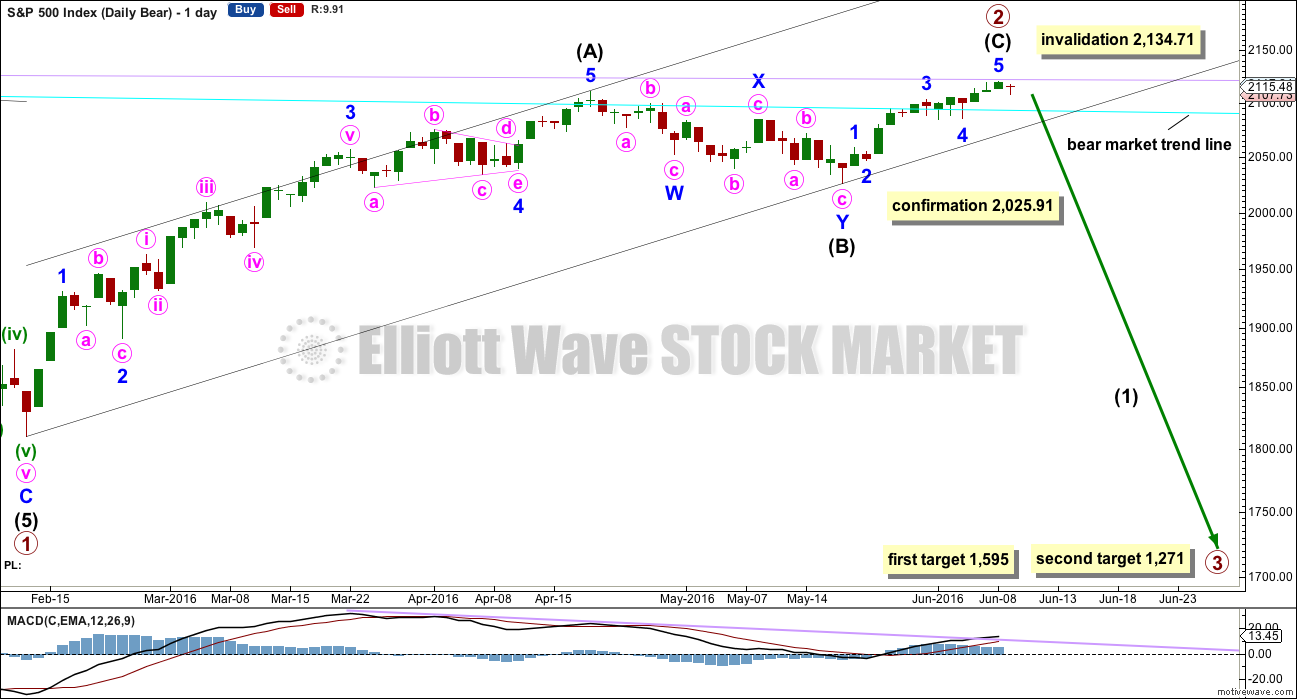
So far primary wave 2 would be a 0.96 correction of primary wave 1. Second wave corrections following first wave leading diagonals are commonly very deep, so this fits the most common pattern if primary wave 1 was a leading diagonal.
The most common structure for a second wave correction is a zigzag.
There is still no Fibonacci ratio between intermediate waves (A) and (C).
Intermediate wave (C) must be a five wave structure. It may be either an impulse or an ending diagonal. It would be unfolding as an impulse, not a diagonal. The structure may be complete, but as yet there is no evidence of a trend change.
If intermediate wave (C) was over yesterday, then it would have lasted a Fibonacci thirteen days. Intermediate wave (B) lasted a Fibonacci twenty-one days and intermediate wave (A) lasted forty seven days (not a Fibonacci number). Primary wave 2 would have lasted eighty one days (also not a Fibonacci number). If primary wave 3 exhibits a Fibonacci duration, then a reasonable estimate would be a Fibonacci 144 days.
Draw a channel about primary wave 2 using Elliott’s technique for a correction: the first trend line from the start of the zigzag, then a parallel copy on the end of intermediate wave (A). When this channel is breached by downwards movement it would be indicating a possible trend change. A new low below 2,025.91 would provide price confirmation of a trend change. At that stage, downwards movement could not be a second wave correction within intermediate wave (C) and so intermediate wave (C) would have to be over.
The targets calculated are provisional only because at the end of this session there is still no confirmation of a trend change. They come with the caveat that price may yet move higher which means the targets would move correspondingly higher. They also come with the caveat that at this very early stage a target for primary wave 3 may only be calculated at primary degree. When intermediate waves (1) through to (4) within primary wave 3 are complete, then the targets may change as they can be calculated at more than one wave degree. Primary wave 3 may not exhibit a Fibonacci ratio to primary wave 1.
The first target at 1,595 is where primary wave 3 would reach 1.618 the length of primary wave 1. This target would most likely not be low enough because primary wave 2 is very deep at 0.96 the length of primary wave 1. Primary wave 3 must move below the end of primary wave 1, and it must move far enough below to allow subsequent room for primary wave 4 to unfold and remain below primary wave 1 price territory. Normally, there is a gap between first wave and fourth wave price territory, particularly in a bear market.
The next target may be more likely. At 1,271 primary wave 3 would reach 2.618 the length of primary wave 1.
If primary wave 3 does not exhibit a Fibonacci ratio to primary wave 1, then neither of these targets would be correct.
Well before these targets, it should be obvious if the next wave down is a primary degree third wave. It should exhibit increasing ATR, strong momentum, and a steep slope. However, please note that although it may begin very strongly it does not have to. It may also be that intermediate wave (1) maintains an ATR about 20 – 30 and has some deep time consuming corrections within it. That was how the last primary degree third wave began within the last bear market, so it may happen again.
HOURLY CHART
Click chart to enlarge.
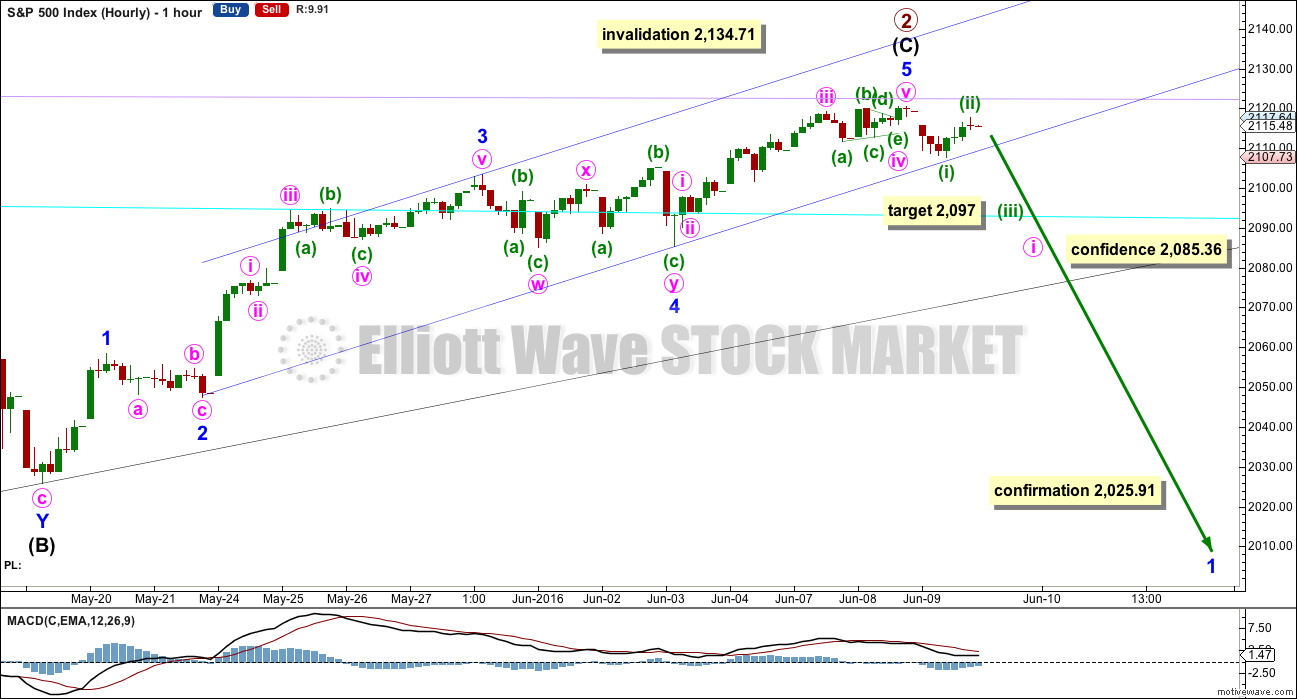
The hourly chart shows the whole structure of intermediate wave (C). This upwards movement is seen as a five wave impulse.
A five wave impulse upwards from the low labelled intermediate wave (B) on 19th of May may now be complete, but the fifth wave may also continue higher.
This wave count at the hourly chart level agrees with MACD. The strongest piece of movement is the third wave. The fifth wave exhibits weaker momentum and divergence with MACD.
Minor wave 3 is 3.05 points longer than 1.618 the length of minor wave 1. If minor wave 5 is over, then it would be 2.6 points longer than equality in length with minor wave 1.
Ratios now within minor wave 5 are: there is no Fibonacci ratio between minute waves i and iii, and minute wave v is just 0.05 points short of 0.382 the length of minute wave i. There is perfect alternation between the shallow 0.34 zigzag of minute wave ii and the very shallow 0.13 triangle of minute wave iv.
The very earliest indication of a trend change may come tomorrow, if price can manage to break below the small blue trend channel which contains intermediate wave (C). This would be a relatively weak and unreliable indication though. The wider black channel would provide better indication. Price has bounced off the lower edge of this blue channel at the end of this session, so it is still providing some support. The gap at the open should provide resistance if a high is in place. At 2,097 minuette wave (iii) would reach 1.618 the length of minuette wave (i).
Minuette wave (ii) may not move beyond the start of minuette wave (i) above 2,120.40. A new high above this point obviously would indicate intermediate wave (C) is not over. If that happens, then a target for it to end may be very close indeed to the invalidation point where minor wave 5 would be close to 1.618 the length of minor wave 1. Primary wave 2 can touch the start of primary wave 1, so that it is a 100% correction, but it may not move beyond the start of primary wave 1. The invalidation point is black and white. Any breach by any amount at any time frame would invalidate the bear wave count completely (Note: This applies to this cash market and not futures which may have a slightly different price point for the ATH, so a slightly different invalidation point).
The first reasonable indication of a potential trend change would come with a breach of the blue channel containing intermediate wave (C). Along the way down, expect to see some support, and a bounce, at the cyan bear market trend line.
A new low below 2,085.36 could not be a second wave correction within minor wave 5, so at that stage minor wave 5 would have to be over. This price point needs only to be passed by any amount at any time frame.
Thereafter, the same rule is used for the confirmation point at 2,025.91. A new low by any amount at any time frame below this point could not be a second wave correction within intermediate wave (C), so at that stage intermediate wave (C) would have to be over.
To the upside, price may find resistance at the lilac trend line now. It looks like today this line held the rise in price to only another 2 points.
BULL ELLIOTT WAVE COUNT
WEEKLY CHART
Click chart to enlarge.
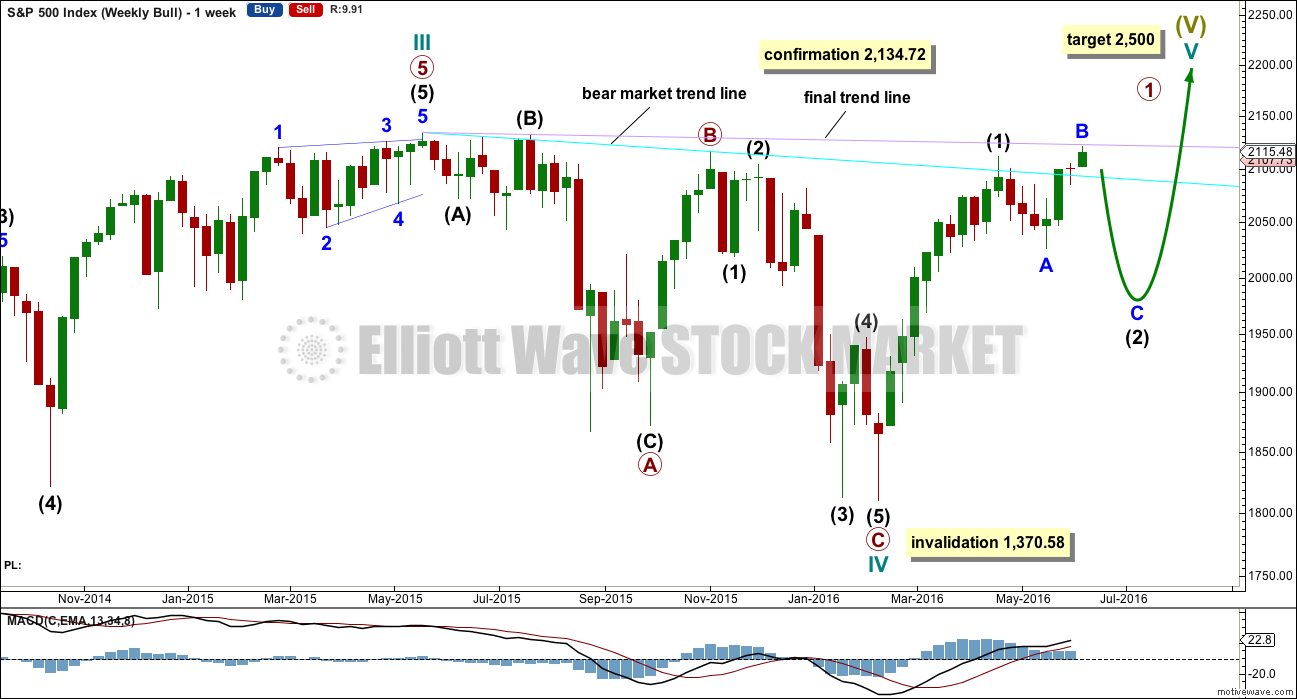
Cycle wave IV is seen as a complete flat correction. Within cycle wave IV, primary wave C is still seen as a five wave impulse.
Intermediate wave (3) has a strong three wave look to it on the weekly and daily charts. For the S&P, a large wave like this one at intermediate degree should look like an impulse at higher time frames. The three wave look substantially reduces the probability of this wave count. Subdivisions have been checked on the hourly chart, which will fit.
Cycle wave II was a shallow 0.41 zigzag lasting three months. Cycle wave IV may be a complete shallow 0.19 regular flat correction, exhibiting some alternation with cycle wave II and lasting nine months. Cycle wave IV would be grossly disproportionate to cycle wave II, and would have to move substantially out of a trend channel on the monthly chart, for it to continue further sideways as a double flat, triangle or combination. For this reason, although it is possible, it looks less likely that cycle wave IV would continue further. It should be over at the low as labelled.
At 2,500 cycle wave V would reach equality in length with cycle wave I.
Price has now broken a little above the bear market trend line. This line is drawn from the all time high at 2,134.72 to the swing high labelled primary wave B at 2,116.48 on November 2015. This line is drawn using the approach outlined by Magee in the classic “Technical Analysis of Stock Trends”. To use it correctly we should assume that a bear market remains intact until this line is breached by a close of 3% or more of market value. Now that the line is breached, the price point at which it is breached is calculated about 2,093.58. 3% of market value above this line would be 2,156.38, which would be above the all time high and the confirmation point.
This wave count requires price confirmation with a new all time high above 2,134.72.
While price has not made a new high, while it remains below the final trend line (lilac) and while technical indicators point to weakness in upwards movement, this very bullish wave count comes with a strong caveat. I still do not have confidence in it. It is produced as an alternate, because all possibilities must be considered. Price managed to keep making new highs for years on light and declining volume, so it is possible that this pattern may continue to new all time highs for cycle wave V.
The invalidation point will remain on the weekly chart at 1,370.58. Cycle wave IV may not move into cycle wave I price territory.
This invalidation point allows for the possibility that cycle wave IV may not be complete and may continue sideways for another one to two years as a double flat or double combination. Because both double flats and double combinations are both sideways movements, a new low substantially below the end of primary wave C at 1,810.10 should see this wave count discarded on the basis of a very low probability long before price makes a new low below 1,370.58.
DAILY CHART
Click chart to enlarge.
Intermediate wave (2) may still be an incomplete flat correction. Minor wave A will subdivide as a three, a double zigzag, and minor wave B may be seen as a single zigzag.
The most likely point for intermediate wave (2) to end would be the 0.618 Fibonacci ratio at 1,920.
Intermediate wave (2) may not move beyond the start of intermediate wave (1) below 1,810.10.
While it is possible that intermediate wave (2) may be a complete double zigzag at the low labelled minor wave A, this would be a very shallow and rather quick second wave correction. The first reasonable second wave correction within a new bull market should be expected to be deeper and more time consuming for this bull wave count, so intermediate wave (2) is expected to continue.
TECHNICAL ANALYSIS
WEEKLY CHART
Click chart to enlarge. Chart courtesy of StockCharts.com.
Price is the final determinator and the most important aspect of market analysis. So what has price been doing since the all time high in May 2015?
Price has made an important new high above the prior major high of November 2015. Price is now finding resistance at the lilac line. It can no longer be said that price is making lower highs and lower lows because it no longer has a lower high. This is the most bullish indication from price for many months. This supports the bull wave count over the bear.
Last week completes a small doji pattern with lighter volume. This represents a balance between bulls and bears for the week and indecision. The long lower wick is slightly bullish while the red colour is slightly bearish.
Further comment on On Balance Volume will be suspended at the weekly chart level until the current week is over and OBV is updated for the week. Because price has made a new high above the prior swing high of April 2016, OBV should also make a new high at the end of this week.
Volume is declining while price has essentially moved sideways for the last ten weeks in a zone delineated by brown trend lines. The longer price meanders sideways the closer a breakout will be. During this sideways range, it is a downwards week which has strongest volume suggesting a downwards breakout may be more likely. However, price is breaking out upwards. This breakout should come with an increase in volume for it to be reliable (as opposed to potentially a false breakout). That cannot yet be determined because the week is not yet complete.
The strong green candlestick two weeks ago the most bullish signal for some time. With this now followed by a doji, some of this bullishness is dissipated.
The 40 week moving average has turned upwards, another bullish signal. However, this has happened before in October 2015 yet it was followed by a strong downwards wave. On its own this bullish signal does not necessarily mean price is going to make new all time highs.
DAILY CHART
Click chart to enlarge. Chart courtesy of StockCharts.com.
Volume data on StockCharts is different to that given from NYSE, the home of this index. Comments on volume will be based on NYSE volume data when it differs from StockCharts.
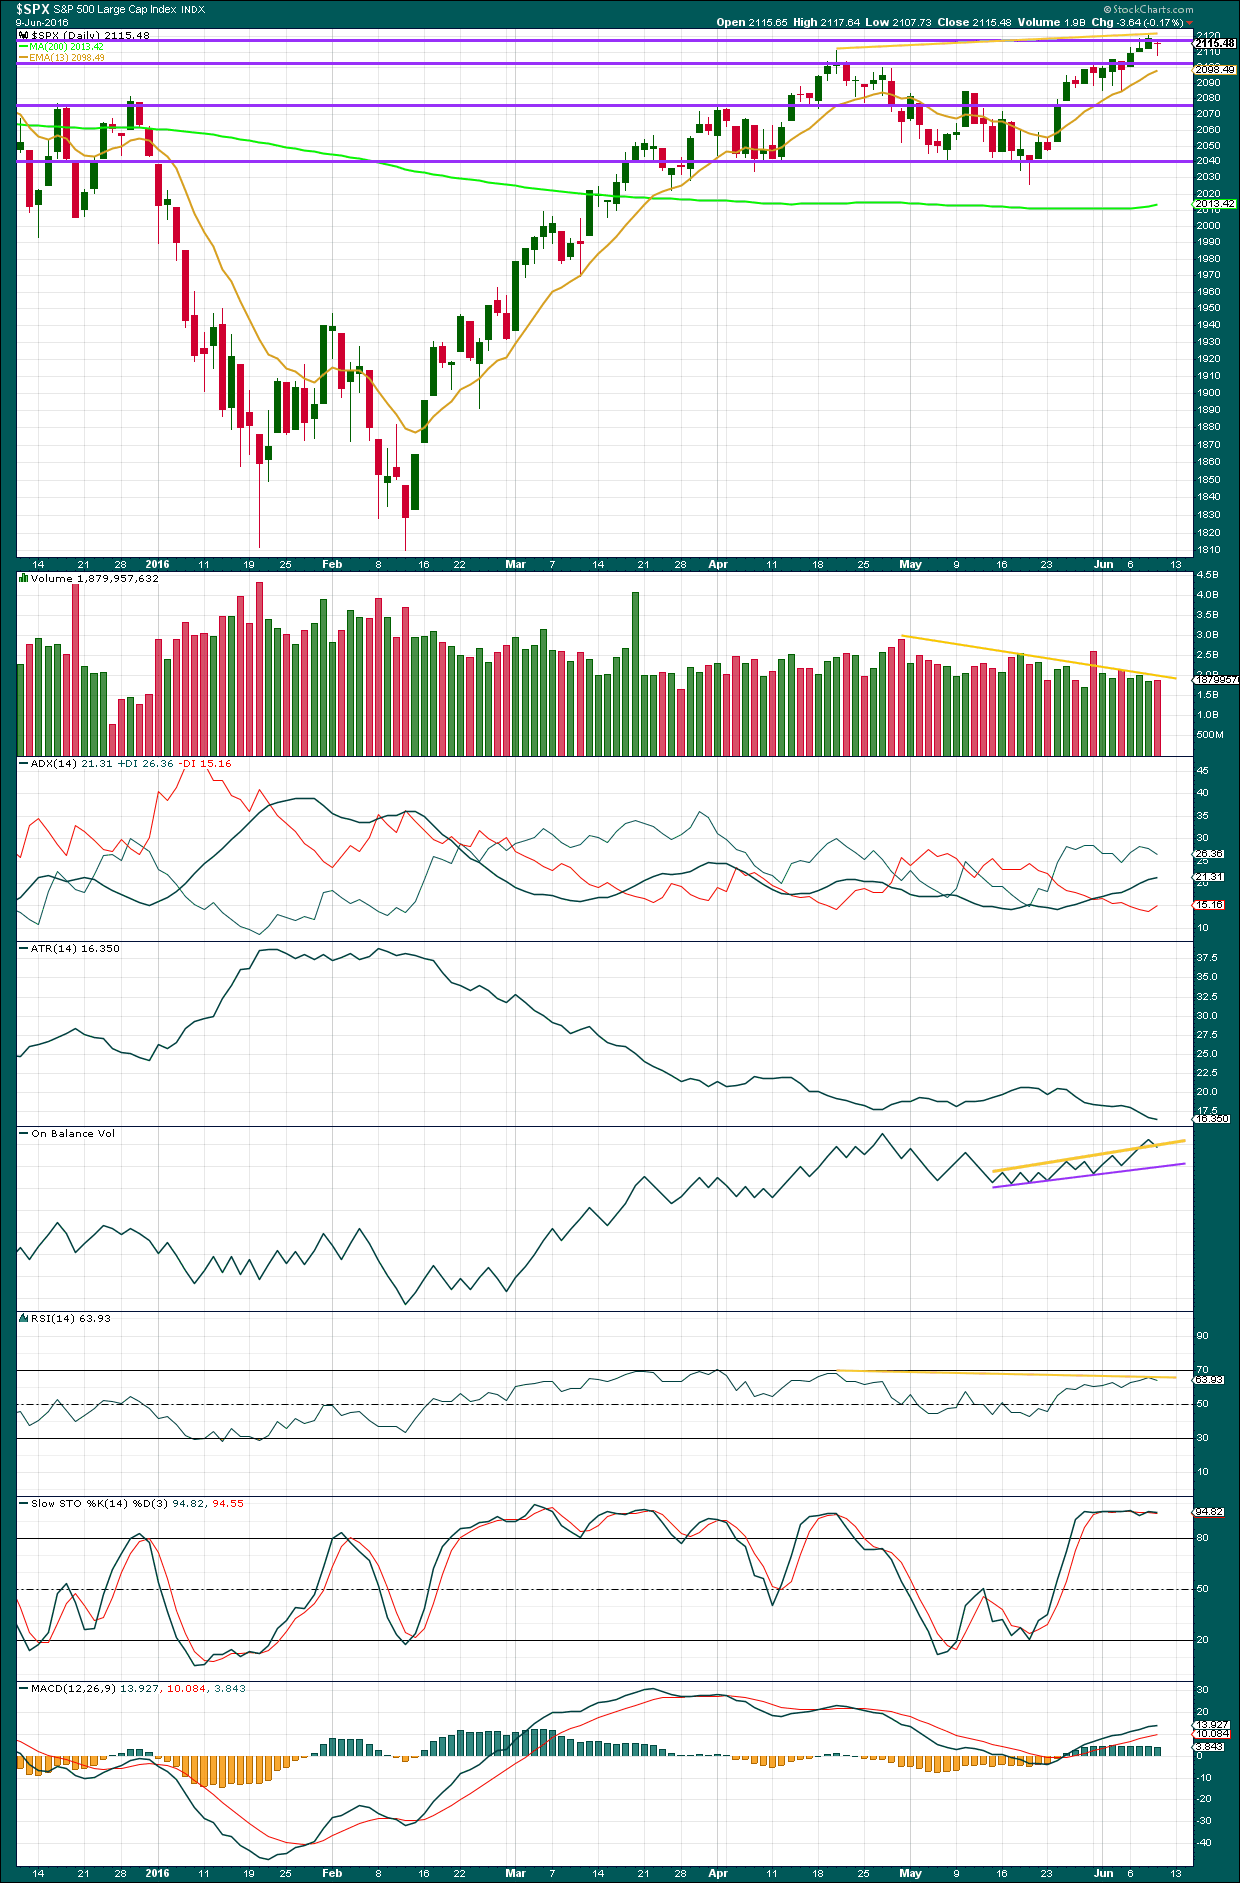
A slight rise in volume for a red daily candlestick offers some small support for the overall fall in price today. The doji candlestick indicates a balance between bulls and bears, so indecision. Price is finding resistance about 2,115.
Overall, price comes on a decline in volume as it moved higher for 14 days from the last swing low, with the exception of one strong downwards day. The rise in price is not supported by volume, so it is suspicious.
However, this does not indicate when and where price may turn and only indicates weakness. Rising price on declining volume is normally corrective, but like divergence can be sustained for reasonable periods of time. The weakness indicates it is very likely to be more than fully retraced.
ADX still indicates an upwards trend is in place. ATR still disagrees: price comes with declining range while price rises. The bulls look exhausted. Daily, the range they are able to push price up in reduces. This is not normal and is further indication that this trend looks to be unsustainable.
On Balance Volume gave a weak bullish signal with a break above the yellow line and now it may be giving a weak bearish signal with a return back below that line. A break below the purple line would be a stronger bearish signal.
There is still regular bearish divergence between price and OBV between the high dated 27th of April and this new high for yesterday. Price has made a new high but OBV has made a lower high. This indicates weakness in price.
There is still also regular bearish divergence between price and RSI from the high of 20th of April. Price has made a higher high but RSI has made a lower high. This is further indication of weakness in price. Divergence between RSI and price is usually a reliable indicator of a trend change, but it will not pinpoint when and where price will turn. It only indicates weakness which is usually followed by a trend change.
Stochastics has been flat for several days, but divergence between price and Stochastics is not very reliable.
VOLATILITY – INVERTED VIX MONTHLY CHART
Click chart to enlarge. Chart courtesy of StockCharts.com.
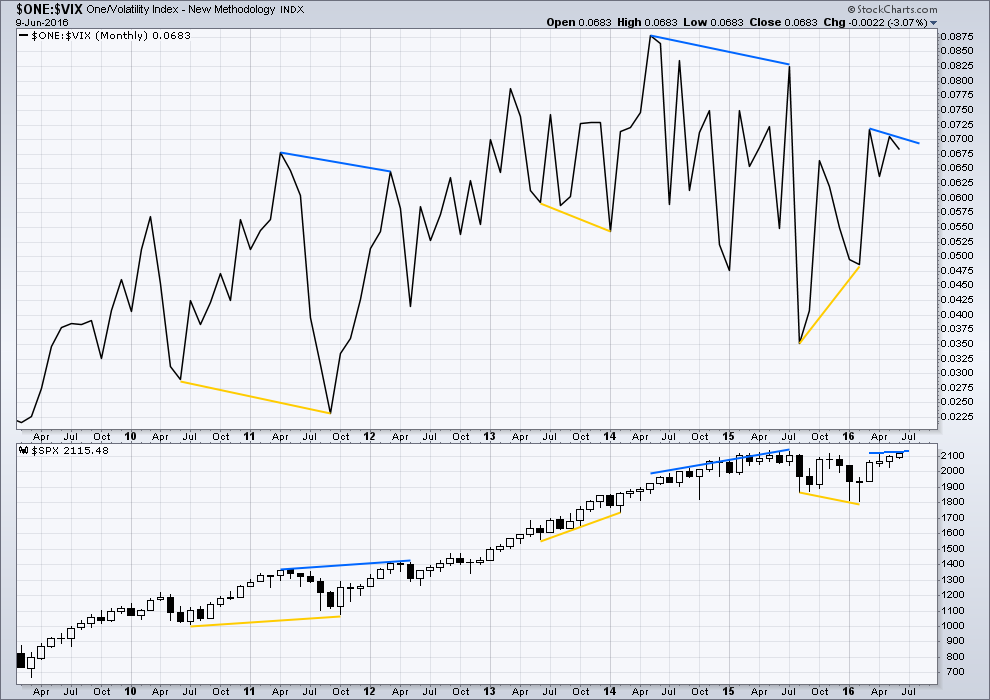
Several instances of large divergence between price and VIX (inverted) are noted here. Blue is bearish divergence and yellow is bullish divergence (rather than red and green, for our colour blind members).
Volatility declines as inverted VIX rises, which is normal for a bull market. Volatility increases as inverted VIX declines, which is normal for a bear market. Each time there is strong multi month divergence between price and VIX, it was followed by a strong movement from price: bearish divergence was followed by a fall in price and bullish divergence was followed by a rise in price.
There is still current multi month divergence between price and VIX: from the high in April 2016 price has made new highs in the last few days but VIX has failed so far to follow with new highs. This regular bearish divergence still indicates weakness in price.
VOLATILITY – INVERTED VIX DAILY CHART
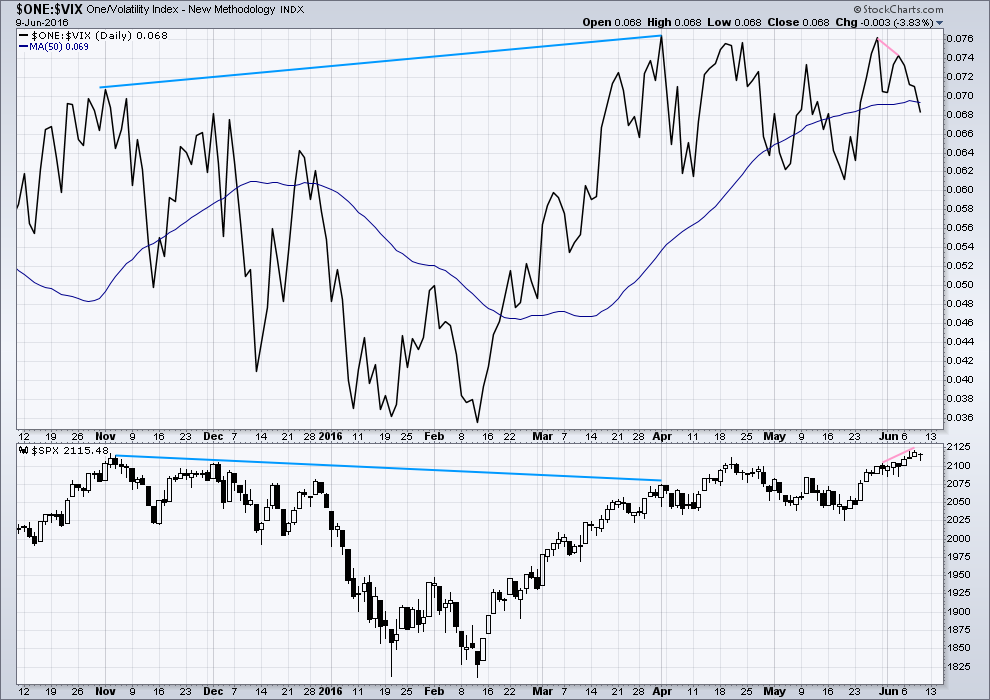
Click chart to enlarge. Chart courtesy of StockCharts.com.
There is now only one instance of hidden bearish divergence noted on this daily chart of price and VIX (blue lines). VIX makes higher highs as price makes lower highs. The decline in volatility is not matched by a corresponding rise in price. Price is weak.
There is also very short term regular bearish divergence (pink lines). VIX did not make a corresponding new high as price made a new high two days ago. This indicates exhaustion for bulls and underlying weakness in price.
Price moved higher for three days in a row (6th, 7th and 8th of June) completing green daily candlesticks yet VIX moved lower. This short term divergence between price and VIX is unusual. It indicates further exhaustion from bulls. This trend in price is weak, especially for the last three days up to the last high.
VIX today has made a new low below the prior low of 1st June, yet price has not made a corresponding low. This contradicts other signals from VIX. The picture with VIX today is not as clear as it was yesterday.
While I would not give much weight to divergence between price and many oscillators, such as Stochastics, I will give weight to divergence between price and VIX. Analysis of the monthly chart for the last year and a half shows it to be fairly reliable.
BREADTH – ADVANCE DECLINE LINE
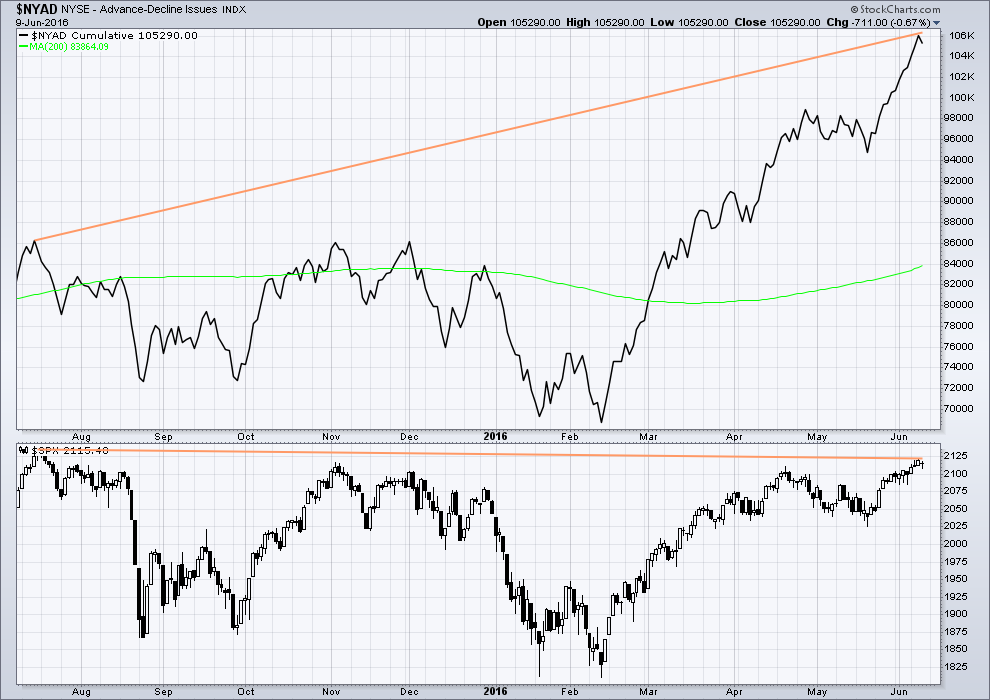
Click chart to enlarge. Chart courtesy of StockCharts.com.
With the AD line increasing, this indicates the number of advancing stocks exceeds the number of declining stocks. This indicates that there is breadth to prior upwards movement.
Taking a look at the bigger picture back to and including the all time high on May 2015, the AD line is making substantial new highs but price so far has not. While market breadth is increasing beyond the point it was at in May 2015, this has not translated (yet) into a corresponding rise in price. Price is weak. This is hidden bearish divergence.
It is also noted that the AD line diverged for the four months prior to the all time high; this was regular bearish divergence (first set of shorter blue lines).
DOW THEORY
The last major lows within the bull market are noted below. Both the industrials and transportation indicies have closed below these price points on a daily closing basis; original Dow Theory has confirmed a bear market. By adding in the S&P500 and Nasdaq a modified Dow Theory has not confirmed a new bear market.
Within the new bear market, major highs are noted. For original Dow Theory to confirm the end of the current bear market and the start of a new bull market, the transportation index needs to confirm. It has not done so yet.
Major lows within the prior bull market:
DJIA: 15,855.12 (15th October, 2014) – closed below on 25th August, 2015.
DJT: 7,700.49 (12th October, 2014) – closed below on 24th August, 2015.
S&P500: 1,821.61 (15th October, 2014) – has not closed below this point yet.
Nasdaq: 4,117.84 (15th October, 2014) – has not closed below this point yet.
Major highs within the new bear market:
DJIA: 17,977.85 (4th November, 2015) – closed above on 18th April, 2016.
DJT: 8,358.20 (20th November, 2015) – has not closed above this point yet.
S&P500: 2,116.48 (3rd Nobember, 2015) – has now closed above this point on 8th June, 2016.
Nasdaq: 5,176.77 (2nd December, 2015) – has not closed above this point yet.
It is a reasonable conclusion that the indices are currently in a bear market. The trend remains the same until proven otherwise. Dow Theory is one of the oldest and simplest of all technical analysis methods. It is often accused of being late because it requires huge price movements to confirm a change from bull to bear. In this instance, it is interesting that so many analysts remain bullish while Dow Theory has confirmed a bear market. It is my personal opinion that Dow Theory should not be accused of being late as it seems to be ignored when it does not give the conclusion so many analysts want to see.
This analysis is published @ 08:45 p.m. EST.
For point of reference here is what open interest for SPY for quarterly options expiring 6/30 is suggesting SPX levels could go. See the green (Call) and red (Put) dashed lines to the right.
Assuming the bear count is correct and we are at the beginning of a large decline over the next several months, I was just looking at the bigger picture on volatility to determine what some reasonable targets might be.
During the big sharp decline in August 2015, VIX increased from the 12-14 range up to about 50 at the peak, roughly a 4x increase. During that move UVXY increased from around 25 up to about 90, a 3.6x increase.
With UVXY recently bottoming around 10, if that is our launching point I’m estimating we could see a move up to the 35-40 area at some point, assuming this is the beginning of a large decline on the order of the August move.
Looking farther back to the 2008-2009 decline, I see that VIX topped around 90 back then, so maybe UVXY could move as high 60-70 if that were to happen again!
Of course it’s too early to get too far ahead of myself with this bigger picture stuff, but it’s too much fun not to look ahead at what might happen. Good luck everyone.
UVXY is a non-linear animal. The level it is trading at right now is a conundrum – a victim of extremely aggressive short sellers who until now have always been right in assuming that it would go lower, and the market would continue to new highs. Your trading ranges may be too conservative considering the kind of short covering that is going to have to happen when folk realize what is unfolding to the downside…just my two pence…
In addition to being a geometric instrument that sees accelerating decline in a bull trend, the opposite will be true in a sustained bear market. This does not even consider the level of raw fear that would be anticipated in a primary three decline at super cycle degree. We should see levels of fear during this decline that are historic and therefore historic levels in the VIX. How this translates into the way this futures derivative trades is anyone’s guess; my own is that it should also reach historic levels…in fact I predict they will halt trading on most leveraged products when market fear reaches its zenith- if they don’t they are going to bankrupt the issuers. I still cannot believe you can actually buy call options on UVXY at this ridiculous price, at this stage in the market cycle! My advice to anyone trading them is to take profits early and often…
Think they are going to try and extend this micro w(4) until close. 2085 below is big.
Move one degree lower in wave action down. This should be minute w(1)
Looks like they are throwing in the towel. Just had a small covering gap. Smart! 😀
The next guys to start sweating bullets at the 14.50 pivot. They will probably get a reprieve until minute two is done. Have a G-R-E-E-A-A-A-T weekend everyone!
I’m a happy camper this morning 🙂
I don’t like to be in and out… I think I have a good entry now at 2,117 so I’ll sit tight on that.
I’ll move my stop to breakeven, and look to add to my position on each bounce.
I have minuette (iii) over at 2,096.66, close to 1.618 X minuette (i). Now minuette (v) completing an impulse.
A five down is now either over here or very soon it could be. Which means it should be followed by a three up.
Where will that three up end? My first guess would be the lower edge of the blue channel as support turns into resistance. That would be a scary deep second wave. Offering a beautiful low risk entry to join the trend, if you have the stomach for it that is.
Yes Ma’am! The deeper the bedda! 🙂
A lot of times the market likes to pick up where it left off Friday…. Could this still be part of 3 down?
Yeah, it could be.
I’m going to label minuette (iii) as over though for three reasons:
1. It has strongest momentum, a sheer drop.
2. It is very close to 1.618 X minuette (i)
3. MACD on the five minute chart is declining, minuette (v) is weaker, so I think minuette (iii) is over
it also looks right on the hourly chart
Yep…got out of some short term puts….thanks….now really want to nail this next move down….we already have a fib 23.6 % of 1 down….maybe we get a bounce Monday at the open? 2101/2 for 38%….2108 for 61.8 %
I am guessing at 2115ish based on looking at Open Interest for SPY for 6/17.
Guess the series of 1,2’s more likely….
Yep, I’d label it like that too.
So the fifth wave is extending… which means the first five down should take today’s price lower into the close
No fade up to end the session today! Yay!
(if that is right anyway)
If it means anything,, I noticed max pain is at 207 for next weeks SPY expiration
They keep stomping on UVXY trying to get it under 12 and folk keep buying the dip. If they are smart it should pop past 12.20 prior to the close….don’t these folk recognize a new uptrend when they see one?!
Position trader:
. . . you strength will be in keeping calm and showing trust.
Isa 30:15
He! He! A few stalwart souls are trying to protect their 12.20 shorts by piling on at 12.00. Huyk! Hyuk!
Can they push it back below 12.00?
If they do, I’m reloading… 🙂
If you got the stomach for it, you can probably grab a quick 30% from these hapless folk…
Yep! Somebody piled in at 11.96…never had a chance! 🙂
To me it still looks like minuette 3 is extending and will go into Monday and maybe we are in some type of corrective 4 right now for 30-45 min. Obviously a sell-off into the close would be a welcome change of character for the market.
I made an extremely emotional trade yesterday and purchased 40 ES 2075 puts @ 2.40 that expire next week. This is on top of my 2099 ES short position…so I was underwater at the time I made the trade. Those puts are at 8.00 now (I’ve taken half off) and I pray I realize how lucky it was. Still a long way to go before we can declare victory.
Nice trade Corey!!
Sounds to me like it was a conviction trade Corey; there is a difference and I have made both kinds…. 🙂
Yipee! The Unicorn conquers 12.00. Now let’s see if it can be held. I would cordially invite all the short sellers at 12.20 to go into the week-end with their hinys exposed…
Raising cash from short term trades for UVXY trade over 12.20…
VIX poking thorough upper BB. No wick though so that baby needs to EXPAND! 🙂
A Flag on the 5 minute chart…usually means we continue our move when we come out.
Which in this case, should be down 😀
I would be the happiest man on the planet to see 12.20 UVXY today….PUHLEEEEEZE! 🙂
Looks like it’s flying another bull flag so we may hit that critical 12.00 level before the close. That is pretty important I think to properly gauge mid-term sentiment…
UVXY crossed over 12. Strange to sell green on my UVXY positions 🙂
I take it you meant “see” green? Not that there is anything wrong with “selling” green on your UVXY positions…I do it frequently myself…nothing strange at all! 🙂 🙂 🙂
what planet u from Verne? ORK ,like Mork?
Verne sleeps upside down like this
You forgot the rope suspending me from the rafters dude! 🙂 🙂 🙂
Acutally it’s Perelandra…! 🙂
I knew it,, a venusian in disguise
You got me! 🙂
On the matter of that 2100 pivot, looks like the bulls being told to go take a hike.
Now, for that matter of UVXY 12.00, show me what yer got… 🙂
I’m just a bit puzzled by the relatively low volume today. The selling pressure is really not that intense and the market is just falling under its own weight it appears.That is the only cautionary note I can see atm…
ATM Volume is higher than yesterday at this same time of day.
I’m ok with the lower volume at this point, as buyers leave the market, sellers can take over and then once panic and fear sets in we should see volume step it up…that’s the way I see it 🙂
Good point. I have the feeling that the serious bears have been patiently watching the bulls wear themselves out. As somebody said, based on Europe you would thing we would be off at least 20 or 30 points in SPX…
The bulls seem to be fighting tooth and claw to hold on to SPX 2100…
I thought we were going to slice through 2100 “like Butta” 🙂
Frankly David, I really hate it when we do not slice through 2100 like “Buddha”… 🙁
My inviolable rule for third waves down – “no wrangling around pivots…period!”
Haha – definitely some wrangling going on!
2100 is the most popular hangout spot. 🙂
Do any of our very capable chartists have a tentative wave count?
1 min chart. There are a few alternates atm – wave (iii) could also be extending.
Agreed. Thank you, Olga!
Thanks Olga.
ABC down is counted in exactly the same way. Taking out 2085 low dramatically reduces that probability as pointed out earlier by Gary.
If (iii) is extending, (iii) = 2.618 * (i) @ 2084
Hi Olga…
Wassup Doc 🙂
Looks like some sort of complex 4th atm. Probably a triangle?. Something really wants me to see the movement down from recent high as a series of 1,2’s.. I’m looking at that…
5 wave move up now to above Wave (i) low @ +2107.77 would likely be another second wave ((c) of an expanded flat). (b) down of expanded flat might still be in progress. +ve RSI div atm.
One of a boat load of options atm.
Holding support at Lara’s Bear Market trendline….must lose 2085 to eliminate an extension of minor w(5).
Thanks Gary. I posted just before I saw this…
Europe on average closed down 2.50% today across the board.
LIKE!
VIX BB band starting to expand. The absence of a long upper wick suggests the move down today is not terminal but just getting started. I would expect the upper BB to expand to contain the price action as this wave down develops. Looking for a penetration to to the upside to signal an approaching interim bottom….
-30yr T-bonds turned down Monday at 2:20pm
-US Dollar turned up Wednesday at 10:10am
-Stock indexes topped Wednesday at 2:05pm
all CST time
and yes I meant the bond yields went down on the chart, T-bonds inversely went up.
Some rumours starting to circulate about the solvency of the Treasury which is strange since they have the unlimited printing resources of the FED. Apparently in quite a few states EBT cards issued to food stamps recipients have not been loaded for the month of June. Under Obama’s stewardship of the economy the number of people receiving this type of assistance has literally doubled from around 28 mil to almost 50 mil. This is also the first administration in history to not have a single year of GDP growth exceeding 3%…
anyone else seeing time and sales on the ES? LOL…looks like someone’s algo is falling apart.
The algos are definitely a market wild card…
There you have it folks. All you need to know about what’s coming is being shouted at you by VIX and UVXY in unison…
break down already…sheez!
2105 if 38% retrace. 2108 is 50%.
If, if, if… we are still in minuette wave 3 and it extends today, then we are in a 2nd wave correction and the biggest move is yet to come. At 2108 we’d definitely be in a 1-2, 1-2 scenario.
I’m watching this zig zag up very closely for a chance to pounce.
The start of any third wave down is going to see a sharp jump in VIX to new highs today and UVXY will really pop…
ZZ up for minute two….
So if we are to see Deflation, would that translate to a big move up in the US dollar?
Yep. Trillions in dollar denominated debt is going up in smoke, making USD much more scarce, at least in the medium term….monstrous inflation will eventually follow as they turn on the printing presses 24/7 in a futile attempt to paper over the losses…
No way am I getting those calls for half a buck. They have already started to creep back toward a dollar…Oh Well…the MMs are onto me I’m afraid…maybe a smaller order would do it?! 🙂
We take out SPX 2096.58 and you stick a fork in the bulls ‘cuz they’re done!
over 2,100 again and suspect we close near unchanged line again into the weekend. No fear and massive support from hidden hand otherwise we should have seen close to 300 points down on DJIA.. Russell moving up….
I don’t think so. We are at the point of no-return. Either we head North and print a green candle today or we take out this morning’s lows in minute three down….
You are absolutely right about the 2100 pivot. The bearish count demands its unconditional surrender today…..
Unless you are a position trader and have nerves of steel, it is really smart to scoop profits off the table as these impulses down complete intra-day as they have been doing for the last several weeks. This pattern has been quite predictable and you can always re-load on the bounce once the down-trend is confirmed imho…
bid on UVXY calls at 0.85….getting closer…
At just about 38% re-tracement now…
…..expanded flat for wave 4 just completed?
added to my short…full tilt now.
Correction up underway. I have activated a ton of “stink bids” (next week’s 11 strike calls at 0.50 per contract) on UVXY on this move up, I think it is going to be a second wave correction….where are the UVXY short sellers when you really need ’em??!! 🙂
I think minute one down complete. Unless we get a very fat green candle in a hurry it’s going to get ugly for the bulls…..
It’s going to get ugly….!
That could also have been minuette four of minute one. Maybe now the real telling bounce…here we go…
I dunno, VIX still saying…”Eat My Dust” 🙂
heck, we’re not even down 1%…yet. I sure would love to see a 2+% down day today.
2.437% Yield on 30 Year Treasury right now. Stocks decline slow & calm.
This is NOT a safe haven trade pushing 30 Year Treasury’s to this level.
The BIG R…. is here! So is the BIG D….! No way out of this now! That’s what a sub 2.50% 30 Year Treasury is signaling! Bond Guys are and always have been the super smart money!
Yep! Yep! Yep! That is why they call ’em “Bond Vigilantes”!
Big R?
Big D?
I am not familiar.
I think it means Recession/Depression
Partly right…. 1st part is correct.
Deflation?
Yep
UVXY shorts at 12.20 probably breathing a sigh of relief at the current pause…I would not start celebrating just yet if I were sitting where they’re at….
Another sometimes ignored sign of a massive decline underway ( or run up) is “stacked gaps”; we now have two on successive days in SPX…
Gap open in UVXY looking more like the old Unicorn I remember. If it is a true break-away gap, not gonna get filled…not today, not even close….
One target for a stop and bounce is 2092.03 which is wave iii down by 2.618 of wave i. Not buying, looking for a bounce to short again.
Closing spread at 0.02 per contract…
Good morning all. I am out of town for my daughter’s graduation from nursing school. Just checking in.
Vern, I am I reading your comments correctly in that you think the market will reverse from this strong open downwards and make a new ATH?
correction, should be “Am I reading correctly?”
ONLY, if we have a C wave down to complete a corrective wave this morning, and that is looking increasingly less likely imho Rod…
The gap lower this morning *should* be too big for an expanded flat to be unfolding and yesterday’s corrective wave to continue. However, I would think the gap will try to get filled (per Vern below) at the open, but will fail miserably within the first 15-30 min.
Analyzing and nailing a corrective move up could be an opportune moment to press short positions with a stop at yesterday’s 2117.64 high print.
Last, a few years back I did an analysis that helped identify “tops” and a high confidence factor was if the index sold off about 3% in three days from the high. That would be Monday as the 3rd day. Targets 2050. Remember too that down Friday’s tend to roll into down Monday’s.
GLTA
Also, it looks like we are going to open and fill the gap from last week’s Friday close to this week’s Monday open. That seems like a natural spot to put up a corrective fight / bounce.
Which also happens to be a 62% retracement from that Fridays lows to this past Wednesday’s high.
I try to stay neutral so I can trade the market I see, not the one that I want to see. With that being said, I believe in the bear count, but I refuse to be a perma bear or perma bull. Being a perma anything is the quickest way to go broke….IMHO
Even though it’s looking real good for us bears, we’re not out of the woods yet.
Agree.
Thanks for that 62% retrace marker.
I am jumping the gun here, but here’s something else to keep in mind.
IF we close today below or near Monday’s low (retracing all of this past week’s gains), it would give us a very bearish “weekly” candlestick…. one with a very long wick. 😀
Truer words never spoken. I think we will get a few clues as to what is going on. I expect a C wave down to complete swiftly in the am and a green close. On the other hand, a possible minute one down could also unfold quickly with an equally sharp reversal up for minute two. For the latter case I think the strong pull of a third will limit the rebound to the 38 to 50% area, and more importantly VIX will keep heading North or post a shallow dip. Completion of a C wave ahead of a move on to new highs will see a complete collapse of both VIX and UVXY at the end of the impulse.
Future showing S&P at 2092 so 2100 is out I am guessing from cash S&P, correct?
I think the September ES futures is trading about a 10 point discount to cash currently. SO we’re right about 2100 now..
ES contract rolled… spread now higher 10 – 11 points or so.
2100 not taken out yet … but almost there.
I think the 2090 target is too high. We should be seeing for the bear count, pivot and prior support areas carelessly demolished…no protracted wangling as we have been previously seeing during corrective moves…
Europe’s indexes have been taken to out back to the woodshed today….
Looking great for us bears today!
“…the big money was not in the individual fluctuations but in the main movements that is, not in reading the tape but in sizing up the entire market and its trend.”
“…It never was my thinking that made the big money for me. It always was my sitting. Got that? My sitting tight!”
“The desire for constant action…is responsible for many losses on Wall Street even among the professionals, who feel that they must take home some money every day, as though they were working for regular wages.”
“Men who can both be right and sit tight are uncommon. I found it one of the hardest things to learn. But it is only after a stock operator has firmly grasped this that he can make big money.”
Jesse Livermore
Great post from a great book.
Thanks for the reminder 🙂
Thanks for sharing.
The computer changed all this and many of his rules are no longer valid. Just telling some of the other side of the story – Livermore was wiped out 3 times, left the markets with zero dollars in his trading account, declared bankruptcy and ended up shooting himself in the head. He did however have some money set aside in trusts for his wife and children. And of course he made some mind blowing profitable trades too.
ECB Buying Junk Bonds! A Surprise… as you would expect them to Buy investment grade Senior Secured corporate bonds. Another dislodged card from the House of Cards foundation!
Junk Corporate Bonds… Wow.
They actually have been doing it all along. The “announcement” is nothing more than an attempt by Draghi to intimidate would be short-sellers…after all, he is the “Whatever it takes!” dude. It is going to be particularly satisfying to watch the ECB implode under his arrogant stewardship…just like his previous gig, which few folk are aware of…
All eyes on the 2100 support today.
If that goes, then get ready to say hello to 2085-2083
UVXY bid up to 11.25 so short sellers are beginning to get a clue. If the pre-market bid goes above 12.20, the most timid trader is looking at an easy double…tons (as in oodles and oodles)of shares remain to be covered if we are in P3…and believe me…they WILL, be eventually covered… 🙂
I’ve covered my E-mini shorts just now, had to as picked up 14 basis points in a matter of hours more or less. Will short again when good entry is found.
Nice trade
DAX futures over 2% in the red…”Brexit Fit”
Looks to me like US baksters desperately trying to hold the line in the futures market…this dam could break, and soon…
Vern,
This is a significant tell considering that ECB has been pumping money into markets and that should have taken DAX higher(see US markets during QE).
Bingo! As I suggested, I think you will first begin to see loss of control in the futures market…
Pre-market bid on UVXY already at 11.02 so short sellers there already throwing in the towel but I do not think they are going to get filled; next important level is 12.20…
The banksters are all in. The heavy hitters on the short side know this and they have been cautious. If Europe is any indication, it could be a good day for the bears. Yesterday was one of the few times in many sessions that an impulse down was not entirely reversed intra-day. They tried but failed to fill the gap.
I think Friday is going to be one of the most important trading days of 2016- somebody is going to get trapped, and it could be either bull or bear. What happens after the initial move down is paramount, especially if it completes an impulse. A plethora of bullish traders are convinced it will be a C wave and salivating at the prospect of a BTFD frenzy. Look for the rebound to be very sharp, as the crowd, and probably a few algos too, pile in. If it is the start of a primary wave down, they are all going to have their heads handed to them on a platter. I know it is all of 90 handles, but I would be calling it the real deal with a take out of SPX 2000 for that’s the way primary waves roll. UVXY will give the heads up I think. Key level is 11.02, then a close above 12.20 for the full speed ahead…Best of succes everyone!
Buying back VIX bullish credit spreads I sold for 0.30 on Monday for 0.05 at the open for a nice gain.
“The bulls look exhausted. Daily, the range they are able to push price up in reduces.”
I definitely have my shorts on. And when I read that I had to chuckle. I’m the one that’s exhausted! Everyday the market seems to turn down, only to be pulled up again ending with a lower wick. How many hanging men does it take? Meanwhile we have not had a 1% decline in 24 sessions, longest streak since June 2015.
There was an article in Bloomberg 2 days ago saying that there is so much free money around provided by central banks, everything is going up. Oil, gold, bonds (giving historic low yields), real estate, bitcoin, and of course: stocks! 30 year bonds auctioned today for 2.47%, 10-year notes less than 1.7%; and the stock market rallied after that!!! Eerily weird…
I’m an exhausted bear! I hope a big turn is around the corner…
I’ll second that. I’m an exhausted bear too.
I’d like to be waking up to see exciting long red candlesticks. Not pathetic 2 point changes overall.
With this market stalling it feels like everything is holding it’s breath….
Looks like we’re gonna get one 🙂
Whoo! Hoo!
oh geez,, rub it in why dont you Verne,, I havent been first for a long time,,,
third 😉
Tough competition tonight!