
Downwards movement was expected.
The main Elliott wave count was invalidated with a new high above 2,111.05.
Summary: There is still weakness to upwards movement; a pullback is still expected sooner rather than later. How low the next wave down goes and how strong it is should indicate which of the three wave counts is correct. For now a new bear wave count allows more upwards movement up to but not above 2,134.75. While this market has made a series of lower lows and so far lower highs from the all time high in May 2015, and while Dow Theory has confirmed a bear market, then a bear wave count will remain more likely than any bullish wave count. In the short term, strong and persistent divergence with VIX indicates downwards movement for tomorrow.
Last published monthly charts are here.
New updates to this analysis are in bold.
BEAR ELLIOTT WAVE COUNT
WEEKLY CHART
Click chart to enlarge.
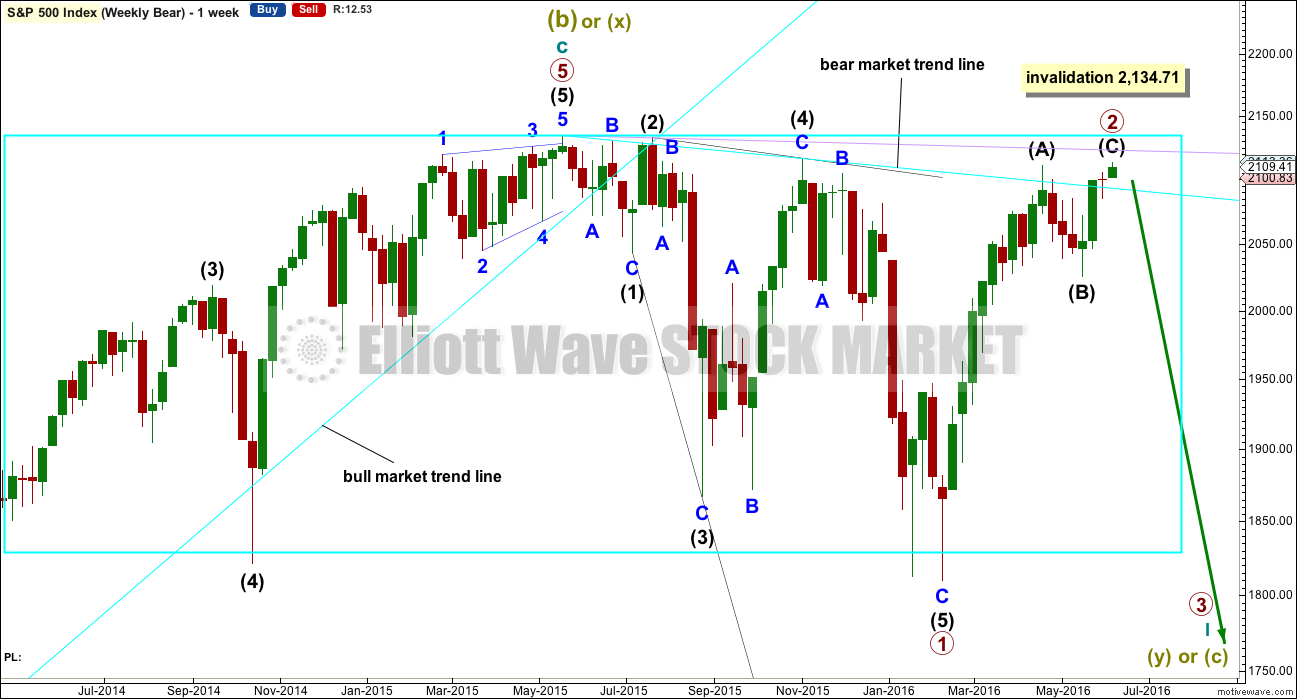
The box is added to the weekly chart. Price has been range bound for months. A breakout will eventually happen. The S&P often forms slow rounding tops, and this looks like what is happening here at a monthly / weekly time frame.
This wave count is new today. Primary wave 1 is still seen as complete, but as a leading expanding diagonal. Primary wave 2 would be expected to be complete here or very soon indeed.
Leading diagonals are not rare, but they are not very common either. Leading diagonals are more often contracting than expanding. This wave count does not rely on a rare structure, but leading expanding diagonals are not common structures either.
Leading diagonals require sub waves 2 and 4 to be zigzags. Sub waves 1, 3 and 5 are most commonly zigzags but sometimes may appear to be impulses. In this case all subdivisions fit perfectly as zigzags and look like threes on the weekly and daily charts. There are no truncations and no rare structures in this wave count.
The fourth wave must overlap first wave price territory within a diagonal. It may not move beyond the end of the second wave.
Leading diagonals in first wave positions are often followed by very deep second wave corrections. Primary wave 2 would be the most common structure for a second wave, a zigzag, and fits the description of very deep. It may not move beyond the start of primary wave 1 above 2,134.72.
Price may find resistance at the lilac trend line if it continues higher.
DAILY CHART
Click chart to enlarge.
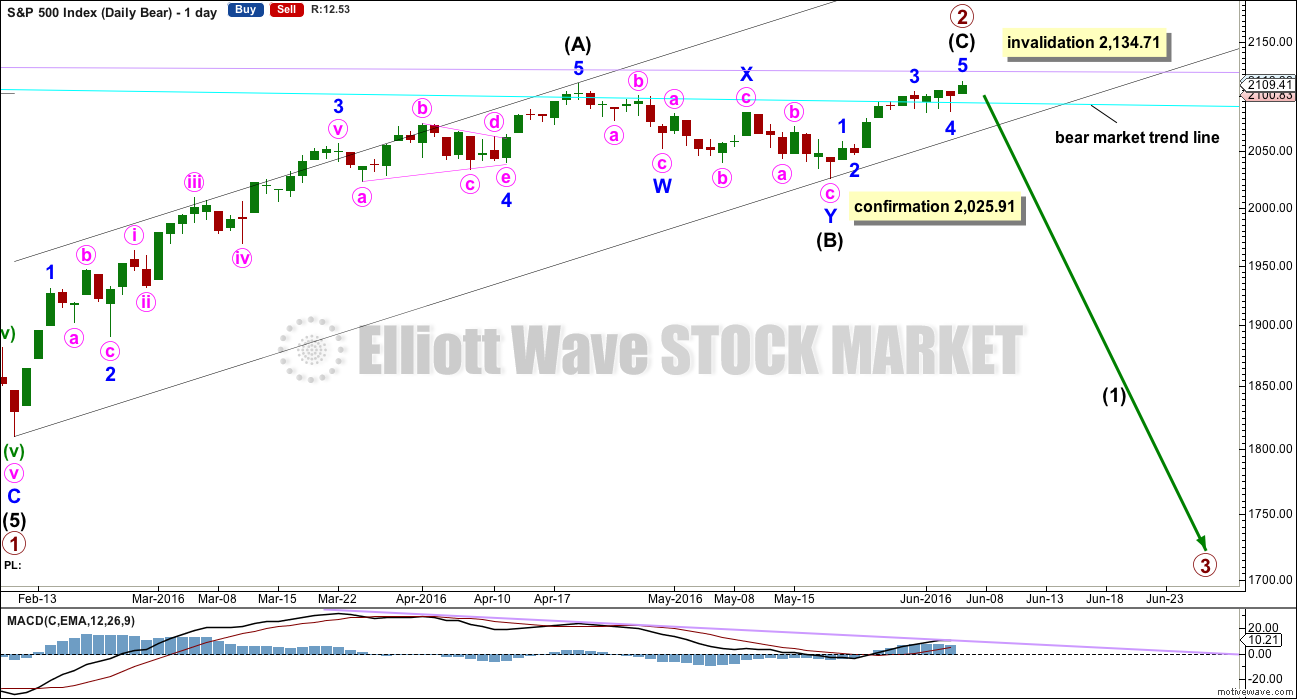
So far primary wave 2 would be a 0.93 correction of primary wave 1. Second wave corrections following first wave leading diagonals are commonly very deep, so this fits the most common pattern if primary wave 1 was a leading diagonal.
The most common structure for a second wave correction is a zigzag.
There is no Fibonacci ratio between intermediate waves (A) and (C).
Intermediate wave (C) must be a five wave structure. It may be either an impulse or an ending diagonal. It would be unfolding as an impulse, not a diagonal. The structure may be complete, but as yet there is no evidence of a trend change.
Draw a channel about primary wave 2 using Elliott’s technique for a correction: the first trend line from the start of the zigzag, then a parallel copy on the end of intermediate wave (A). When this channel is breached by downwards movement it would be indicating a possible trend change. A new low below 2,025.91 would provide price confirmation of a trend change. At that stage, downwards movement could not be a second wave correction within intermediate wave (C) and so intermediate wave (C) would have to be over.
Only when there is some confirmation of a trend change would I be prepared to calculate a target for the next wave down.
HOURLY CHART
Click chart to enlarge.
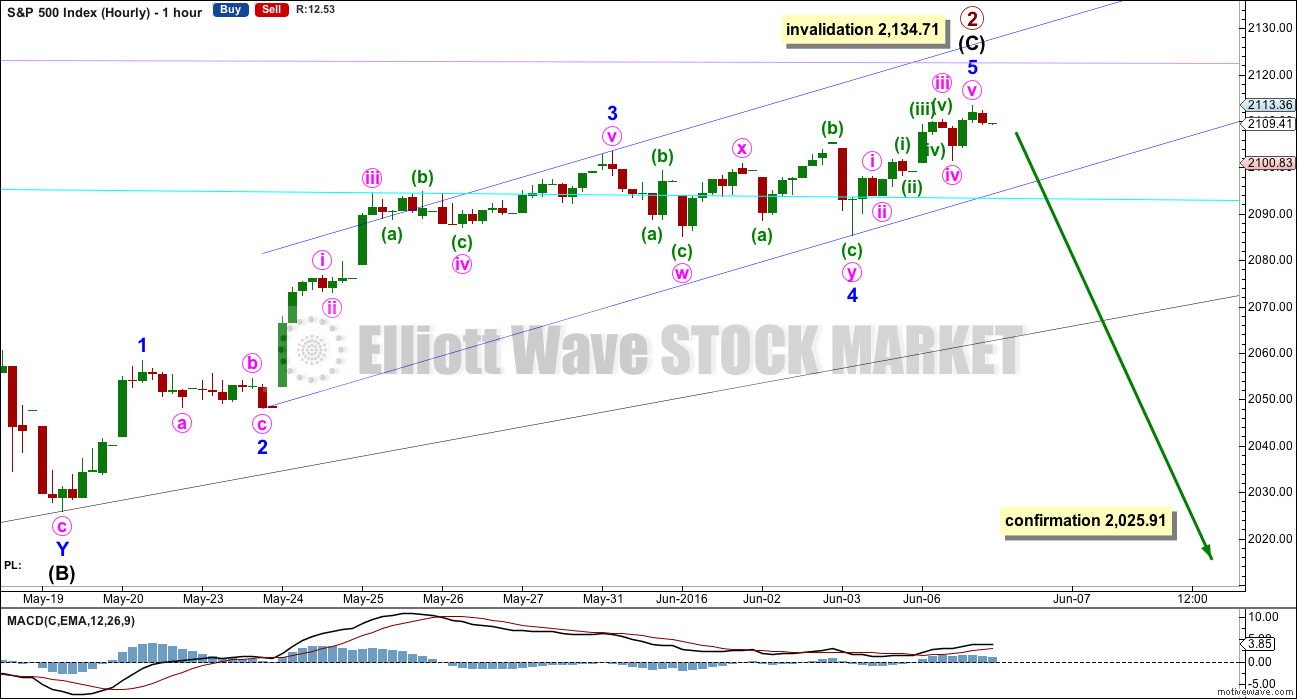
The hourly chart shows the whole structure of intermediate wave (C). This upwards movement is seen as a five wave impulse for all wave counts, so this one hourly chart will suffice for both bear and the bull wave count. The degree of labelling only would be different.
A five wave impulse upwards from the low labelled intermediate wave (B) on 19th of May may now be complete, but the fifth wave may also continue higher.
This wave count at the hourly chart level agrees with MACD. The strongest piece of movement is the third wave. The fifth wave exhibits weaker momentum and divergence with MACD.
Minor wave 3 is 3.05 points longer than 1.618 the length of minor wave 1. If minor wave 5 is over, then it would not exhibit a Fibonacci ratio to either of minor waves 1 or 3. If minor wave 5 continues a little higher, then the most likely target would be 2,118 where it would reach equality in length with minor wave 1.
The first indication of a potential trend change would come with a breach of the blue channel containing intermediate wave (C). Along the way down, expect to see some support, and a bounce, at the cyan bear market trend line.
To the upside, price may find resistance at the lilac trend line now.
ALTERNATE BEAR ELLIOTT WAVE COUNT
WEEKLY CHART
Click chart to enlarge.
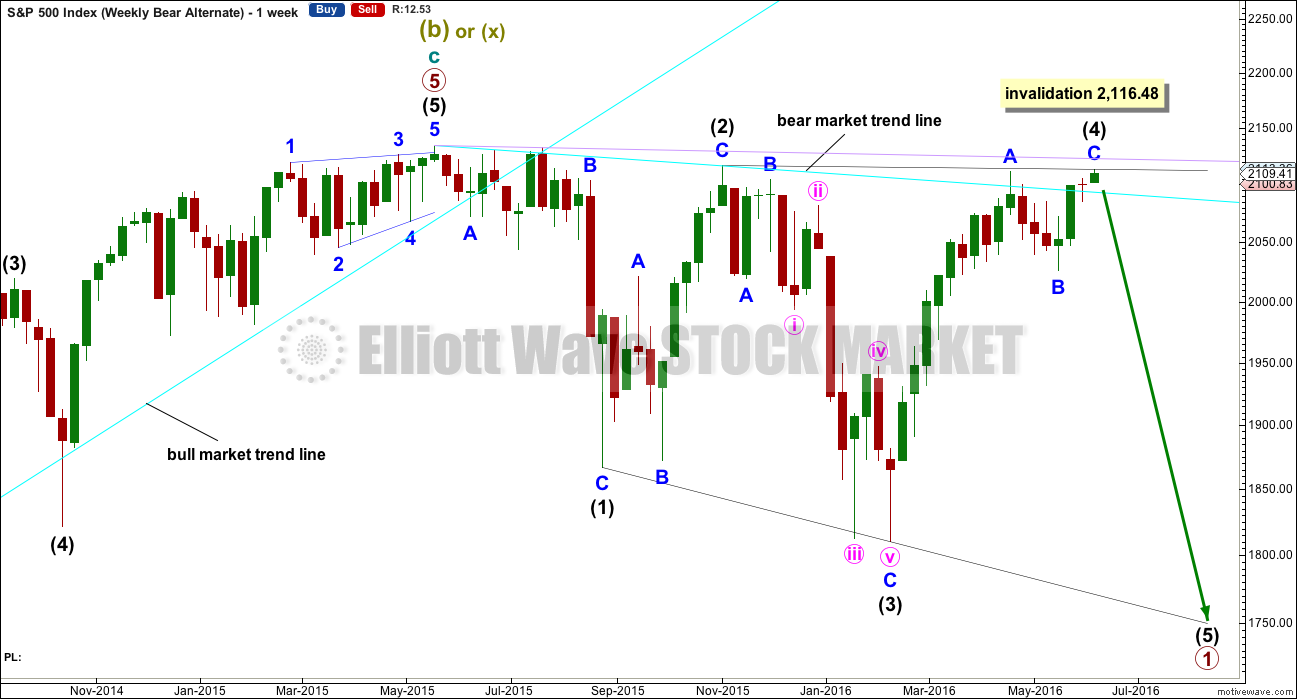
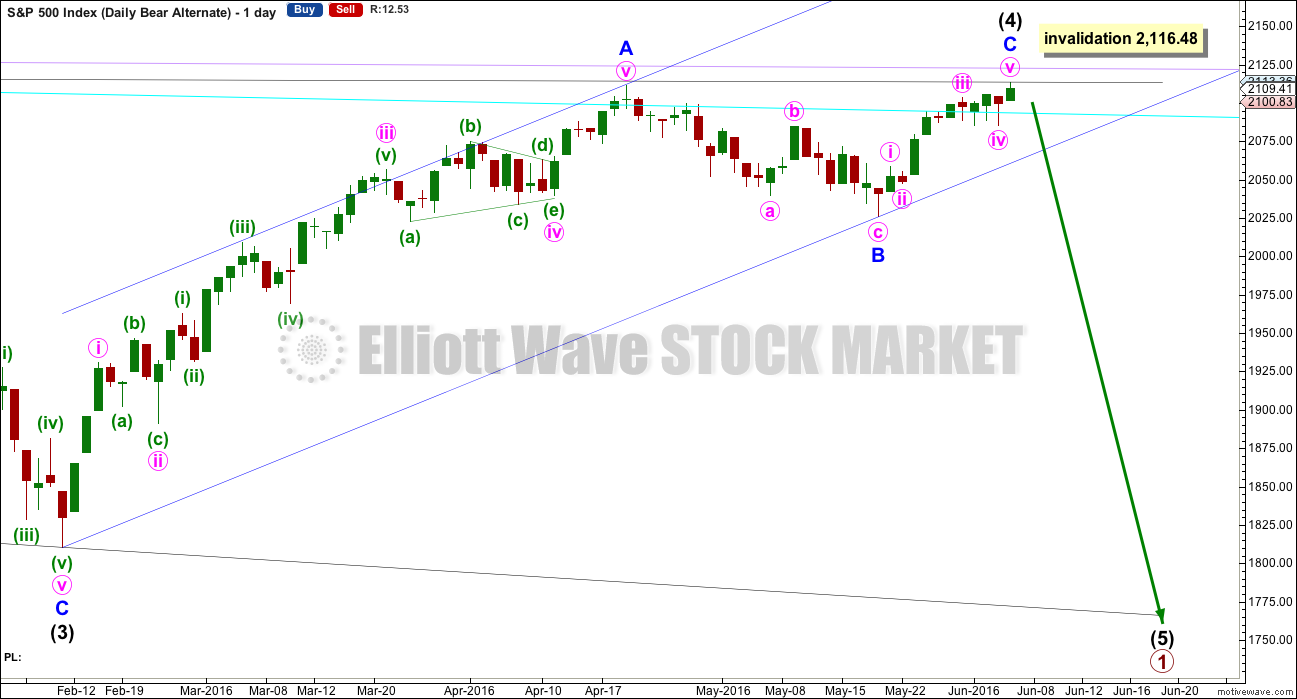
This alternate wave count still sees a leading diagonal unfolding, but only intermediate wave (4) may be completing.
Intermediate wave (4) may end a little higher when price comes to touch the (1) – (4) trend line. This line is drawn from the end of intermediate wave (1) along to the high of minor wave A within intermediate wave (4).
Intermediate wave (4) may not move beyond the end of intermediate wave (2) above 2,116.48.
Leading diagonals may not have truncated fifth waves. Intermediate wave (5) must move below the end of intermediate wave (1) at 1,810.10. Intermediate wave (5) must be longer in length than intermediate wave (3) which was 306.38 points.
If the next wave down does not show an increase in momentum or volume beyond intermediate wave (3), then this would be an explanation.
DAILY CHART
Click chart to enlarge.
Intermediate wave (4) must subdivide as a zigzag. Within the zigzag, minor wave C is likely to move at least slightly above the end of minor wave A at 2,111.05 to avoid a truncation.
No target is given for intermediate wave (4) to end because the best guide is likely to be the (1) – (4) trend line.
This wave count must see the downwards wave labelled minute wave c within minor wave B as a five wave structure. This is possible, but it looks forced on the daily and hourly chart levels. This reduces the probability of this wave count.
Momentum and volume of the next wave down would indicate which bear wave count is correct (if price remains below 2,111.05). A new high above 2,111.05 would invalidate the main bear wave count and confirm this alternate.
When the leading diagonal is complete, then a very deep second wave correction would be expected. This alternate wave count expects the box on the first weekly chart to remain essentially intact several more months.
BULL ELLIOTT WAVE COUNT
WEEKLY CHART
Click chart to enlarge.
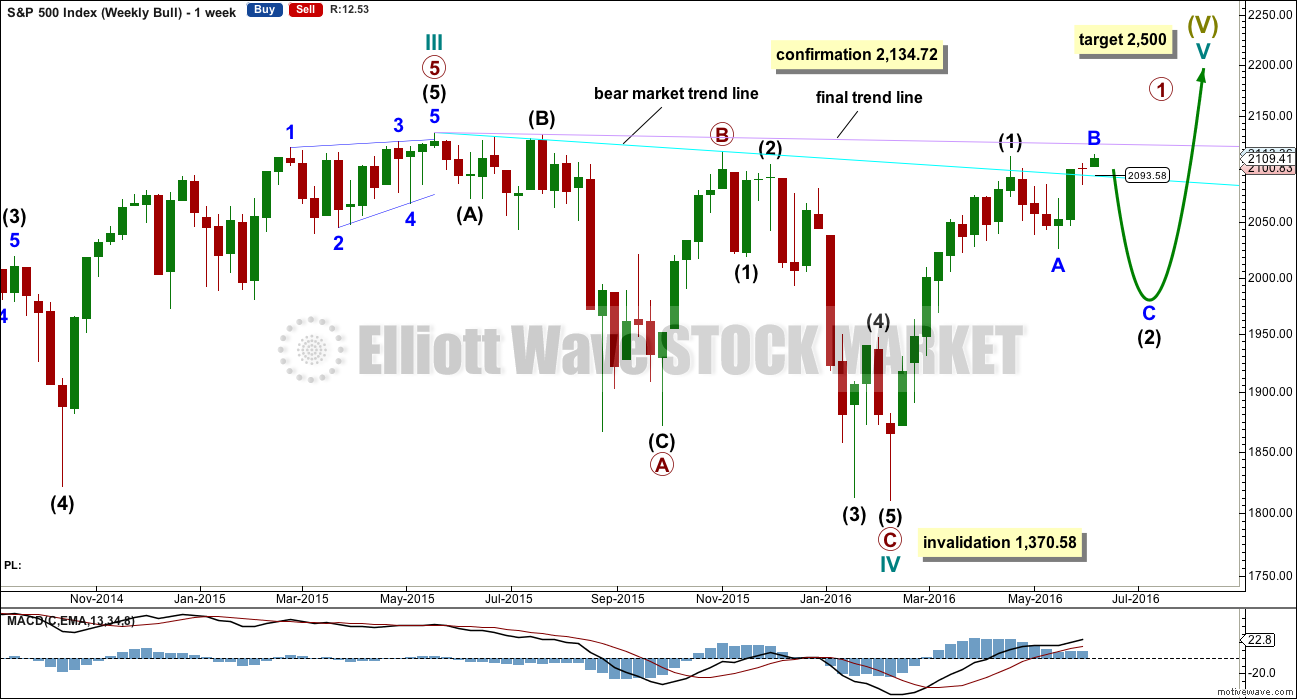
Cycle wave IV is seen as a complete flat correction. Within cycle wave IV, primary wave C is still seen as a five wave impulse.
Intermediate wave (3) has a strong three wave look to it on the weekly and daily charts. For the S&P, a large wave like this one at intermediate degree should look like an impulse at higher time frames. The three wave look substantially reduces the probability of this wave count. Subdivisions have been checked on the hourly chart, which will fit.
Cycle wave II was a shallow 0.41 zigzag lasting three months. Cycle wave IV may be a complete shallow 0.19 regular flat correction, exhibiting some alternation with cycle wave II.
At 2,500 cycle wave V would reach equality in length with cycle wave I.
Price has now broken a little above the bear market trend line. This line is drawn from the all time high at 2,134.72 to the swing high labelled primary wave B at 2,116.48 on November 2015. This line is drawn using the approach outlined by Magee in the classic “Technical Analysis of Stock Trends”. To use it correctly we should assume that a bear market remains intact until this line is breached by a close of 3% or more of market value. Now that the line is breached, the price point at which it is breached is calculated about 2,093.58. 3% of market value above this line would be 2,156.38, which would be above the all time high and the confirmation point.
This wave count requires price confirmation with a new all time high above 2,134.72.
While price has not made a new high, while it remains below the final trend line (lilac) and while technical indicators point to weakness in upwards movement, this very bullish wave count comes with a strong caveat. I still do not have confidence in it. It is produced as an alternate, because all possibilities must be considered. Price managed to keep making new highs for years on light and declining volume, so it is possible that this pattern may continue to new all time highs for cycle wave V.
The invalidation point will remain on the weekly chart at 1,370.58. Cycle wave IV may not move into cycle wave I price territory.
This invalidation point allows for the possibility that cycle wave IV may not be complete and may continue sideways for another one to two years as a double flat or double combination. Because both double flats and double combinations are both sideways movements, a new low substantially below the end of primary wave C at 1,810.10 should see this wave count discarded on the basis of a very low probability long before price makes a new low below 1,370.58.
DAILY CHART
Click chart to enlarge.
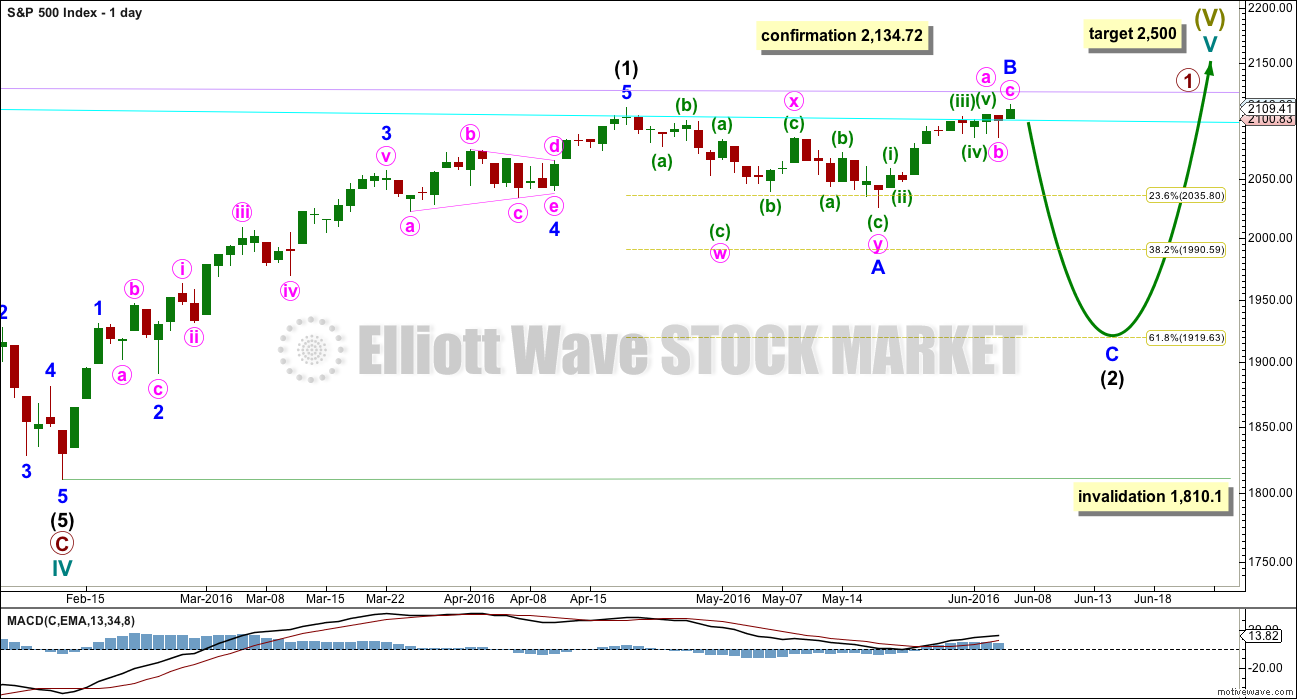
Intermediate wave (2) may still be an incomplete flat correction. Minor wave A will subdivide as a three, a double zigzag, and minor wave B may be seen as a single zigzag.
The most likely point for intermediate wave (2) to end would be the 0.618 Fibonacci ratio at 1,920.
Intermediate wave (2) may not move beyond the start of intermediate wave (1) below 1,810.10.
TECHNICAL ANALYSIS
WEEKLY CHART
Click chart to enlarge. Chart courtesy of StockCharts.com.
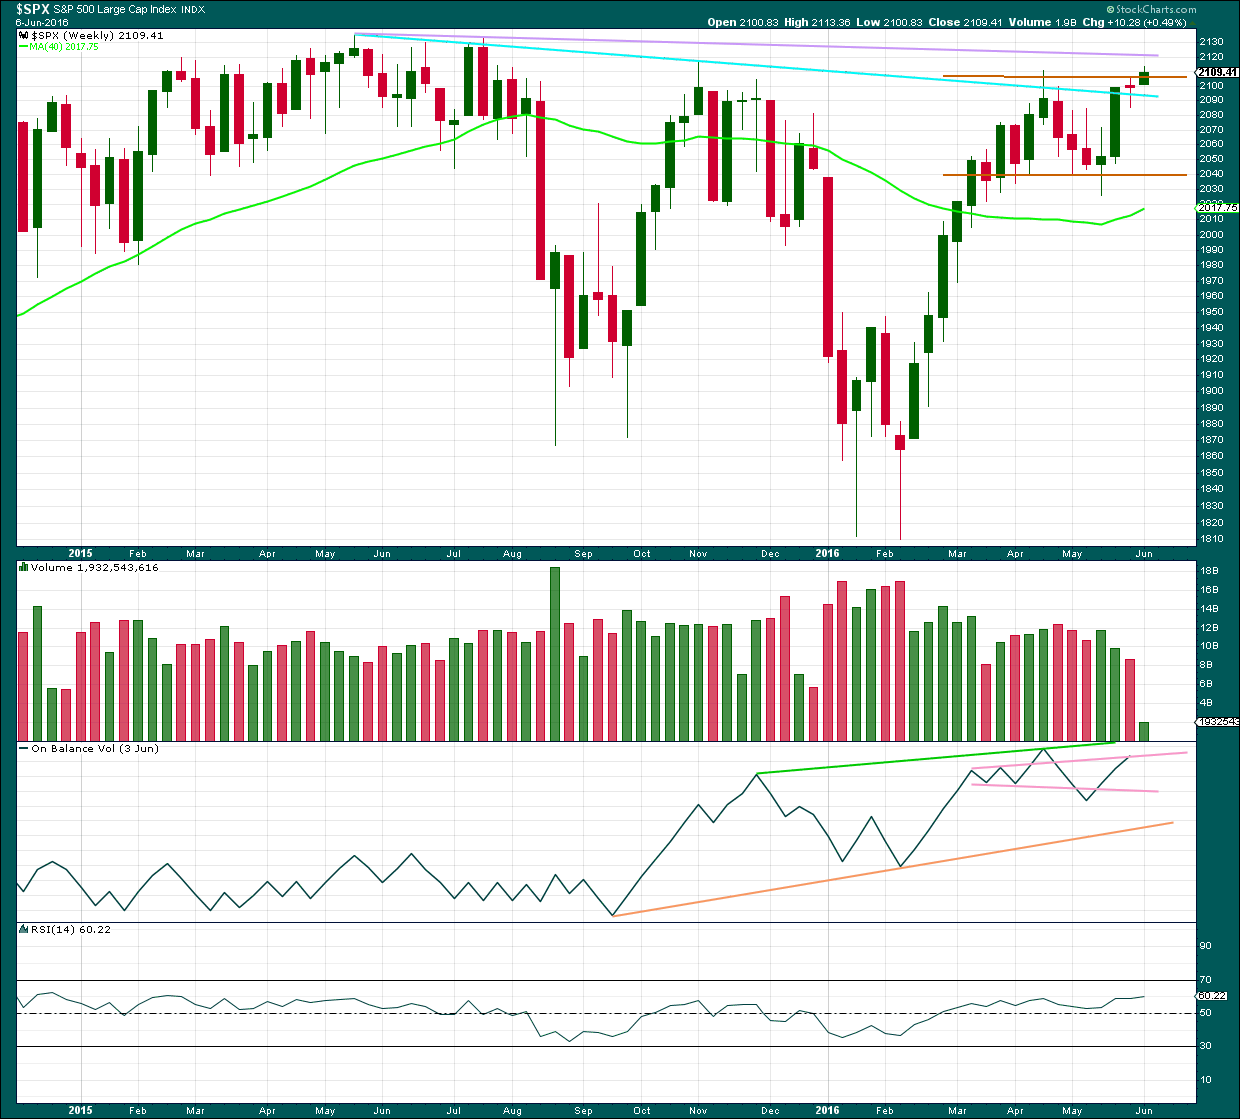
Price is the final determinator and the most important aspect of market analysis. So what has price been doing since the all time high in May 2015?
Price has so far made lower lows and lower highs. Price today has moved above the cyan trend line for the first time with a full daily candlestick above the line. This is the most bullish signal to date; resistance at that line has weakened. Price has not yet made a new major swing high above the high of 2,116.48 in November 2015. This price point is very important. It may offer resistance.
Last week completes a small doji pattern with lighter volume. This represents a balance between bulls and bears for the week and indecision. The long lower wick is slightly bullish while the red colour is slightly bearish.
On Balance Volume still shows divergence with price: from the high in November 2015 to the high in April 2016, price made a lower high while OBV made a higher high. This is hidden bearish divergence; it indicates weakness in price.
Volume is declining while price has essentially moved sideways for the last ten weeks in a zone delineated by brown trend lines. The longer price meanders sideways the closer a breakout will be. During this sideways range, it is a downwards week which has strongest volume suggesting a downwards breakout may be more likely.
The strong green candlestick two weeks ago the most bullish signal for some time. With this now followed by a doji, some of this bullishness is dissipated.
The 40 week moving average has turned upwards, another bullish signal. However, this has happened before in October 2015 yet it was followed by a strong downwards wave. On its own this bullish signal does not necessarily mean price is going to make new all time highs.
DAILY CHART
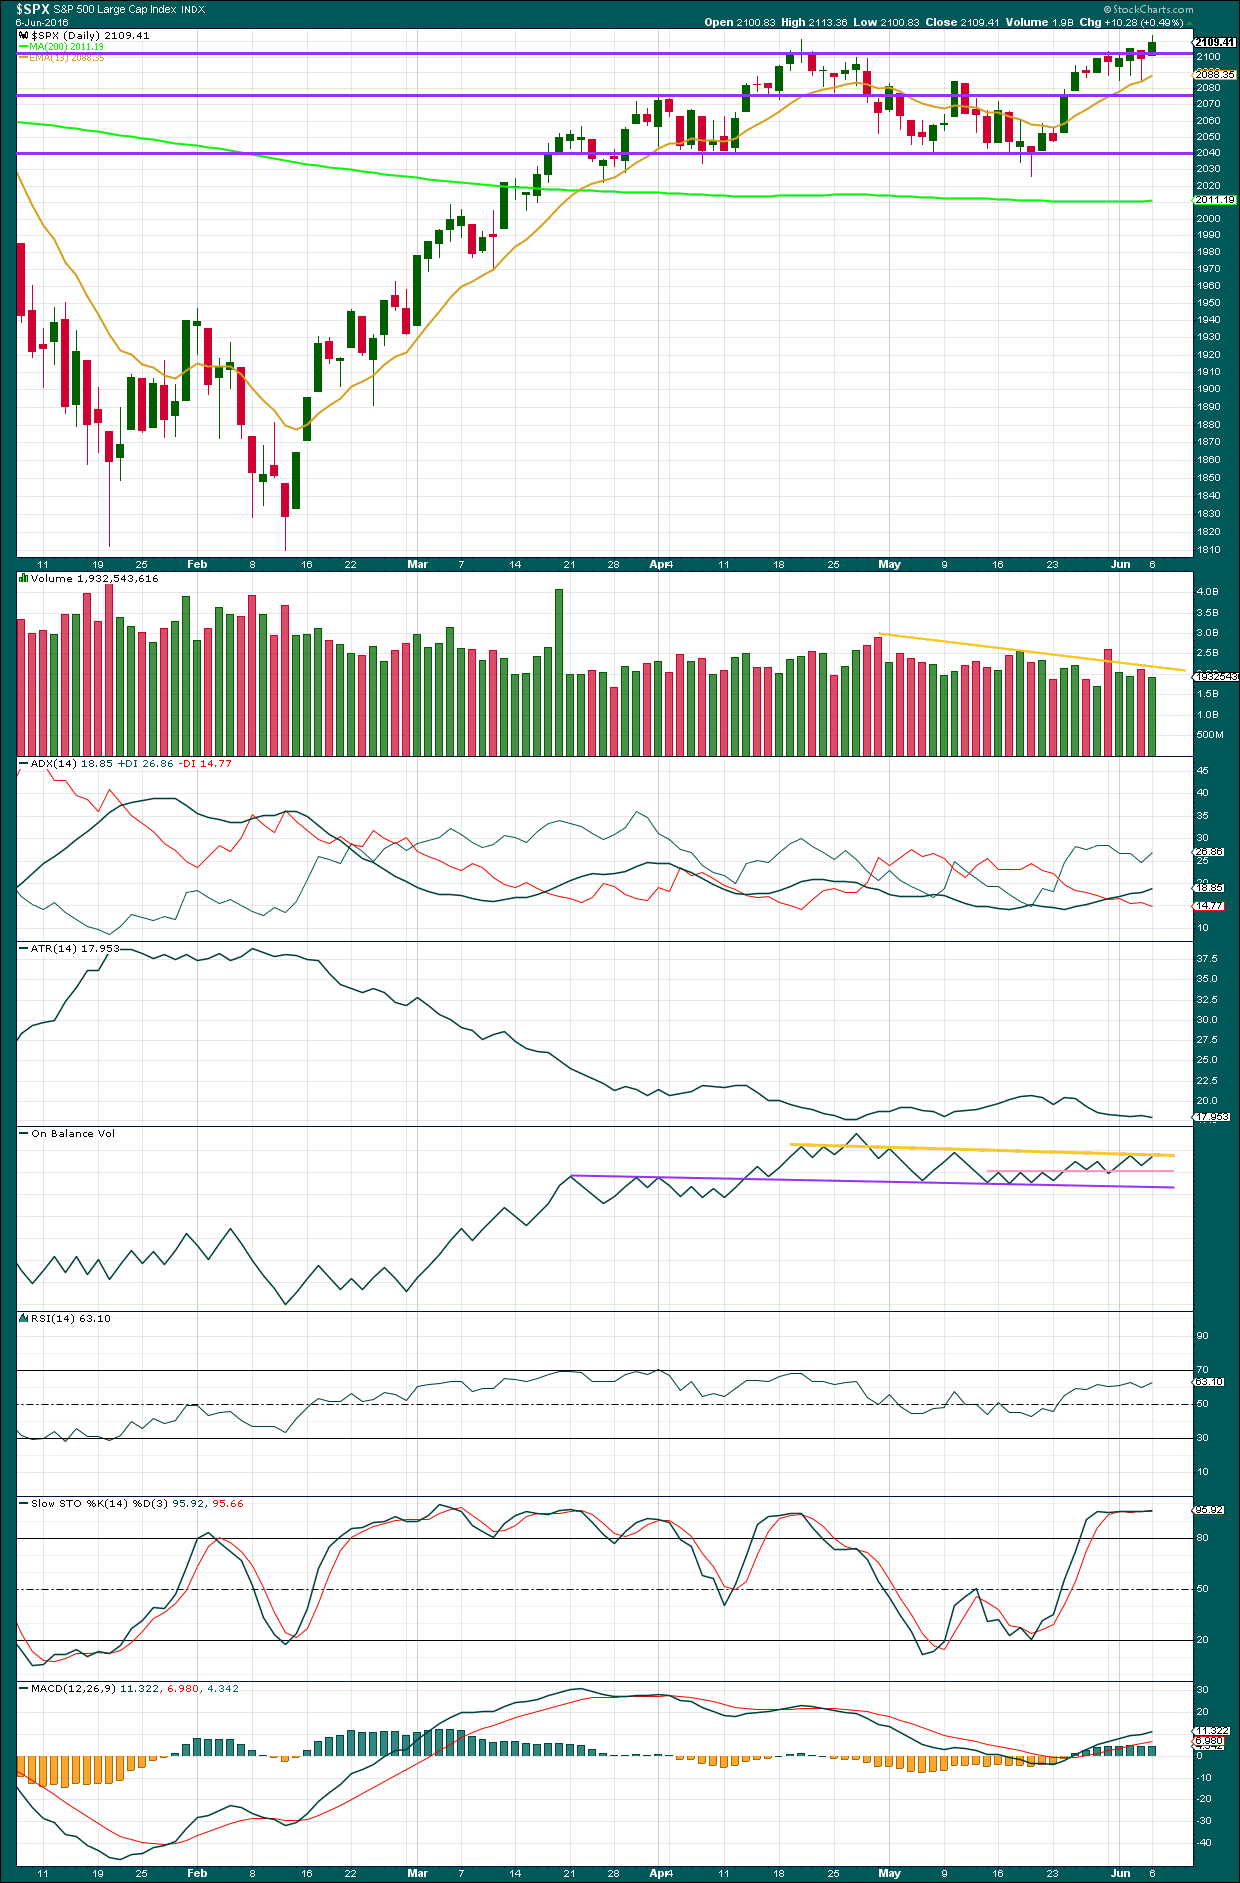
Click chart to enlarge. Chart courtesy of StockCharts.com.
Volume data on StockCharts is different to that given from NYSE, the home of this index. Comments on volume will be based on NYSE volume data when it differs from StockCharts.
Again, upwards movement comes on light volume; volume does not support the rise in price. Within the last seven sessions, it is two downwards days which have strongest volume indicating the bears were more active on those two days than the bulls have been in the other five days. The volume profile continues to be bearish.
ADX is still increasing indicating an upwards trend is in place. ATR still disagrees. Normally, during a trend the range travelled increases but here it is flat to declining. This is not normal for a trend and indicates the trend is weak.
On Balance Volume has again come up to touch the yellow trend line. There is still divergence between price making a new high above the prior high of 10th of May, but OBV has not managed to make a corresponding new high. This indicates price is weak. A break above the yellow line would be a reasonable bullish signal. A break below the purple line would be a bearish signal.
There is no divergence between price and RSI to indicate any weakness. RSI is not yet extreme. There is room for price to rise or fall.
Stochastics remains flat while price has made new highs for the last few sessions. There is some weak divergence here. But divergence between price and Stochastics is not very reliable. This is a bearish signal but a weak and unreliable one.
VOLATILITY – INVERTED VIX MONTHLY CHART
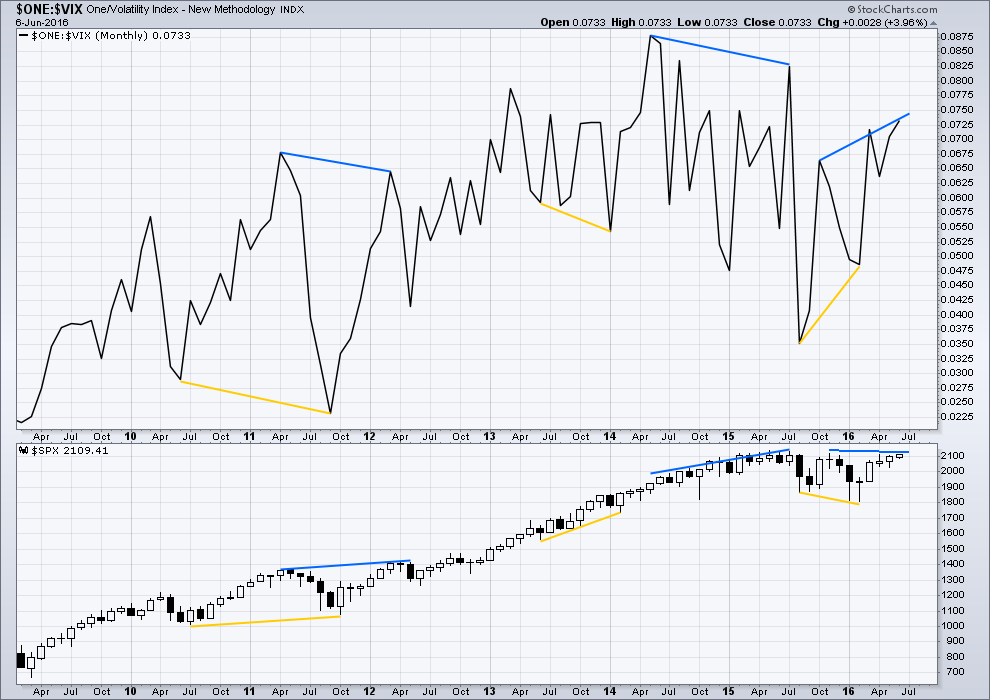
Click chart to enlarge. Chart courtesy of StockCharts.com.
Several instances of large divergence between price and VIX (inverted) are noted here. Blue is bearish divergence and yellow is bullish divergence (rather than red and green, for our colour blind members).
Volatility declines as inverted VIX rises, which is normal for a bull market. Volatility increases as inverted VIX declines, which is normal for a bear market. Each time there is strong multi month divergence between price and VIX, it was followed by a strong movement from price: bearish divergence was followed by a fall in price and bullish divergence was followed by a rise in price.
There is still multi month divergence with price and inverted VIX currently: from the high in November 2015 price has not yet made a new high but inverted VIX has. Volatility at this stage is lower than it was in November 2015, but this has not yet translated into a new high for price. Price is still weak.
VOLATILITY – INVERTED VIX DAILY CHART
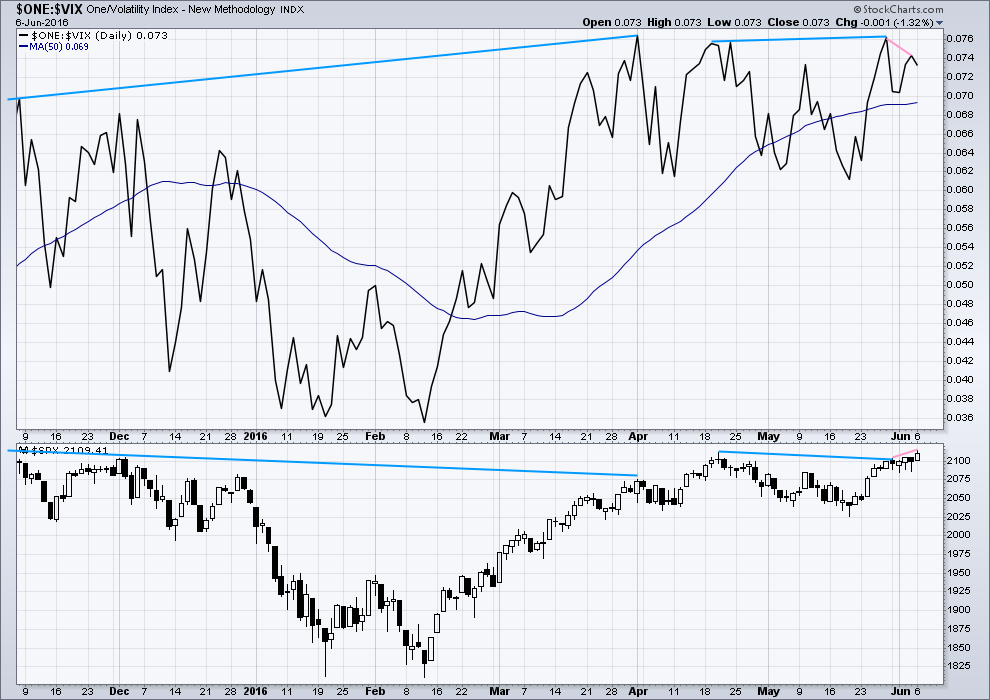
Click chart to enlarge. Chart courtesy of StockCharts.com.
There are two instances of hidden bearish divergence noted on this daily chart of price and VIX (blue lines). VIX makes higher highs as price makes lower highs. The decline in volatility is not matched by a corresponding rise in price. Price is weak.
There is also very short term regular bearish divergence (pink lines). VIX did not make a corresponding new high as price made a new high today. This indicates exhaustion for bulls and underlying weakness in price.
Price today turned upwards to new highs to complete a green daily candlestick but VIX (inverted) turned down. Volatility increased while price moved higher. This is not normal and indicates further exhaustion for bulls. This divergence again is bearish.
While I would not give much weight to divergence between price and many oscillators, such as Stochastics, I will give weight to divergence between price and VIX. Analysis of the monthly chart for the last year and a half shows it to be fairly reliable.
BREADTH – ADVANCE DECLINE LINE
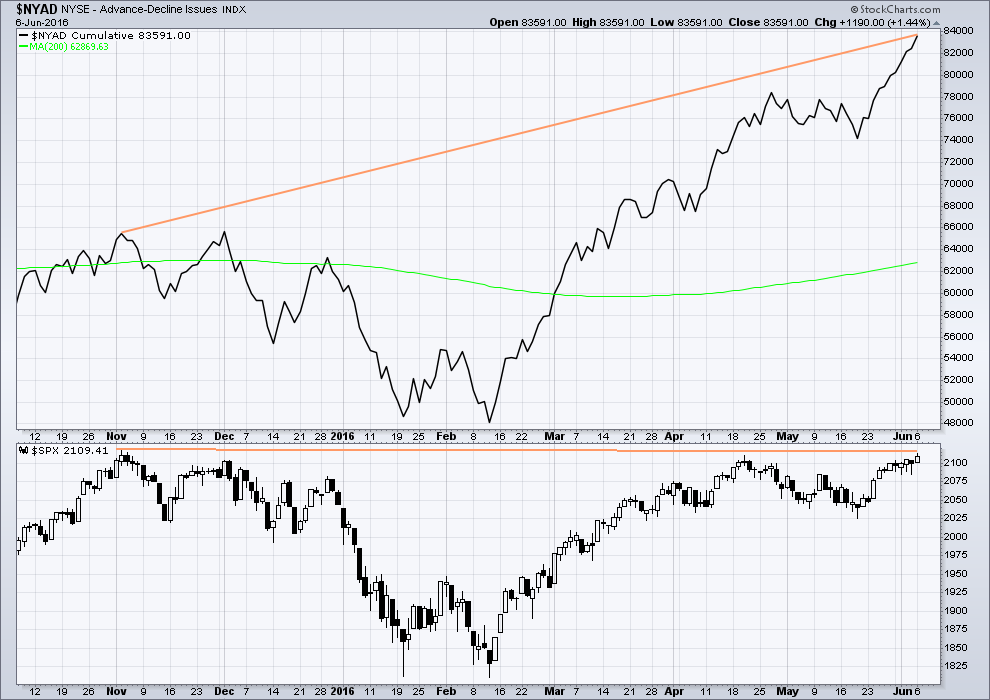
Click chart to enlarge. Chart courtesy of StockCharts.com.
With the AD line increasing, this indicates the number of advancing stocks exceeds the number of declining stocks. This indicates that there is breadth to prior upwards movement.
From November 2015 to today, the AD line made new highs while price far failed to make a corresponding new high. This indicates weakness in price; the increase in market breadth is unable to be translated to increase in price (orange lines).
The 200 day moving average for the AD line is now increasing. This alone is not enough to indicate a new bull market. During November 2015 the 200 day MA for the AD line turned upwards and yet price still made subsequent new lows.
DOW THEORY
The last major lows within the bull market are noted below. Both the industrials and transportation indicies have closed below these price points on a daily closing basis; original Dow Theory has confirmed a bear market. By adding in the S&P500 and Nasdaq a modified Dow Theory has not confirmed a new bear market.
Within the new bear market, major highs are noted. For original Dow Theory to confirm the end of the current bear market and the start of a new bull market, the transportation index needs to confirm. It has not done so yet.
Major lows within the prior bull market:
DJIA: 15,855.12 (15th October, 2014) – closed below on 25th August, 2015.
DJT: 7,700.49 (12th October, 2014) – closed below on 24th August, 2015.
S&P500: 1,821.61 (15th October, 2014) – has not closed below this point yet.
Nasdaq: 4,117.84 (15th October, 2014) – has not closed below this point yet.
Major highs within the new bear market:
DJIA: 17,977.85 (4th November, 2015) – closed above on 18th April, 2016.
DJT: 8,358.20 (20th November, 2015) – has not closed above this point yet.
S&P500: 2,116.48 (3rd Nobember, 2015) – has not closed above this point yet.
Nasdaq: 5,176.77 (2nd December, 2015) – has not closed above this point yet.
It is a reasonable conclusion that the indices are currently in a bear market. The trend remains the same until proven otherwise. Dow Theory is one of the oldest and simplest of all technical analysis methods. It is often accused of being late because it requires huge price movements to confirm a change from bull to bear. In this instance, it is interesting that so many analysts remain bullish while Dow Theory has confirmed a bear market. It is my personal opinion that Dow Theory should not be accused of being late as it seems to be ignored when it does not give the conclusion so many analysts want to see.
This analysis is published @ 10:50 p.m. EST.
Not sure if anyone pointed it out but today’s daily candle, a shooting star, is the first bearish candle in awhile. Now we need confirmation tomorrow…..
I am looking at how VIX performed during the last primary impulse down. Not too much excitement at the end of intermediate 1 when VIX topped around 20 on July 9. The upper BB was actually penetrated on June 30 at the end of minor three down and minor five on July 9 made a slightly higher high. The real fireworks came with a multi-year spike at the end of intermediate three of primary one down at around 53 on August 24. This lends very powerful credence to that being a third wave down for the bearish count exactly as Lara has it labelled. For a primary three down, I would expect a steeper fall for its intermediate one down, and a more intense spike for its minor three. A confirmation of a primary three down suggests that we are perhaps weeks, and at the most a few months from seeing literally historical displays of heightened volatility as intermediate three of primary three unfolds. Looking at the last bear market, it should be the zenith of the volatility spike for the entire bear market decline. I will be watching VIX very, very, very closely….
After market musing:
Anyone know whatever happened to options2014?
I miss old Ace & his enthusiasm
I received complaints from at least two members about Ace. I communicated with him via email and it was actually his suggestion as well as mine that his commenting privileges be removed.
He’s still a member. Still reading comments. He just can’t participate.
Thanks Lara.
I didn’t know EWSM had – just like rugby union – a “sin bin” where players can watch but not participate. Maybe I’d better watch out…
Shout out to Ace! 🙂
I kinda miss him too actually. Can we let him out of the penalty box if he promises to be nice? 🙂 🙂 🙂
Sure, if he asks. It’s up to him.
Yes, I have a black list. A few people have been removed from the membership and not allowed to return.
People aren’t always nicely behaved online due I think to anonymity. Combine that with the fact that trading is an emotional exercise and it’s impossible for me to be always right and you have a perfect combination of factors where some people just won’t play nice.
On the rare occasions I receive inappropriate emails the sender is immediately removed and blacklisted. I do not offer a second chance.
It’s rare though. This membership is almost exclusively conducted in a polite and respectful manner.
And just to be clear, Ace hasn’t been blacklisted nor removed from the membership. His emotional comments were upsetting a few members and exhausting my patience. So he was just removed from comments, not the membership. It was a (mostly) mutual decision at the time after discussion with him.
Dear Lara; so gracious, as well as EW chartist extraordinaire. Thanks.
Hey ACE, you heard the lady!
Its up to you bud! 🙂 🙂
The clarity of busting the alternate bear count is kinda nice today.
Since Feb. lows, the only thing the market has followed is crude. Would be confirming to see crude turn down. Not necessary, but something to look out for.
The dislocation of bonds at their highs and yen staying strong are, I believe, meaningful warning signs that this rally is near its end.
GLTA
The daily candle finally has a long upper wick especially when relative to the body. We have not seen that in in 10 or more trading days. It may be the first clue the bears are starting to sell the market.
I cannot wait for the VIX, UVXY, and TVIX short sellers to start covering. It is going to take some strong down days on the SPX to convince them though.
The first clue that they are running for the hills will be not only opening gaps, but also intra-day gap ups as well. That is the one situation in which you want to buy intra-day gap ups that are filled during the session….
Well just maybe….
Pretty close to what I have this morning….
Minor 5 (which is the whole of the 5 min chart above) would be just 1.41 points longer than minor 1
IF it’s over there. Confidence below 2,085.36. Confirmation below 2,025.91.
Lilac trendline held as well.
Lara -Just wanted to check something:
Does price need to CLOSE below 2025.91, or just be lower than that at any point in the coming days/weeks to provide confirmation?
Thanks
Just be lower, a close isn’t necessary.
That’s because I’m using the EW rule that a second wave may not move beyond the start of a first wave.
If the degree of labelling in this last impulse up from the low 2,025.91 is moved down one degree, if a first wave up is complete, then a second wave correction may not move beyond it’s start.
The rule is black and white.
Ok, thanks for the clarification.
No worries. And it’s a fair question, often asked.
I charted the minute w5 only on the 3 min chart and I really wanted to count minuette w5 as an ending diagonal (but I didn’t). Yours has better look Lara.
Gary
Lara,
By the way, really nice work on the main count. Hope it holds, I don’t think any other analylists have that count.
You’re welcome. Price should tell us within a month. If the bull count is correct then we’ll see a new ATH. If the bear is correct then price should fall off a cliff soon.
Cesar found that count actually. He’s really helpful. A second pair of eyes for me.
Hail Cesar! 🙂
UVXY just dipped its toe in the green
If we get a gap up past 12.20 tomorrow due to cratering overnight futures, we’ve got massive short covering underway. Any move past 14.50 in the next day or two would in my mind confirm we have had a change of trend….
and thar she blows,,, on a pick up of volume too
We may have a new VIX uptrend with higher highs, and higher lows. We do need to close in the green at the high of the day for there to be any conviction that it is indeed signaling a trend change….
if SPX stays under 2117 for the rest of this nano move we could be onto something…
I make that five down now….
IF we have a corrective retrace AND stay under the low of the day, I’m considering that a local top in place and the next move is down, down, down.
Paint her red, bears 🙂
Update: 2117 seems really strong today
My target has been struck today, so i’m on the lookout for a five down in microcharts.
IF we get that… and a corrective pullback, then it’s shorty time, which i will press hard…
Very hard..
Hey Stuart, I said I would be the first to acknowledge your call last week was right on the money. Here’s to you my man. You called it!
Come on in; the water’s fine…. 🙂
LOL
Thanks Verne, but not getting too excited just yet. Nothings broken…yet… but I’m optimistic it won’t be long 🙂
Yeah. I am actually not going to rest easy until that 2100 pivot taken out.This thing could still cut loose to the upside just for good measure…
Looks like yet another nice impulse down…will it be bought??!!
Somebody shake me awake when UVXY clears 12.20 will ya? 🙂 ‘Bye…
2100 is the approximate location of the hourly channel lower trendline. We need to break it decisively, tomorrow perhaps.
It really drives me batty when I see the bears start hemming and hawing around those pviots. I ask myself what the heck is the matter with them. Don’t they recongize nice juicy bull steaks when they see ’em? If they start messing around at 2100 again I bail…and I’m NOT kidding. Hesitation there spells trouble sure as night follows day. I hate when I see it happening and don’t exit my short trades as I have learned a million times is prudent. My skull must be thicker than I imagine…! 🙂
I hope Lara can give us an approximate target for a possible intermediate one down. I really want to carefully manage my volatility trades this time around…
I agree. For the bear wave count 2,100 needs to be sliced through for confidence.
Like a hot knife through butter.
Or as Mike Myers’ SNL Jewish New York aler-ego would opine- ” Like a hot knife thorough budda” 🙂
If 2105 gets taken that’ll do me… and any retest of this area after it breaks… then that will be my entry.
Nice rounded dome with a flag…
nice rolling over look – possible breakdown into the close?
UVXY waking up a bit…
I expect the short sellers to hold on for dear life. It’s going to take a 2% plus decline in futures to get their attention. I am supremely confident that the crowd is in no way expecting the next decline to be anything other than a brief correction, where everyone and his/her grandma will as ususal, BTFD!!
Interesting shift in VIX price action today.
Instead of gap up being filled to the downside, we have a gap down being filled to the upside…
Usual EOD melt up having a hard time lifting the market… bearish
nice drop on high volume
bot SPY puts exp 3 days right before the drop
closed out after hours, don’t want to hold short expiry overnite
I have never ever seen such a relentless series of new 52 weeks lows as I have seen the last month; precisely what one would expect ahead of a historic wave down…
These days I suppose that 2 point intraday retrace is all a bear gets
Update:
Channel breaks in SPX notoriously fickle, but a break of the lower green one would be a good start….
Are we surprised?! This is absolutely nuts! 🙂
I wish we would get that throw-over and be done with it….
If this is a second wave, we should get a water-fall drop just about now. If not, I am off to more interesting pursuits….VIX again indecisive…
No throw over so far. Will this impulse down again be bought??!!
Watching VIX like a hawk. We clear 15.25, and I am all smiles baby!
relentless this bid underneath the markets….. Still looking for a breakdown to re-short. Hopefully we see it this afternoon.
If VIX heads North and engulfs the previous four days’ candles, above 15.25 that’s all she wrote. It can only mean one thing, and that is that the big money is on the move. One key thing to making great trades is to “follow the money”…
Anybody else short Valeant?
I really feel Bill Ackman’s pain…
Now Vern?
Looks like a purrrrfect set-up!
Only thing missing is converging trend-lines but close enough….
VIX is green, UVXY off 3%. Starting to not believe in any indicators
Here is a hint. If VIX closes in the green, and UVXY does not, that is money lying in the corner…. 🙂
It should not just barely close positive; it needs to head North and not look back, not for one second. If it does not, what the indices are doing at the time not that important…that would be true divergence…that is, when it persists…
I think we are gong to spike to the round numbers of 2020.00
Possible ending diagonal…
Yep. It sure looks like the fourth wave not done . We may see a 1,3 trendline, such as it is, throw-over to end it, which would actually be a great sign…
I wish I would have bought SPXL at SPX 1811 and fell into 3 month coma
Same here 🙁
Yep – easy money
Set it – and forget it!
It’s that easy!
(old tv commercial)
Ah yes! The dentures commercial! Fix-O-Dent!
Here it is…
Everyone will have a chance to set and forget to the long side later in this year.
Hard part is doing nothing once you take the trade.
Been holding one position since April and it’s killed me not to close it umpteen times already
Yep. Exiting profitable trades can be hard to do consistently. I find it helpful to have a profit target prior to entering the trade. Put credit spread on VIX opened today already nicely in the green and I may hold through expiration next week for full profits. Then again I may just take the money and run and buy ’em back on any gap up tomorrow at 0.15 for a 50% ROI….I think I will set up that buy limit tonight in case I forget…. 🙂
There is nothing more frustrating than missing a primary degree second wave up. One analyst I read yesterday actually has primary one completing back in August, with primary two being a great big two pronged monster expanded flat- really impossible to trade with any confidence….except in hindsight…
Looking like consolidation once again to me folks. A possible extended fifth?!
VIX headed back South…bad sign for bearish action…
Ahead of a serious downside move, volatility, particularly the VIX, does not stammer, stutter, or stumble…it simply heads North and does not look back. If we see another move into green territory retraced back into the red, I am afraid the bulls are not quite done with the ramp up. In fact I would presume we have a real upside break-out underway…
Vern, Does it mean anything that the vix has been slowly climbing all am?
Excuse the novice question, but I have never used the vix as a trading signal before
I have to admit the signals have been very erratic of late. We had divergence yesterday but it did not hold. At this point, the only buy signal that has not been triggered and reversed is a gap up open that is not filled in the same session. The kind of move we are seeing today has happened before with a slow climb for much of the session that is ultimately reversed. I think we are seeing a concerted and persistent bid under the market to arrest any incipient decline and I am at a loss to fathom how long that kind of thing can go on. I was sure we would see a reversal at DJI 18,000.00 but the bid under the market persists. There are simply no sellers….
Yep…
Might not reverse until all shorts are carried out on their shields…
Here is the problem with that secnario, when, and it is not if, just when, the market collapses under its own bloated torpidity, who is going to arrest the plunge if there are no shorts to cover?! This to me is SO dicey….
Of course traders holding leap puts don’t really care, those who actually sold the market short not so blissful…I think they have all covered at this stage in the game….unless they have iron huevos… 🙂
Vern,
VIX futures contracts are showing exceptionally high volume. Typically, this would be a sign of a significant top but not always and especially given the manipulation. When the drop happens, it will be sudden allowing no time for folks to pull the trades and hence tricky cause no real signs on where the markets are headed and for how long.
I noticed. That could either be massive short selling (another 52 week low today) by bulls convinced we are headed to ATH, OR smart money getting positioned ahead of a break-away gap. I think you are onto something on the sudden-ness of any reversal. I have certainly never seen anything quite like this Ris, and I have been watching UVXY for a while..
It is so strange to see repeated five wave impulses down that are consistently bought with the market moving higher…really uncharted territory imho…
We had a bit of a head fake yesterday. VIX needs to print some green and head North with a purpose. A nice fat engulfing candle would be welome…
3 minute action today…invalid above 2118.67
One data stream 2118 even, one 2118.06…..
I have 2118.06…so far.
Possible fourth wave not quite done….
Doesn’t look like market wants to head down anytime soon based on the action around 2,116-2,117
Yep. Anything other than a swift and decisive reversal is inimical to the immediate bearish count…hard to know what to expect in this bankster infested market…
Lara,
Every day on your analysis you have a link to the “last monthly published charts” where it shows Grand Super Cycle I ending in what looks like late 2000. Beneath that you have Super Cycles (III) (IV) and (V) all ending within a few months of each other (circled). At least that is the way I am reading it (which may be incorrect.) Yet in your Elliott Wave Notations, you define Super Cycle wave lengths as “multi-decade (about 40-70 years) olive.” Am I reading the monthly chart incorrectly in terms of your Super Cycle waves (IV) and (V)? I know in June of last year you published a Grand Super Cycle bear wave count that had Super Cycle (IV) associated with the Great Depression. Or is the latest published monthly chart something completely different than your Grand Super Cycle analysis?
A good point Norman. To see the answer it’s best to look at the Grand Super Cycle chart (attached here for clarity).
Yes, the movement within the correction so far could be moved down one degree.
But I would rather leave it as it is, because the proportion looks okay.
Notice how long impulses last compared to the corrections that follow them. Bear markets tend to be violent and fast. Bull markets persistent, relentless and sustained. Slower.
On this chart look how long Super Cycle (III) lasted and how quick Super Cycle (IV) was to correct it. I’m counting Super Cycle (IV) as the Great Depression, the third wave it corrected lasted over 60 years.
Interesting.
Thanks for your response. I understand what your saying but your “last published monthly chart” does not correspond with the chart you posted above which is the S&P 500 historic bear count for Grand Super Cycle I.
Your “last published monthly chart” shows Cycle Wave V (in teal) which ends Super Cycle (III) in olive, ending in early 2000, not in 1929 like the historic chart you posted above shows.
My question was why the monthly chart does not correspond with your “historic” chart. I am not asking about the movement “since the correction” but the labeling of your “last published monthly chart” at Super Cycle degree to END Grand Super Cycle I, not the correction afterwards.
So it’s either this….
Or this…..
But it cannot be this, right?
You’re right. The problem is the data on my monthly charts doesn’t go back far enough, and I labelled what I had with too high a degree.
I see the problem now. Will fix.
The bigger picture is I think correct at Grand Super Cycle degree, will fix the monthly chart to be the same
2,116.47 moment of truth approaching….
yep — 2116.63 on TOS
Almost time to get shorty 🙂
Yer’ late! 🙂
Patience Vern, patience lol
Wait until after the stop run 🙂
Soooo close to the 2118 target now…
I was looking for some sort of spike or throw-over…we may still get it…feeling a bit lonely on the short side here… 🙂
NASDAQ leading the way down already… Very typical 🙂
Nothing significant happens until SPX drops below 2092ish. That is where the approximate 13day EMA daily line is today. If you look at other large and even smaller reversals to upside and downside, that tends to be a very nice signal. Even on 6/03, big failure of jobs report, SPX could not close below the 13 day EMA. That was first clue that upside was coming.
Selling June 15 13/14 strike bullish put credit spread for 0.30 per contract. I am willing to be assigned 100 shares of VIX etf for each contract at a cost of 13.70 per share if VIX is below 14 next Wed.
FWIW, I think Lara’s new count is spot on. The break out move up from Friday hasn’t had the right feel…I don’t know how else to explain it. Yes prices went up, but it was lacking any real strong momentum. If the new count is correct, it would explain it.
also…looks like an ending diagonal of some sort…on the 5 minute chart.
Yep. A fifth wave extension in that case not possible so final wave up probably underway as we speak…we should start to see some very strong divergence with VIX soon if we are correct…
????
The SPX high took place in ES at 5:20-5:30AM this morning… the equivalent
SPX price ~ 2118….
So IMO S&P 500 made a high at 2118 overnight and then reversed down… If SPX continues down during regular trading and closes down on the day on higher volume…
Then the TOP of this structure is in place! (for Main Bear Counts)
My post from yesterday evening…
“Waiting for 20% to 30% Down… in one day! 1987 again with a twist… this time it continues down after that.” Down after that in Super cycle/Grand Super cycle degree just to be clear.
I have said several times that to me… based on my memory that the price action the last year+ reminds me of pre-1987 price action. This can occur at any time, not just in the fall.
Can’t stay away, Have a Great Week all!
10am GMT 2117.18
I calculated the exact ES to SPX equivalent to be 2117.66 But lets not split hairs.
Post 9:30AM final move may end at any time this morning.
I am not sure when the upward movement is going to complete. Price does not have a whole lot of room to run within the bearish scenario. I do very much agree with you that the reversal when it comes is going to be quite violent. We are seeing in the market, considering no new highs are in place (to say nothing of all the other indices that are very clearly in second waves and nowhere near new highs), historic levels of complacency. Even SDS made a new 52 week low yesterday although SPX did not make a new 52 week high. I am short this market. Strange days indeed!
One more wave up methinks….
Not saying it will begin with a move like that… But I am saying that a move like that is very possible somewhere as it’s moving down. Although in 1987… the market was at a juncture were it may have broken out higher or lower. Now it’s about the same with the vast majority thinking a breakout higher.
Have to go now, may check in tonight.
How long can UVXY sink without the reverse split? Under $9.50 now.
Interesting 1987 article:
In Boris Schlossberg article “Timing Is Everything” (Investepedia) he writes briefly about the “Stock Market Crash of 1987’. He indicates that “one of the biggest gains in stock market history occurred on October 19, 1987, during the day of its greatest crash. On that day, stocks had declined a mind-harrowing 23% by the end of the day, but at around 1:30 p.m., they staged a massive rally that saw the Dow Jones and S&P indexes vertical off the bottom, rising more than 10% before running out of steam and turning down to end the day on the lows. While most traders that day lost money, those who bought that bottom at 1:30 p.m. and sold their positions an hour later were rewarded with some of the best shortterm gains in stock market history. Conversely, traders unfortunate enough to have shorted at 1:30 p.m. only to cover in panic an hour later held the dubious distinction of losing money on their shorts during the day of stock market’s greatest decline.”1 To simply put it, timing is pretty much everything as he would indicate, without timing winning and losing is imperative to either profit in further trading, or losing substantial amounts of money in your bank account.
http://www.tradersworld.com Mar/Apr/May 2016 154
This time the market will not recover before the end of the year & continue much higher in a Bull Market… This time just the opposite.
Thanks David.
Interesting read and very true.
That was the all-time most spectacular display of banksterism on record. It was incredible. They are bolder today so I suspect we are going to see something equally or more spectacular before this is all said and done. Remember last August? Great example of volatility run amuck! Thanks for the reminder David.
I thought we only analyze cash market not futures as previously we discounted moves in futures market. Am I missing something?
They are connected in terms of price… Only the wave patterns may be different. But for wave purposes only SPX price must used. For reversals using other technicals ES is very valid. Remember the vast majority of traders… us the E-mini (ES) to trade the S&P 500. So those emotional patterns are vaild.
All I am saying is that the ES reversed overnight at a key point… That is a strong signal that SPX will also reverse today.
3 Day chart.
Looks slimier to the weekly?
The slimy weekly looks very similar to the 3 day chart.
Just saw this now. Really…. the year I plan on using them the most?
… For anyone who hasn’t heard…
http://www.wsj.com/articles/sec-moves-to-curb-leveraged-etfs-1465205401
I could not read the article as I do not have a subscription but that title speaks volumes. That kind of possible restriction is only the beginning. I suspect sometime close to the end of the bear market you could see an attempt at an outright ban of short selling….
Sorry, I can not read wsj w/o subscription either. Try:
http://www.efinancialnews.com/story/2016-06-07/us-regulators-move-to-curb-leveraged-etfs?mod=rss-home
I googled “SEC Moves to Curb Leveraged ETFs”
If US market mimics the European price action, it looks like we have yet to see minuette waves three, four and five of minute five of minor five of intermediate C of primary 2 up complete.
Appreciate your giving a zoomed in “were are we”. Thanks.
FTSE and Nasdaq charts to be published later today. Charts only.
Aha! For literally weeks now, I have had this nagging and persistent feeling – “The wave count does not call for it but this market is displaying a volatility profile suggestive of a top higher than minor degree!”
Now the wave count does! 🙂
I’m first tonight! How ’bout that?