
Downwards movement was expected.
Price made a lower high and a lower low for the session.
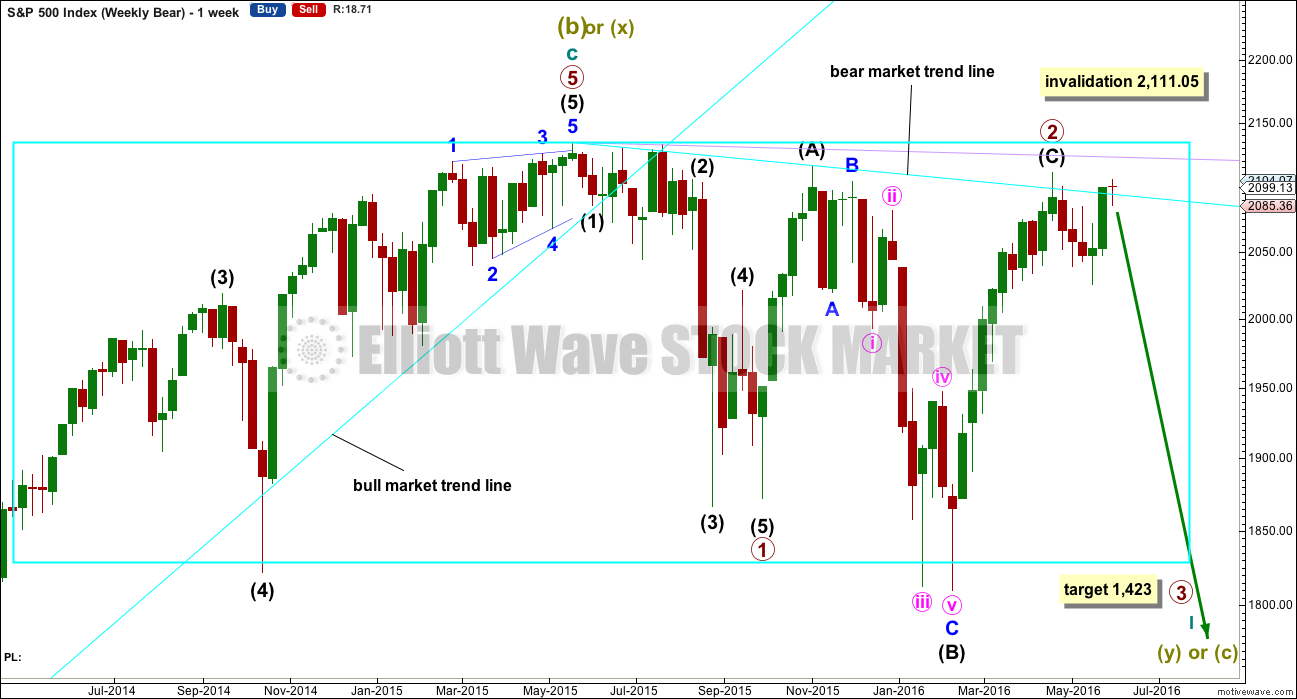
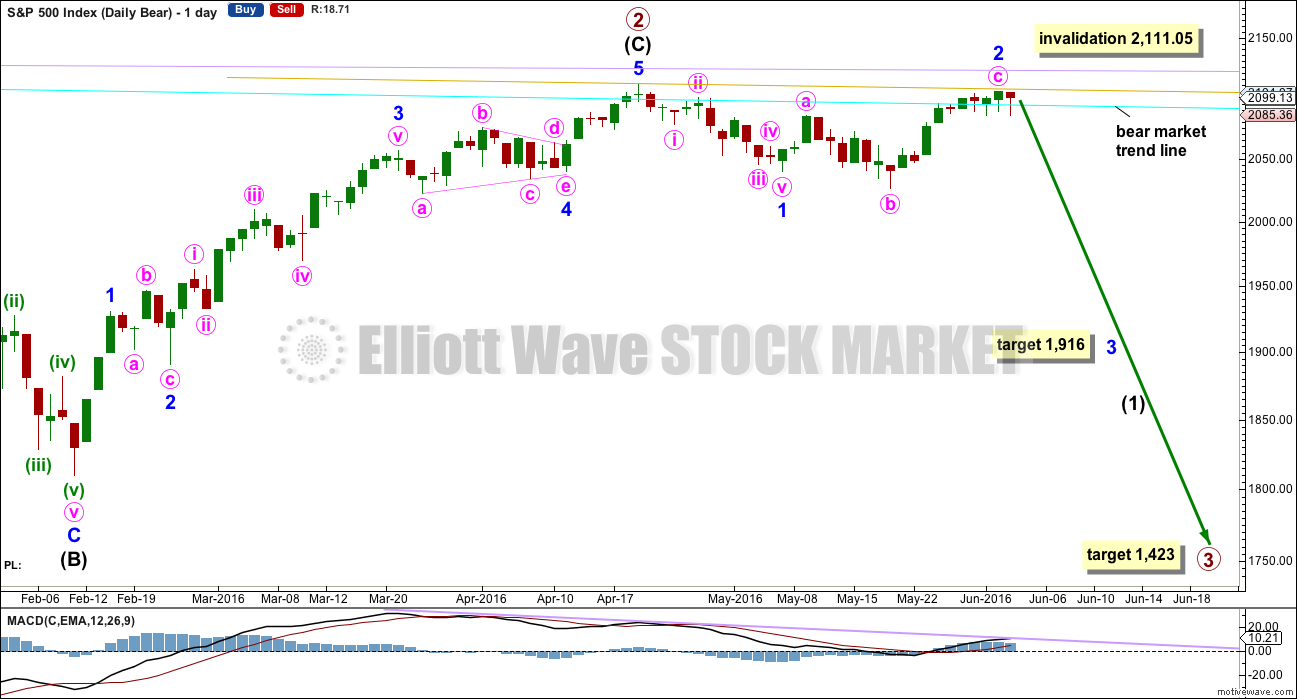
Summary: Downwards movement is still expected for next week; a first wave down is unfolding. The mid term target at 1,916 may be met in another 20 sessions. The long term target at 1,423 may still be another 25 or 28 weeks away. The bottom line: price has so far made a series of lower lows and lower highs since May 2015, and so far each rally has been more than fully retraced. Until proven otherwise, this market is a bear market.
Last published monthly charts are here.
New updates to this analysis are in bold.
BEAR ELLIOTT WAVE COUNT
WEEKLY CHART
Click chart to enlarge.
The box is added to the weekly chart. Price has been range bound for months. A breakout will eventually happen. The S&P often forms slow rounding tops, and this looks like what is happening here at a monthly / weekly time frame.
Primary wave 1 is complete and lasted 19 weeks. Primary wave 2 is over lasting 28 weeks.
An expectation for duration of primary wave 3 would be for it to be longer in duration than primary wave 1. If it lasts about 31 weeks, it would be 1.618 the duration of primary wave 1. It may last about a Fibonacci 34 weeks in total, depending on how time consuming the corrections within it are. But it may not exhibit a Fibonacci duration, so the expectations given here can be a rough guide only.
Primary wave 2 may be a rare running flat. Just prior to a strong primary degree third wave is the kind of situation in which a running flat may appear. Intermediate wave (B) fits perfectly as a zigzag and is a 1.21 length of intermediate wave (A). This is within the normal range for a B wave of a flat of 1 to 1.38.
Within primary wave 3, no second wave correction may move beyond its start above 2,111.05.
DAILY CHART
Click chart to enlarge.
If intermediate wave (C) is over, then the truncation is small at only 5.43 points. This may occur right before a very strong third wave pulls the end of intermediate wave (C) downwards.
The next wave down for this wave count would be a strong third wave at primary wave degree. At 1,423 primary wave 3 would reach 2.618 the length of primary wave 1. This is the appropriate ratio for this target because primary wave 2 is very deep at 0.91 of primary wave 1. If this target is wrong, it may be too high. The next Fibonacci ratio in the sequence would be 4.236 which calculates to a target at 998. That looks too low, unless the degree of labelling is moved up one and this may be a third wave down at cycle degree just beginning. I know that possibility right now may seem absurd, but it is possible.
Alternatively, primary wave 3 may not exhibit a Fibonacci ratio to primary wave 1. When intermediate waves (1) through to (4) within the impulse of primary wave 3 are complete, then the target may be calculated at a second wave degree. At that stage, it may change or widen to a small zone.
Minor wave 2 fits perfectly as a very common expanded flat correction. Minute wave b is a 1.3 length of minute wave a, nicely within normal range of 1 to 1.38. If minute wave c is complete, it would be 5.86 points longer than 1.618 the length of minute wave a. If it continues a little higher then it may find resistance at the gold trend line which is a copy of the bear market trend line placed on the high labelled primary wave 2.
Minor wave 2 may not move beyond the start of minor wave 1 above 2,111.05. This is the risk to short positions at this stage.
If any members are choosing to enter short positions here, then manage risk carefully: Do not invest more than 3-5% of equity on any one trade and always use a stop loss to contain losses. Today short positions must now consider the alternate bear wave count published below. Both this main and the alternate expect new lows below 1,810.10, but their invalidation points are slightly different.
HOURLY CHART
Click chart to enlarge.
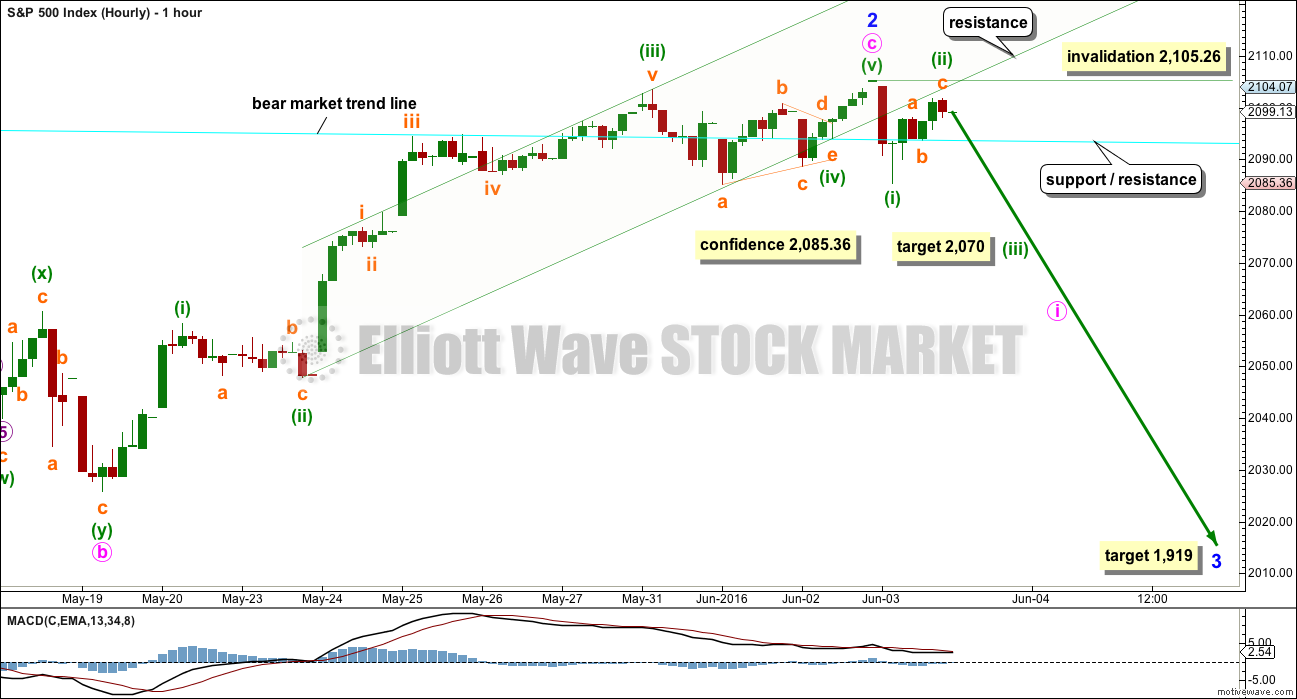
Minor wave 2 may be a complete expanded flat correction. Minor wave 3 down, within intermediate wave (1), may have begun on Friday.
Minuette wave (ii) so far has found resistance at the lower edge of the parallel channel about minute wave c.
At 2,070 minuette wave (iii) would reach 1.618 the length of minuette wave (i).
A new low on Monday below 2,085.36 would add confidence to this wave count.
Minuette wave (ii) may not move beyond the start of minuette wave (i) above 2,105.26.
At 1,919 minor wave 3 would reach 2.618 the length of minor wave 1.
ALTERNATE HOURLY CHART
Click chart to enlarge.
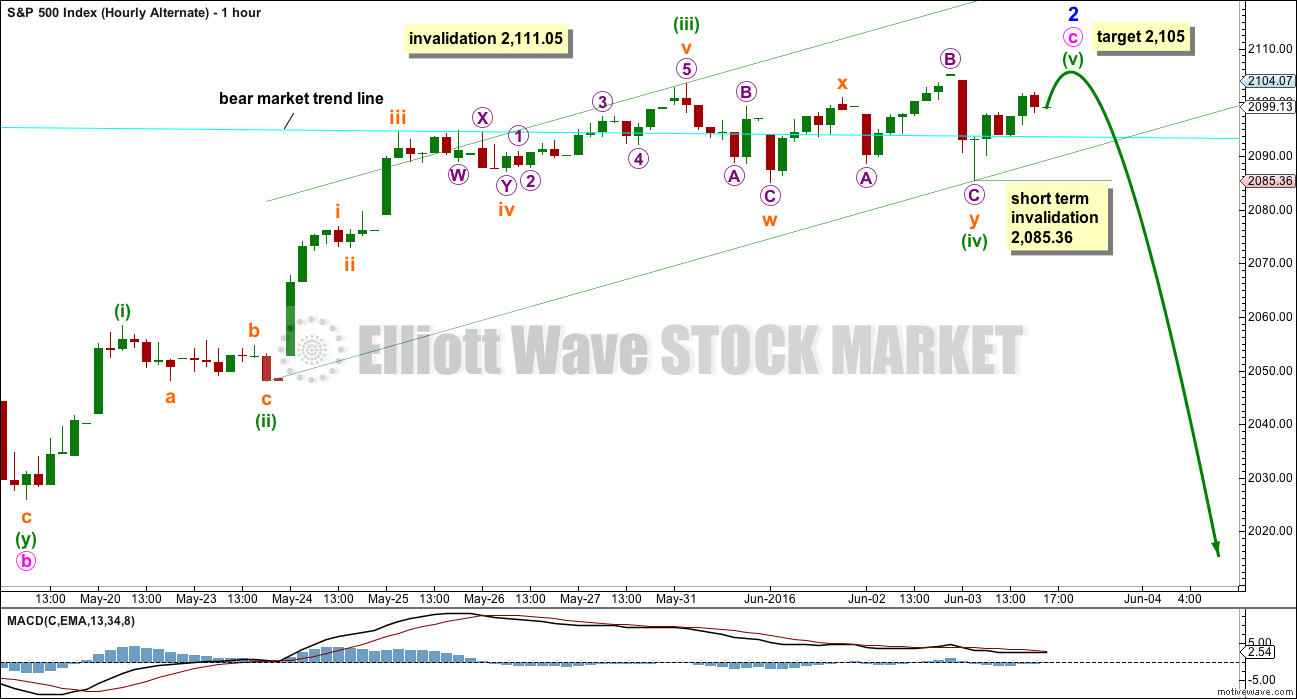
It is still possible that minor wave 2 is not over and may continue higher on Monday.
Within minute wave c, here minuette wave (iv) is now seen as a double combination: zigzag – X – flat. At 2,105 minuette wave (v) would reach 0.618 the length of minuette wave (i).
Within minuette wave (v), no second wave correction may move beyond the start of its first wave below 2,085.36.
The channel is redrawn using Elliott’s second technique. A breach of the lower edge of this channel would now provide reasonable indication of a trend change.
ALTERNATE BEAR ELLIOTT WAVE COUNT
WEEKLY CHART
Click chart to enlarge.
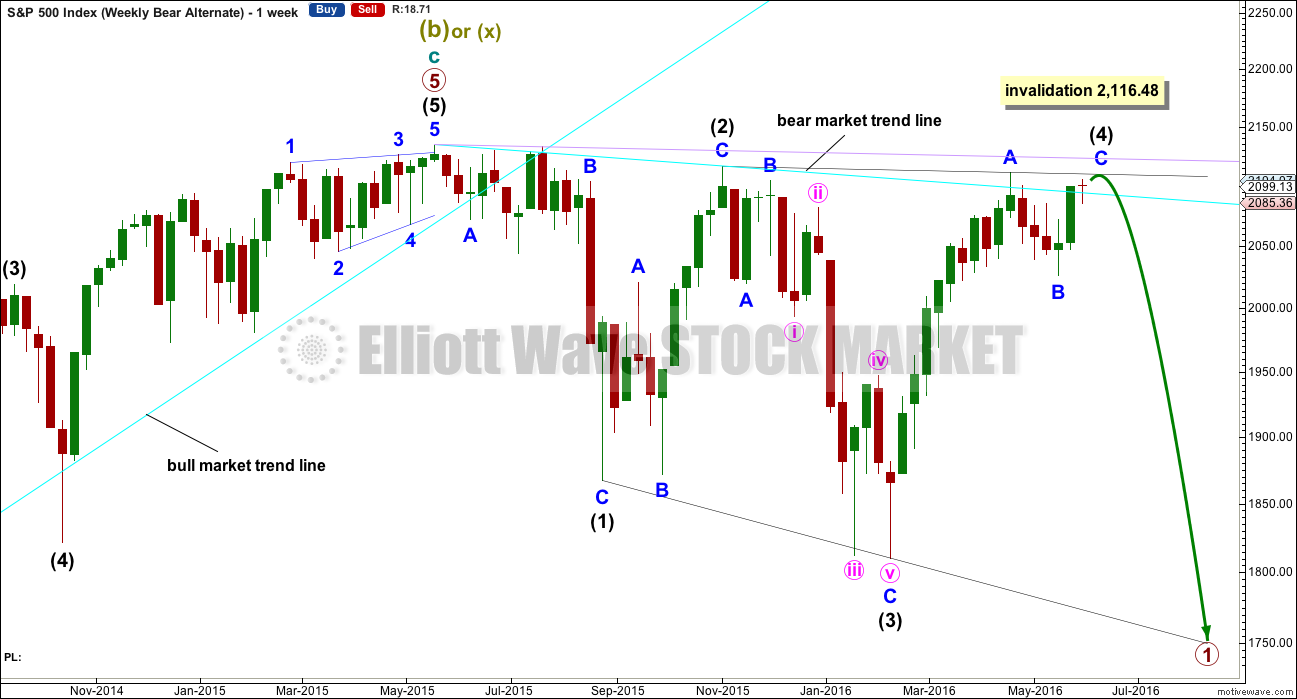
There are two possible structures for the start of a new trend, either an impulse (main wave count) or a leading diagonal (this alternate).
An impulse is more common than a leading diagonal which reduces the probability of this wave count to an alternate. However, the main wave count also has a rare running flat, so on balance this alternate should still be considered.
Within a leading diagonal, subwaves 2 and 4 must subdivide as zigzags. They are commonly very deep, between 0.66 to 0.81 the prior wave. Here intermediate wave (2) is 0.93 of intermediate wave (1) and so far intermediate wave (4) is 0.98 of intermediate wave (3). Both these subwaves are much deeper than normal, so this reduces the probability of this wave count a little more.
While leading diagonals are not as common as impulses for first waves, leading expanding diagonals are less common still. They are not exactly rare structures, but they are not common. This diagonal would be expanding: the third wave is longer than the first, the fourth wave is longer than the second, and the trend lines diverge. All rules are met.
Subwaves 1, 3 and 5 are most commonly zigzags within leading diagonals, but sometimes they may also appear to be impulses. Here so far intermediate waves (1) and (3) fit perfectly as zigzags.
Intermediate wave (4) may end a little higher when price comes to touch the (1) – (4) trend line. This line is drawn from the end of intermediate wave (1) along to the high of minor wave A within intermediate wave (4).
Intermediate wave (4) may not move beyond the end of intermediate wave (2) above 2,116.48.
Leading diagonals may not have truncated fifth waves. Intermediate wave (5) must move below the end of intermediate wave (1) at 1,810.10. Intermediate wave (5) must be longer in length than intermediate wave (3) which was 306.38 points.
If the next wave down does not show an increase in momentum or volume beyond intermediate wave (3), then this would be an explanation.
DAILY CHART
Click chart to enlarge.
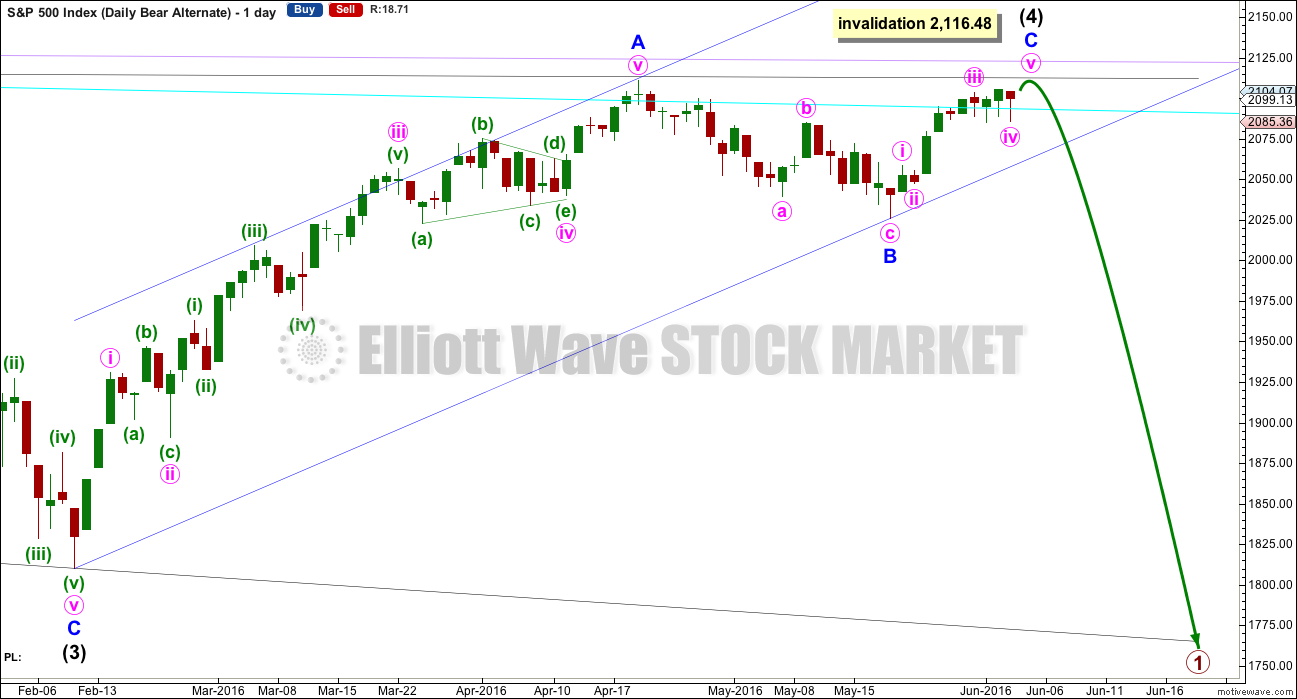
Intermediate wave (4) must subdivide as a zigzag. Within the zigzag, minor wave C is likely to move at least slightly above the end of minor wave A at 2,111.05 to avoid a truncation.
No target is given for intermediate wave (4) to end because the best guide is likely to be the (1) – (4) trend line.
This wave count must see the downwards wave labelled minute wave c within minor wave B as a five wave structure. This is possible, but it looks forced on the daily and hourly chart levels. This reduces the probability of this wave count.
Momentum and volume of the next wave down would indicate which bear wave count is correct (if price remains below 2,111.05). A new high above 2,111.05 would invalidate the main bear wave count and confirm this alternate.
When the leading diagonal is complete, then a very deep second wave correction would be expected. This alternate wave count expects the box on the first weekly chart to remain essentially intact several more months.
BULL ELLIOTT WAVE COUNT
WEEKLY CHART
Click chart to enlarge.
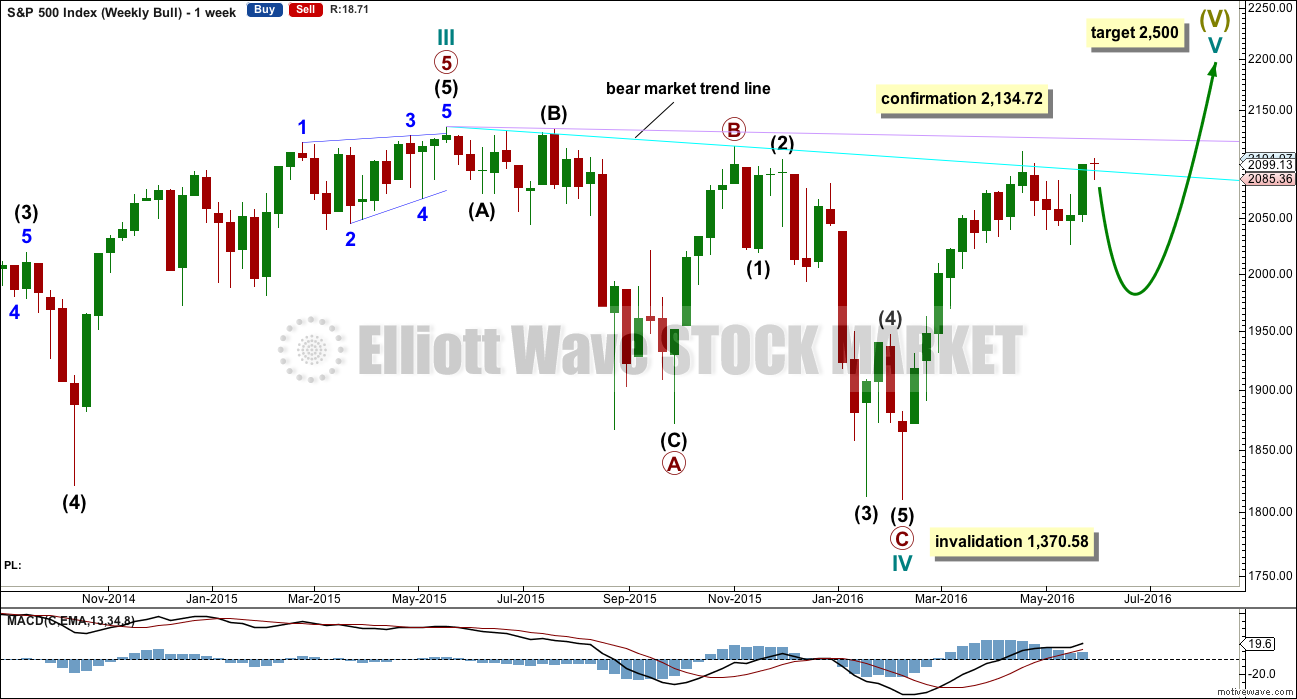
Cycle wave IV is seen as a complete flat correction. Within cycle wave IV, primary wave C is still seen as a five wave impulse.
Intermediate wave (3) has a strong three wave look to it on the weekly and daily charts. For the S&P, a large wave like this one at intermediate degree should look like an impulse at higher time frames. The three wave look substantially reduces the probability of this wave count. Subdivisions have been checked on the hourly chart, which will fit.
Cycle wave II was a shallow 0.41 zigzag lasting three months. Cycle wave IV may be a complete shallow 0.19 regular flat correction, exhibiting some alternation with cycle wave II.
At 2,500 cycle wave V would reach equality in length with cycle wave I.
Price remains below the final bear market trend line. This line is drawn from the all time high at 2,134.72 to the swing high labelled primary wave B at 2,116.48 on November 2015. This line is drawn using the approach outlined by Magee in the classic “Technical Analysis of Stock Trends”. To use it correctly we should assume that a bear market remains intact until this line is breached by a close of 3% or more of market value. In practice, that price point would be a new all time high which would invalidate any bear wave count.
This wave count requires price confirmation with a new all time high above 2,134.72.
While price has not made a new high, while it remains below the final bear market trend line and while technical indicators point to weakness in upwards movement, this very bullish wave count comes with a strong caveat. I still do not have confidence in it.
The invalidation point will remain on the weekly chart at 1,370.58. Cycle wave IV may not move into cycle wave I price territory.
This invalidation point allows for the possibility that cycle wave IV may not be complete and may continue sideways for another one to two years as a double flat or double combination. Because both double flats and double combinations are both sideways movements, a new low substantially below the end of primary wave C at 1,810.10 should see this wave count discarded on the basis of a very low probability long before price makes a new low below 1,370.58.
DAILY CHART
Click chart to enlarge.
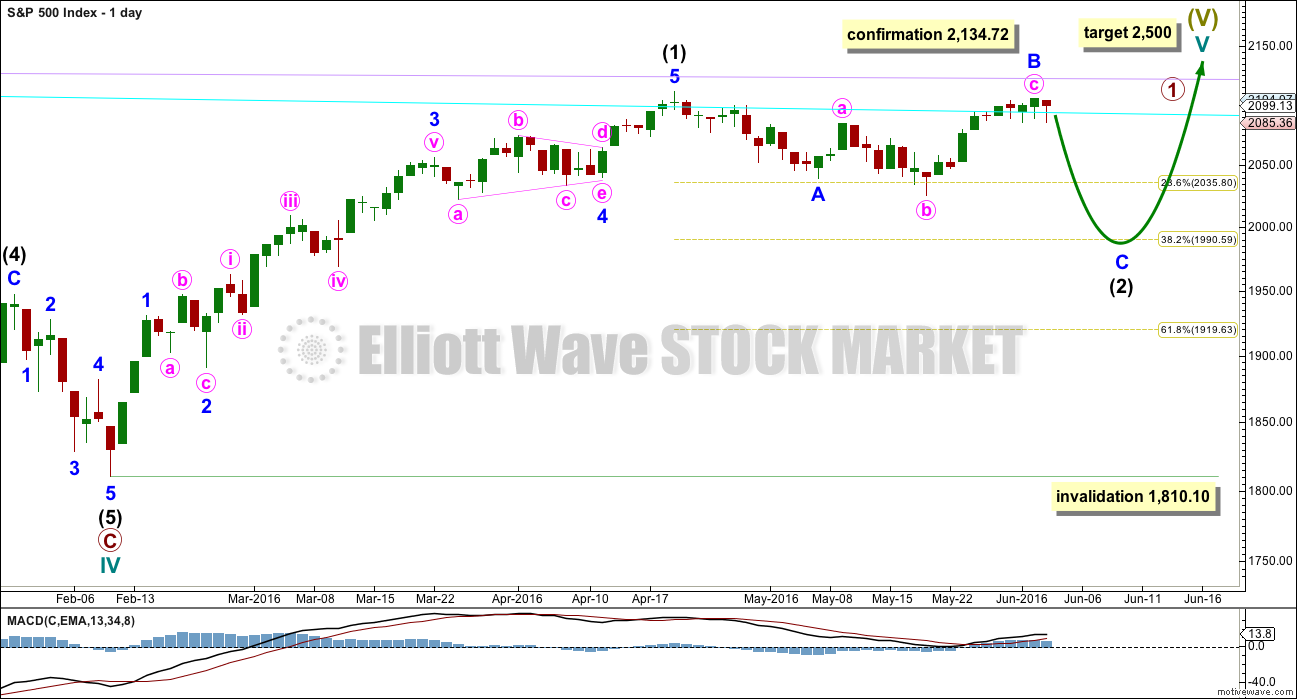
If the bull market has resumed, it must begin with a five wave structure upwards at the daily and weekly chart level. That may today be complete. The possible trend change at intermediate degree still requires confirmation in the same way as the alternate hourly bear wave count outlines before any confidence may be had in it.
Intermediate wave (2) may be an incomplete zigzag. Within the zigzag, minor wave B may now be a complete expanded flat. At 1,988 minor wave C would reach 1.618 the length of minor wave A. This ratio is used for this target because intermediate wave (2) should be expected to be relatively deep. If this target is wrong, it may not be low enough. The next likely target would be the 0.618 Fibonacci ratio at 1,920.
In the long term, this wave count absolutely requires a new high above 2,134.72 for confirmation. This would be the only wave count in the unlikely event of a new all time high. All bear wave counts would be fully and finally invalidated.
TECHNICAL ANALYSIS
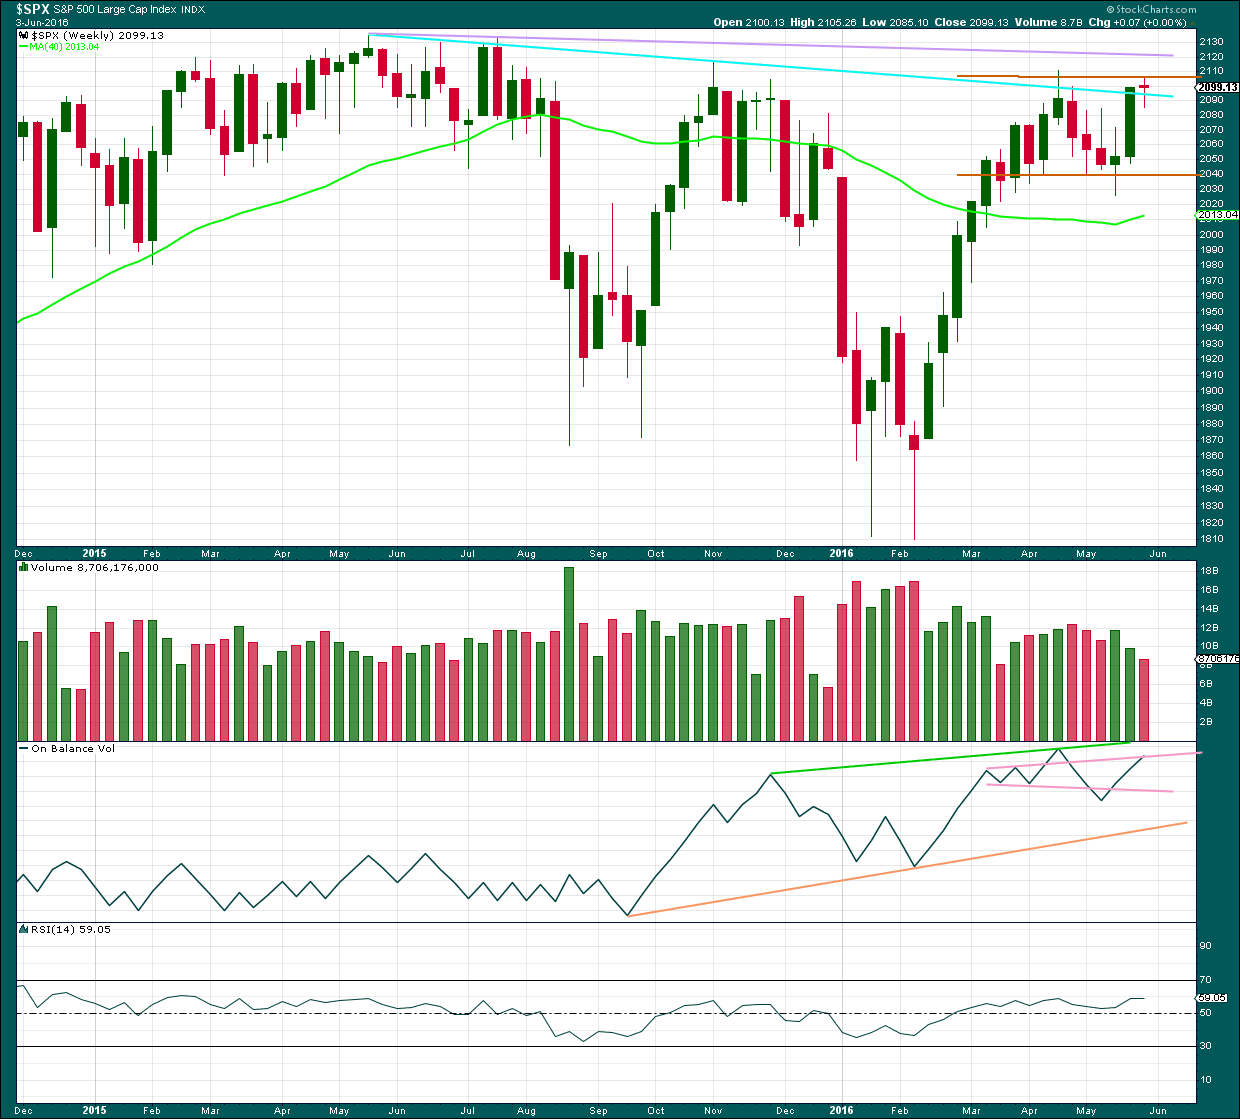
WEEKLY CHART
Click chart to enlarge. Chart courtesy of StockCharts.com.
Price is the final determinator and the most important aspect of market analysis. So what has price been doing since the all time high in May 2015?
Price has so far made lower lows and lower highs. Price continues to find resistance about the cyan trend line, and has not been able to come up to test the lilac line. So far each time price comes up to the cyan line it has been repelled there.
This week completes a small doji pattern with lighter volume. This represents a balance between bulls and bears for the week and indecision. The long lower wick is slightly bullish while the red colour is slightly bearish. Price is finding resistance about the cyan trend line.
On Balance Volume still shows divergence with price: from the high in November 2015 to the high in April 2016, price made a lower high while OBV made a higher high. This is hidden bearish divergence; it indicates weakness in price.
Volume is declining while price has essentially moved sideways for the last ten weeks in a zone delineated by brown trend lines. The longer price meanders sideways the closer a breakout will be. During this sideways range, it is a downwards week which has strongest volume suggesting a downwards breakout may be more likely.
The strong green candlestick for last week was the most bullish signal for some time. With this now followed by a doji, some of this bullishness is dissipated.
The 40 week moving average has turned upwards, another bullish signal. However, this has happened before in October 2015 yet it was followed by a strong downwards wave. On its own this bullish signal does not necessarily mean price is going to make new all time highs.
DAILY CHART
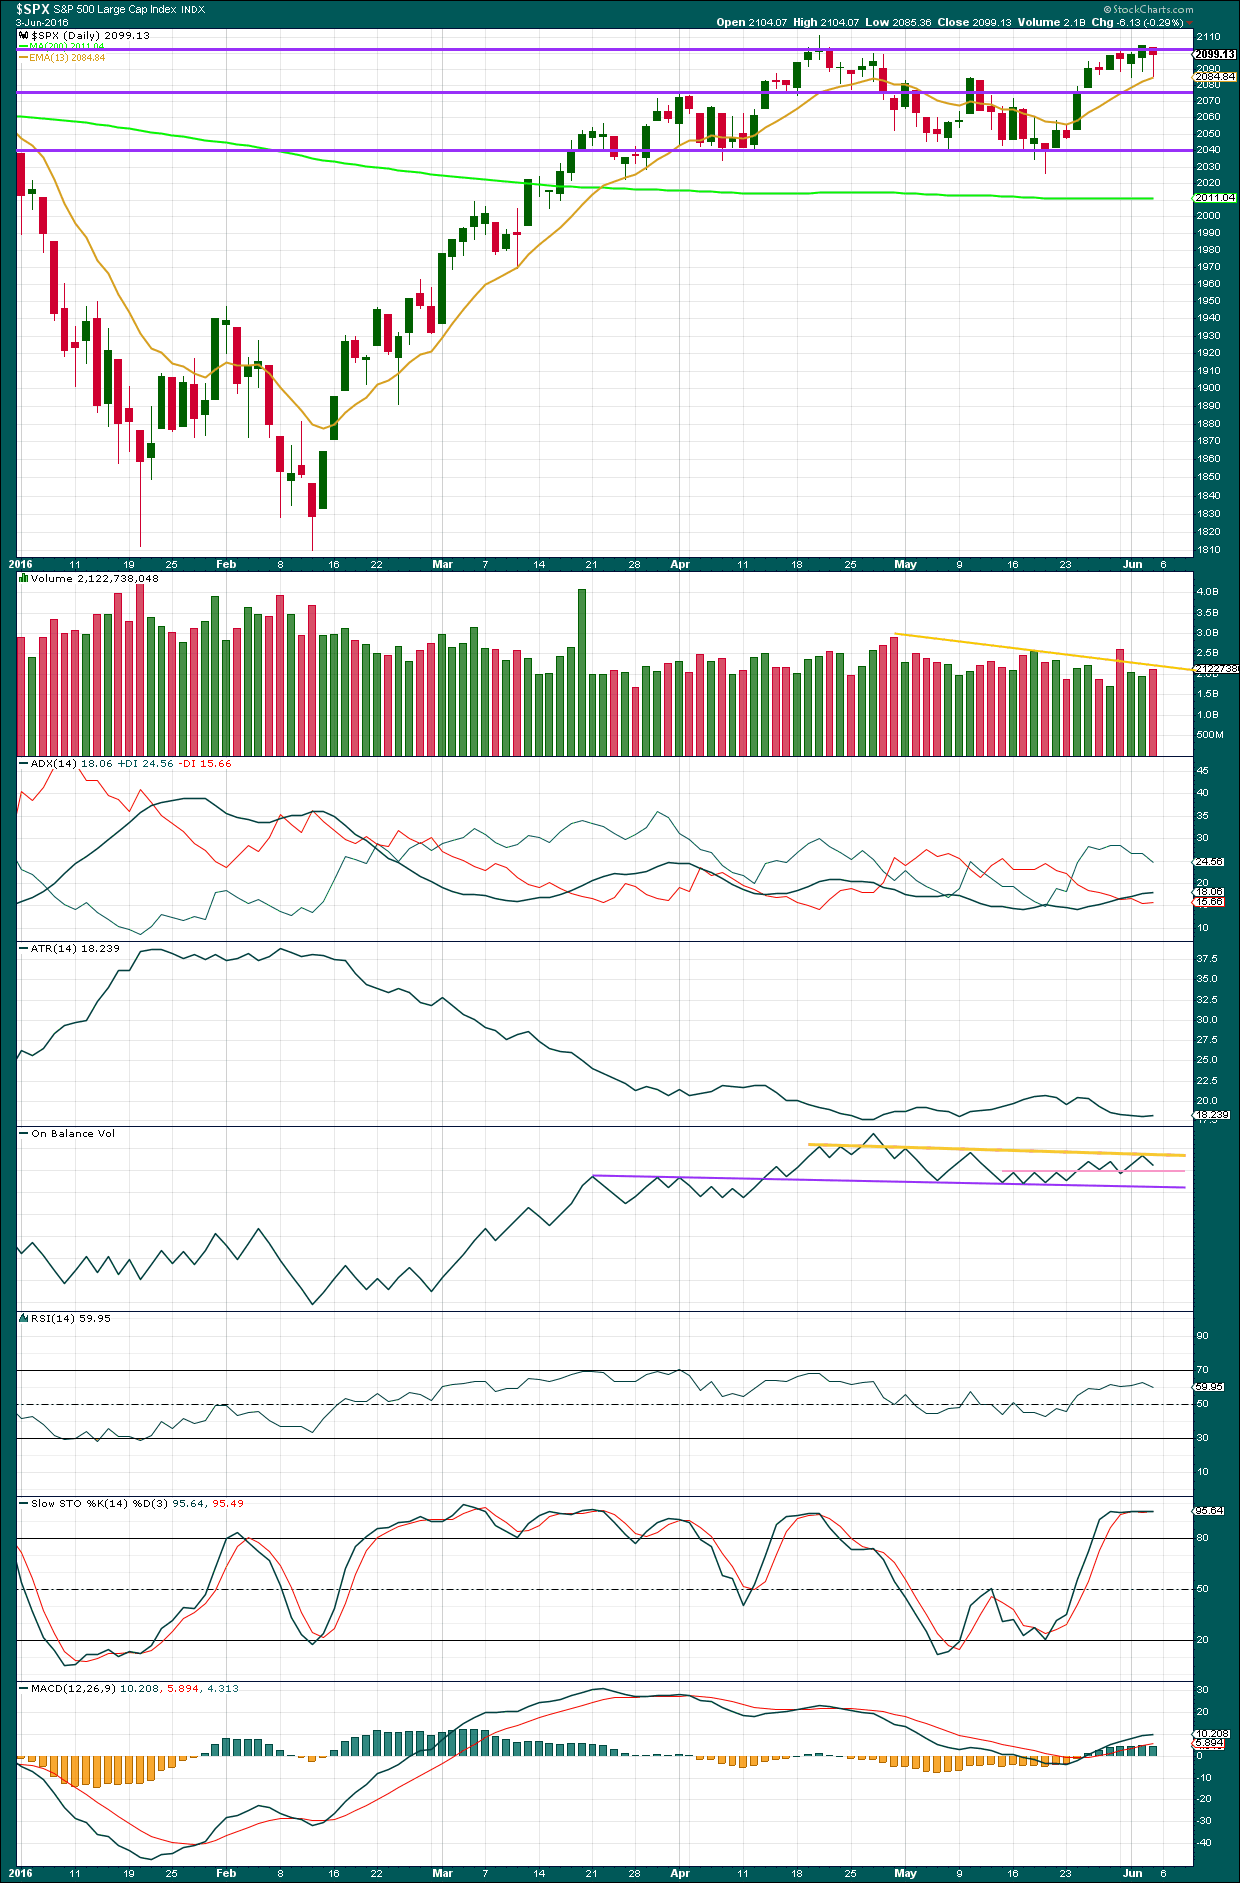
Click chart to enlarge. Chart courtesy of StockCharts.com.
Volume data on StockCharts is different to that given from NYSE, the home of this index. Comments on volume will be based on NYSE volume data when it differs from StockCharts.
Price is range bound between support about 2,040 and resistance about 2,100. Overall, volume is declining as price moves sideways. During this range, it is three downwards days which have strongest volume (ignoring the options expiry date of 18th of March): 29th of April, 28th of April, and 31st of May. This suggests a downwards breakout is more likely than upwards.
Friday’s candlestick completes another hanging man pattern. There are two of these now at or close to the high of 2nd June: the first was on 31st of May and now another on 3rd June. The long lower wick of a hanging man is bullish, so this pattern requires bearish confirmation in the next session. Bearish confirmation would come with an open below the real body of the hanging man, or preferably a close below the real body of the hanging man.
ADX still indicates an upwards trend is in place.
ATR is overall flat, but at the end of the week may be slightly increasing. It may be beginning to indicate a new trend, but this is not yet clear. What is clear is during the last upwards swing ATR declined. Overall, during this range, ATR increases on downwards swings and declines on upwards swings. This indicates more activity from selling pressure than buying pressure.
On Balance Volume has again found resistance at the yellow line, which is reinforced. It now has some reasonable technical significance; although it has been broken before, yet OBV returned back below it. A break below the pink line would be a weak bearish signal. A break below the purple line would be a strong bearish signal. A break above the yellow line would be a reasonable bullish signal.
There is some divergence between OBV and price: from the high of 10th of May, price has made a higher high but OBV has made a slightly lower high. This is regular bearish divergence and indicates exhaustion for the bulls and underlying weakness in price.
RSI exhibits no divergence with price to indicate weakness. RSI is not yet overbought. There is room for price to rise further.
Stochastics exhibits weak bearish divergence with price at the end of this week, but I have learned to not give this too much weight.
VOLATILITY – INVERTED VIX MONTHLY CHART
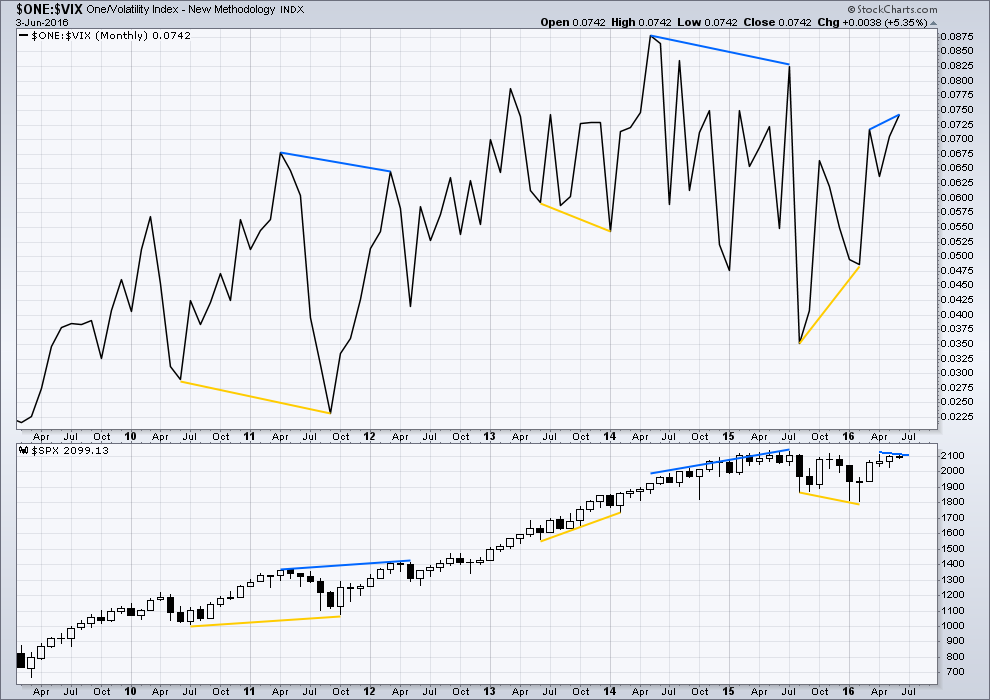
Click chart to enlarge. Chart courtesy of StockCharts.com.
Several instances of large divergence between price and VIX (inverted) are noted here. Blue is bearish divergence and yellow is bullish divergence (rather than red and green, for our colour blind members).
Volatility declines as inverted VIX rises, which is normal for a bull market. Volatility increases as inverted VIX declines, which is normal for a bear market. Each time there is strong multi month divergence between price and VIX, it was followed by a strong movement from price: bearish divergence was followed by a fall in price and bullish divergence was followed by a rise in price.
At this stage, inverted VIX shows hidden bearish divergence with price: the high in April for price has not yet been exceeded yet VIX has made a higher high. This indicates underlying weakness in price, which is normal to see during a bear market rally.
VOLATILITY – INVERTED VIX DAILY CHART
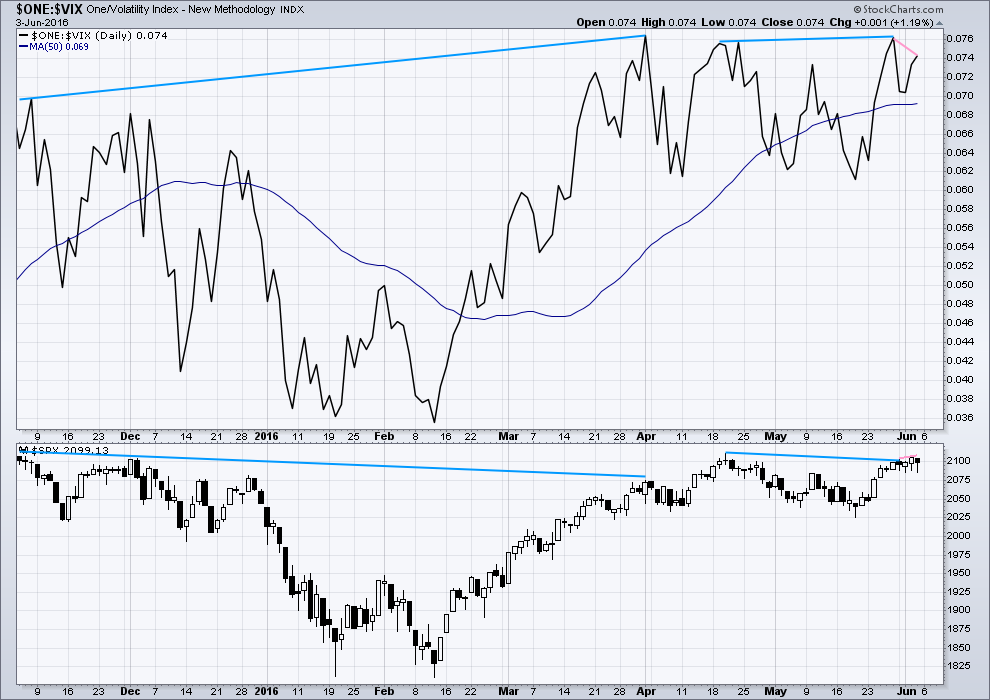
Click chart to enlarge. Chart courtesy of StockCharts.com.
There are two instances of hidden bearish divergence noted on this daily chart of price and VIX (blue lines). VIX makes higher highs as price makes lower highs. The decline in volatility is not matched by a corresponding rise in price. Price is weak.
There is also very short term regular bearish divergence (pink lines). VIX did not make a corresponding new high as price made a new high this week. This indicates exhaustion for bulls and underlying weakness in price.
While I would not give much weight to divergence between price and many oscillators, such as Stochastics, I will give weight to divergence between price and VIX. Analysis of the monthly chart for the last year and a half shows it to be fairly reliable.
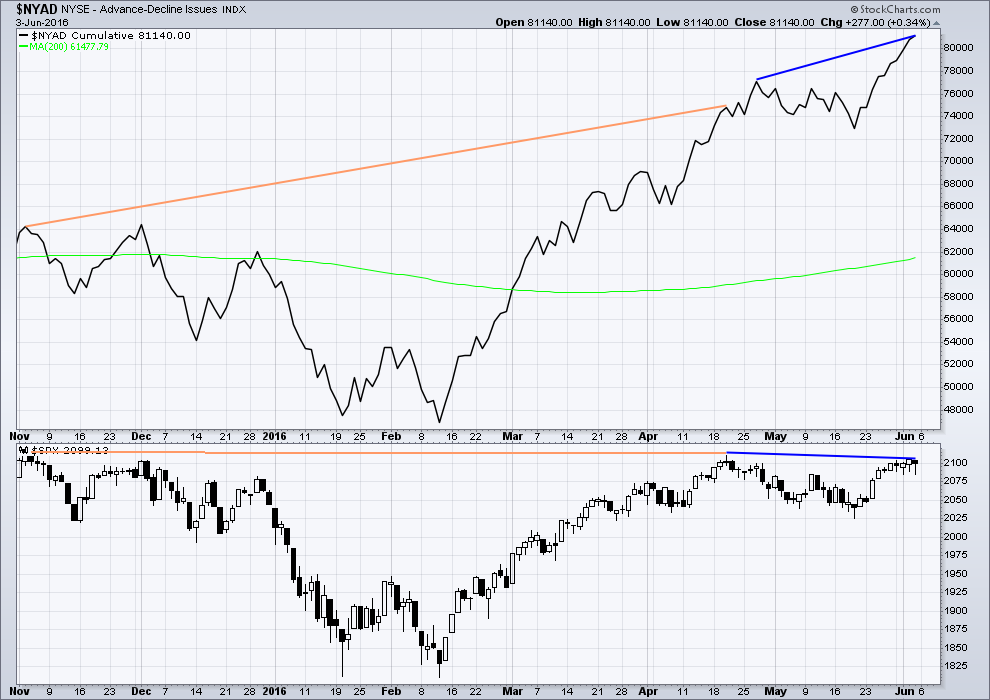
BREADTH – ADVANCE DECLINE LINE
Click chart to enlarge. Chart courtesy of StockCharts.com.
With the AD line increasing, this indicates the number of advancing stocks exceeds the number of declining stocks. This indicates that there is breadth to prior upwards movement.
From November 2015 to 20th April, the AD line made new highs while price far failed to make a corresponding new high. This indicates weakness in price; the increase in market breadth is unable to be translated to increase in price (orange lines).
The 200 day moving average for the AD line is now increasing. This alone is not enough to indicate a new bull market. During November 2015 the 200 day MA for the AD line turned upwards and yet price still made subsequent new lows.
There is now double hidden bearish divergence between price and the AD line (dark blue lines). The AD line has made a new swing high above the prior high of 20th of April. This increase in breadth to upwards movement has failed to translate into a corresponding rise in price. Price has failed to make a new high above 20th of April. This indicates weakness in price.
Price made a lower high and a lower low on the last day of this week, finishing with a red candlestick. Price moved lower yet the AD line moved higher. This indicates that although market breadth was strong for Friday it could not translate into a corresponding rise in price. Again, price is weak.
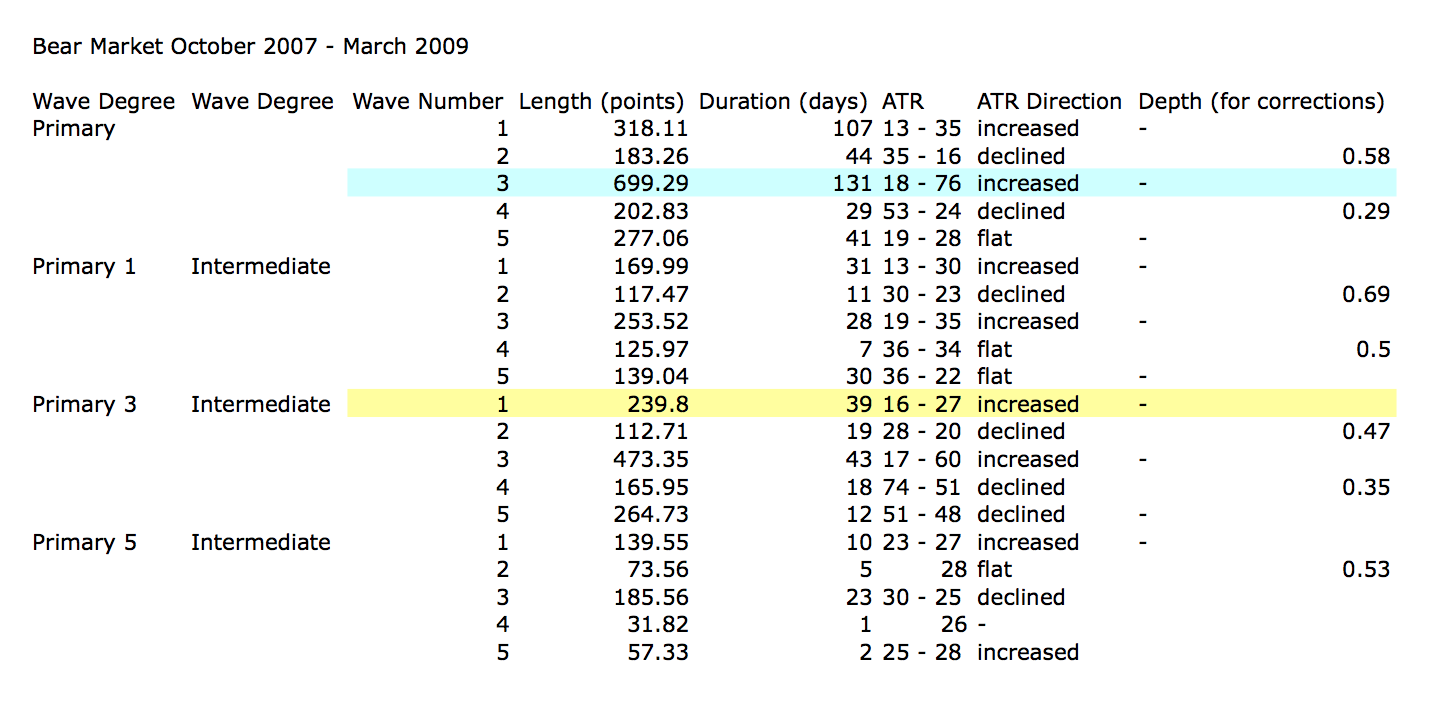
ANALYSIS OF LAST MAJOR BEAR MARKET OCTOBER 2007 – MARCH 2009
Click to enlarge.
In looking back to see how a primary degree third wave should behave in a bear market, the last example may be useful.
Currently, the start of primary wave 3 now may be underway for this current bear market. Currently, ATR sits about 19. With the last primary degree third wave (blue highlighted) having an ATR range of about 18 to 76, so far this one looks about right.
The current wave count sees price in an intermediate degree first wave within a primary degree third wave. The equivalent in the last bear market (yellow highlighted) lasted 39 days and had a range of ATR from 16 – 27.
To see some discussion of this primary degree third wave in video format click here.
Click chart to enlarge.
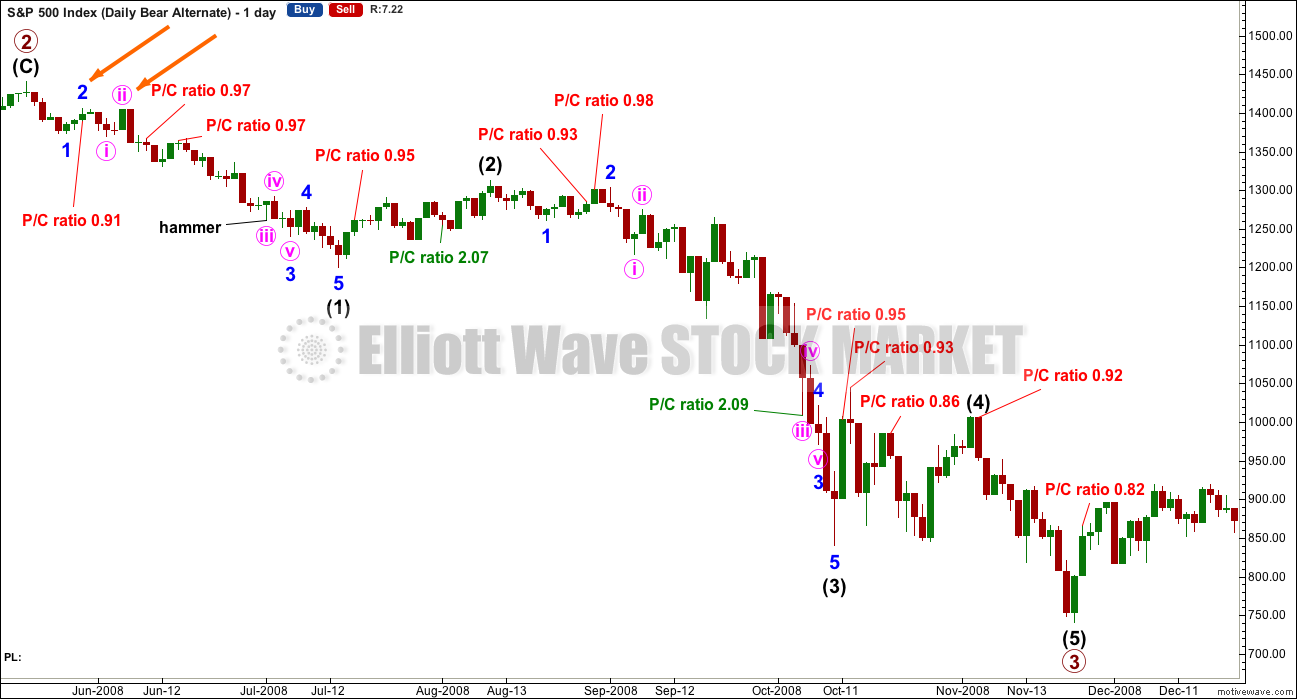
This chart is shown on an arithmetic scale, so that the differences in daily range travelled from the start of primary wave 3 to the end of primary wave 3 is clear.
Primary wave 3 within the last bear market from October 2007 to March 2009 is shown here. It started out somewhat slowly with relatively small range days. I am confident of the labelling at primary degree, reasonably confident of labelling at intermediate degree, and uncertain of labelling at minor degree. It is the larger degrees with which we are concerned at this stage.
During intermediate wave (1), there were a fair few small daily doji and ATR only increased slowly. The strongest movements within primary wave 3 came at its end. If another primary degree third wave is about to unfold, then the historic equivalent point would be early on within intermediate wave (1). There were many small range days and quite a few doji during this movement. Intermediate wave (1) moved relatively slowly and with some hesitancy. With this historic context we must now allow for deep second wave corrections and small range days in the current wave count.
It appears that the S&P behaves somewhat like a commodity during its bear markets. That tendency should be considered again here.
Looking more closely at early corrections within primary wave 3 to see where we are, please note the two identified with orange arrows. Minor wave 1 lasted a Fibonacci 5 days and minor wave 2 was quick at only 2 days and shallow at only 0.495 the depth of minor wave 1.
Minute wave ii, the next second wave correction, was deeper. Minute wave i lasted 3 days and minute wave ii was quick at 2 days but deep at 0.94 the depth of minute wave i.
What this illustrates clearly is there is no certainty about second wave corrections. They do not have to be brief and shallow at this early stage; they can be deep.
This chart will be republished daily for reference. The current primary degree third wave which this analysis expects does not have to unfold in the same way, but it is likely that there may be similarities.
Put / Call ratios are added from data published at CBOE. This ratio is the index ratio published, not the ratio specifically for the S&P500. It should be a reasonable indicator of sentiment. Only values above 2 and below 1, extremes, are noted. A low P/C ratio indicates more long positions than short, so it is interpreted as bearish, a contrarian indicator. A high P/C ratio indicates more short than long positions, so it is interpreted as bullish, a contrarian indicator.
There were two instances where the P/C ratio gave a bullish extreme above 2 during primary wave 3. One instance happened right at the end of the middle of the third wave. My conclusion is that the P/C ratio may be a reasonable sentiment indicator, but it is not to be taken definitively. It should be one piece of information weighed up alongside other information. Currently, the index P/C ratio is not extreme. Only extremes will be noted.
DOW THEORY
The last major lows within the bull market are noted below. Both the industrials and transportation indicies have closed below these price points on a daily closing basis; original Dow Theory has confirmed a bear market. By adding in the S&P500 and Nasdaq a modified Dow Theory has not confirmed a new bear market.
Within the new bear market, major highs are noted. For original Dow Theory to confirm the end of the current bear market and the start of a new bull market, the transportation index needs to confirm. It has not done so yet.
Major lows within the prior bull market:
DJIA: 15,855.12 (15th October, 2014) – closed below on 25th August, 2015.
DJT: 7,700.49 (12th October, 2014) – closed below on 24th August, 2015.
S&P500: 1,821.61 (15th October, 2014) – has not closed below this point yet.
Nasdaq: 4,117.84 (15th October, 2014) – has not closed below this point yet.
Major highs within the new bear market:
DJIA: 17,977.85 (4th November, 2015) – closed above on 18th April, 2016.
DJT: 8,358.20 (20th November, 2015) – has not closed above this point yet.
S&P500: 2,116.48 (3rd Nobember, 2015) – has not closed above this point yet.
Nasdaq: 5,176.77 (2nd December, 2015) – has not closed above this point yet.
It is a reasonable conclusion that the indices are currently in a bear market. The trend remains the same until proven otherwise. Dow Theory is one of the oldest and simplest of all technical analysis methods. It is often accused of being late because it requires huge price movements to confirm a change from bull to bear. In this instance, it is interesting that so many analysts remain bullish while Dow Theory has confirmed a bear market. It is my personal opinion that Dow Theory should not be accused of being late as it seems to be ignored when it does not give the conclusion so many analysts want to see.
This analysis is published @ 04:57 a.m. EST on 4th June, 2016.
Market highs since 2000 have occurred at 91 monthly (near Fibonacci 89) bars if the May 17 2015 high holds.
If Primary W2 is still alive, then this may be valid. Don’t like the duration of minor w4 compared to minor w2. I like that minor w3 is supported by macd and EW Osc.
Hourly charts of minor w3 and minor w4 of intermediate wC of Primary w2
Minor w4 and 5
Thanks for the charts Gary. As I indicated yesterday I am not quite sure how today’s price action will affect the wave count but it is remarkably in keeping with what I expected from the banksters. You can bet plenty of short stops were run today, and I also had to smile when I checked the CBOE put call ratio. Everyone and his grandma is convinced we are going higher.
With the way the put/call ratio plummeted, I am at a loss to comprehend why VIX printed a green candle today. This market is becoming more and more inscrutable. I opened short positions today based on UVXY price action and probably should have waited, as I normally do for a green close. It made yet another 52 week low. Something very unusual is taking place…market signals are all topsy turvy and my own suspicion is that nothing is quite as it seems….
Vern I totally agree. But, I also know I have felt the same incredulous feelings at similar points of social mood inflection. The most challenging aspect of EW is identifying the correct wave degree in real time. EW theory could benefit from the establishment of well researched rules and guidelines that define wave degree criteria.
You’ve correctly identified one of the most difficult aspects of applying EW to markets in real time Gary. What degree to label a movement?
It would be nice if rules could be applied to this problem, but I don’t think that is possible.
The problem is waves extend, normally a third wave within an impulse will extend. When that happens the wave extends in price as well as time. So within the impulse one of the three actionary waves is longer in duration, sometimes quite a lot longer, than the other two. But they are all the same degree.
Which means that how long a wave of any degree lasts must be a rough guideline.
There is a lot of variation in nature, and EW as a way of applying natural patterns to markets (as an expression of social mood) must accept this variation.
Which isn’t a good answer to the problem at all.
The best approach is to take a look at a monthly chart. Cycle degree waves should last one to several years. Start from there and move down to lower and lower time frames.
Great advice Lara, and one of the key reasons I respect this forum. I learn.
One challenge for me personally is what to do when instinct and other indicators I watch suggest something other than what I am expecting from the EW most probable count is unfolding. We saw a few really uncanny instances recently in which market went in the direction suggested by the count with the lowest probability. As Lara correctly underscored, the analysis can be executed with absolute perfection so far as application of the rules are concerned but may still not be predictive of what the market actually does. For me it is a good reminder that successful trading is both art and science.The key is finding the right mix!
That’s something I charted and considered too… and discarded on the basis that intermediate (C) looks like a three on the weekly chart. It should be a five.
I wouldn’t want to publish the idea. It meets all EW rules, but it doesn’t have the right look.
Which incidentally is the same problem the bull wave count has, not the right look.
Thanks Lara,
There doesn’t seem to anything pretty from an EW perspective since May 17 high. If intermediate wC is a three, then the minor wave (C) is going to be very small compared to w(A). Doesn’t break the rules but not a very good look for such a large corrective structure.
I agree, it looks wrong.
I have a wave count (thanks to Cesar actually) that does look right.
No truncations, no rare structures, meets all rules, all threes look like threes and fives look like fives….
Writing that all up now.
Played out perfectly according to script. Volatility (esp UVXY) has for quite some time signaling either a major top, or a big run higher. Still unclear which is correct. Perhaps tomorrow…
TA – it would be a heck of a double, even triple, top if it stopped at the 2116-17 area. Other tops November 3rd, 2015, April 20th 2015.
If nothing else today’s price action clears up some of the details about what might be happening with the market, and either way, i think the bears are going to get a chance to come out to play soon.
Our problem now is that it’s hard to tell from exactly which area the bear party might begin, as there are a number of possible target areas, all of which have been posted on here previously by various contributors.
I’m thinking that most of the TA folks stops will be getting taken between 2112-2120 area, but one must also consider the purely FA folks who tend to place their stops above previous price extremes. Doesn’t take a genius to work out that almost EVERY short stop on the order books is placed above the ATH….Which is why i would pay very close attention to Ris’s targets imhumbleo…
While there are some of us here who are working off the idea that we are still in a bull market (from 2009) it’s although worth noting even the bulls have different ideas. I see wave IV as complete and we now have five wave up of Feb lows, expecting next move to be to the downside to complete a wave 2
Peter has an excellent count which counts as wave IV still being underway as part of a more complex corrective structure. Either way, if either of those counts are right then there is some more downside to come, and probably reasonably soon. The key is now working out where that reversal is going to occur, and how deep it goes will give clues as to what is going to play out next.
I for one am now looking for a good short entry, but picking a top could be tricky here… big range that this move could finish in and IF the ATH breaks the speed of ascent on the squeeze could be frightening. Reckon it would be safer to sell weakness rather than into this strength…
Thanks, great informative post – I agree capitulation highs for the shorts would create the ultimate blow off top.
It seems to me that the size of short positions is being greatly over-estimated and that was confirmed by a plunging put/call ratio today. It has to be obvious to anyone paying attention that selling pressure has been largely awol in this market. I for one am not expecting any kind of short squeeze. I expect this move up to end in a whimper, not a bang.
Lara,
Have we abandoned the idea of an expanded flat for 2 without a truncation?
I’m not sure. I’ll have an answer for you in another hour maybe.
The problem I have with that now is intermediate (C) looks like a three wave structure on the daily and weekly chart.
The only way I could stomach that and publish the idea is keeping in mind the S&P just doesn’t always have threes that look like threes and fives that look like fives at all time frames.
Only one bear count left now.
I’m struggling to see how this could be part of intermediate wave (C) for the bear count, it would look like a three.
So if the bear count is correct then a leading diagonal is unfolding.
If the bull count is correct then intermediate (2) is over and this is the early stage of a third wave up.
FWIW, PCLN despite weak earnings and guidance down is up over 42 today alone…this shows how well the markets are being tweaked higher and higher. I think if we solely look at S&P without assessing the influence of NASDAQ, it will be partial analysis. I expect NASDAQ to breakdown faster than S&P but not likely to happen today especially after FED Yellen’s conference. Tomorrow is another day but this market has deep pockets backing it hence no fear at all as ‘buy the dip’ is in full swing.
da da da, another count bites the dust. da da da , another count bites the dust. can remember the artist.
Queen,,, so if we bust through 2116 ish,, all we have is the bull count?
The 2117.68 or the 2137.70 fits an irregular B wave, so Bear is still in play. And we did not yet close above the 2111 number, or the 2117.68 number.
I should add if it is an irregular B, then taking A from my 30min chart below there are also the targets of 2121.70 (A x 1.15) and 2128.86 (A x 1.25). Guess price will tell us
R.I.P Bear. It seems like we hardly knew you.
Dammit!
So much for the Primary 3 theory…
Major disappointment!
Arrgh!
30min SPX chart. Elliott channeling shows the middle trendline possibility of wave i = wave 5 top of 2117.68. Or alternative is the top trendling and price target of 2137.70. Because wave iii was 1.62 the length of wave i, giving these as the two highest probabilities.
Thanks Peter:)
Hey Peter,
I have 2,144-2,145 as the likely target if 2,116 get taken out with force.
Hourly SPX chart, looks like little “iv” ended and we are going up for v of (c) of B. If wave v is the length of wave i then the target would be 2117.68.
First time I’m seeing UVXY up when SPX is also up over 0.3%! I really can’t recall last time this happened; its been a looooong time.
Hopefully this is a good sign for the bear case…
I really thought the shorts would get invalidated, but maybe not so fast…
Hold on to your shorts 😉
You called that right… nice plunge down, let’s see if it sticks.
This is a very resilient market indeed. Peter and Stuart might be onto something…
Yep
First Post….. The silence is kind of eerie……..Its almost as if everyone is holding their breath..
More gublygock from Hellen coming. Not sure what she can say. If she says she was wrong and will delay rate hike….does the market see that as pos and go up? If she says employment expected to pickup ….how? Monitor the situation. So what….she can’t really lower and can’t really higher rates…….sell the news
Some of you may be familiar with Peter Temple’s work (World Cycles Institute http://worldcyclesinstitute.com/triangular-bulls/)…Peter’s long term, bearish forecast is consistent with Lara’s…interestingly, his short term forecast has a different form than Lara’s ALTERNATE BEAR ELLIOTT WAVE COUNT with a similar price.
Phillip; I really like the way this guy thinks! Many thanks for the link.
Guilty of overposting!
Chart attached is 2 hour SPX with a alt. wave count. Have a great trading week.
While I can see the idea of the A-B-C flat unfolding from the high on 20th April…. I’m trying to fit it into the bigger picture where that high was X or D of a larger structure.
I can see it could be X (a running flat) within cycle wave IV…
But it can’t be D of a triangle for cycle IV, it fits neither the rules for a contracting nor expanding triangle.
Peter, does this count fit in with the bull wave count? This is part of cycle wave IV continuing?
Honestly Lara I don’t know what the big wave up from Feb. 11th low to April 19th high is just yet. My premise is Primary III topped in May of 2015. And we are still in Primary IV which to date I’m counting:
Primary A down August 24th
B up Nov. 3rd, 2015 top
C down Feb.11th, 2016 low
“X or D” up to April 19th
All which took close to a year to play out.
-now we’ll see another year of correction, 3 more corrective waves with one down now, the other back up, then another down to complete Primary IV. THEN, primary V up to complete the larger cycle and then we’ll have pain like most of us have never felt before. I’ve posted this count before and have been trading it with good success – that will probably be my curse and I’ll get hammered the next ten trades 🙂
This is similar to what I’m looking at this very moment Peter.
1) Either we are topping in a b wave and will pullback to 1950 area for a c wave
OR
2) This is a fifth as part of a bigger wave 1 which must complete before any correction
Barring any Black Swan type event I think we will most probably see 2115 area this week (with the potential for much higher) before any kind of meaningful pullback.
Stuart,
I was going to post here earlier for considerations that drop to 1950 at best will be the very best case. Now considering the intent of FED and central banks, it would be prudent to tighten the stops starting low 2,000s.
Whatever is going to happen, is going to happen right away I think. The kind of action we are seeing in UVXY means the market is about to go straight up, or straight down. A move down to 1950 will imo not stop there but keep on going so if we see that level this week, bullish trades are probably going to get skunked. Tepid futures suggest we go higher.
My next short trade is going to come after I see futures down triple digits, not one second before….
A thank you to Verne and Joseph, really, because it brings me to the real questions to focus on: 1) how much total money went into the stock markets from the QE scheme (and would have to include QE’s from around the world as at least some of Europe/Japan’s QE monies certainly found their way into the US stock markets). No. 2) How much was QE real cash (if JP Morgan for example sold MBS to Fed and took that cash right into stock buying) into the markets? 3) Subtract how much was borrowed as a result of the QE policies? A lot of QE monies and debt thereof went into real estate, into plain old T-bonds and T-bills. Does anyone know of these figures? If it was 80% debt caused by QE schemes into the stock markets, versus if 80% actual real QE cash which went into the markets for example, it would of course make a huge difference for us traders as to when the market falls.
Enjoyed the exchange Peter, and learned a thing or two as well… 🙂
Me too! Still thinking…
This may take some time 🙂
No question Joseph/Verne are right about what happened AFTER the Fed’s QE’s. My fault for not being clearer – I was just pointing the Fed QE scheme itself did not, was not, debt in any fashion.
Back to the original reason for posting: Lara’s statement of “Because the other side of the balance sheet to all that cash printed by QE is debt. Eventually it will have to be repaid.” This is a false statement. QE cash was ‘printed’, but on the balance sheet no debt was created. Not on the Fed’s balance sheet, not on the 13 big institutions’ balance sheet. The Fed and the big institutions have no debt to pay back. Verne and Joseph – you’re talking about all the negatives (my ‘unintended consequences’ I said ‘is for another story’) as a result of the QE scheme. But if JP Morgan, who was one of the big institutions, sold financial instruments to the Fed – which they did – then took that cash money from their sale and put it into the stock market there is no debt to be paid back ‘on the other side of the balance sheet’ as Lara wrote. The reason why this bubble is different from the Tulp Bulb and Railroads among others because no debt was created in the Fed scheme as the JP Morgan example demonstrates. As to why it could go on much longer, and it has already, than previous bubbles.
If you didn’t “think” in such a small box, you would see that by this statement from Lara… (I don’t want to speak for her but this has been discussed before here)
Lara’s statement:
“Because the other side of the balance sheet to all that cash printed by QE is debt. Eventually it will have to be repaid.”
You would have understood that what she is saying and what I have been saying is…
The other side of the BALANCE SHEET is the NEW DEBT ISSUED (Since QE & other actions by the FED & CB’s since 2008) by…
Issued by Governments Worldwide and Corporations Worldwide that will have to be PAID BACK!!!!!!!
This DEBT was ONLY POSSIBLE (Possible to Issue) by the Actions of the FED and other Central Banks worldwide!
Without their (FED & CB’s) actions issuing this amount of DEBT would have been IMPOSSIBLE!
In Fed speak is a matched book… what the fed does on it’s balance sheet, the OTHERSIDE is out there in the REAL WORLD!!!!
That is the after consequences of the policies of the Fed and other central banks. Sticking by the QE scheme itself created no debt, as Lara’s statement suggests. If I am misinterpreting her thought then my apology. Adding virtually everyone I meet believes the Fed QE was debt when it was not, including some bankers I’ve spoken with.
No one I talk to believes that…
Matched Book… What the Fed does on it’s Balance Sheet the Opposite Effect is out there in the REAL World!
Fed Buys, Owns and Holds Debt (Not Issues) on it’s balance sheet = in Effect New Debt Issued By Governments & Corporations.
That’s Fed 101
I am out of here for the week! Have fun all! It’s going to be an interesting week!
Its not that easy of a calculation. JP Morgan for instance took the cash they received from selling MBS and Treasuries to the Federal Reserve and used some of that cash to purchase distressed properties across the USA. It is in their 10-k’s filed with the SEC. So that is cash – not debt – buying assets in the private sector. Maybe our question to ask is how much of the QE monies went into the stock markets? And how much went into debts thereafter in various forms, such as corporate bonds, buybacks, IPO’s etc. ? If anyone has the numbers of where all QE ended up I would appreciate a link to it. I think Joseph you and I are on the same page, where I am just talking about the QE program…you are talking about the effects thereafter of which I do agree with you believe it or not.
Credit, Debt, Cash, Interest Rates all rely on the common ground of being able to understand the risk and that instrument represents value that is transferable. No matter how they “avoided debt” they cannot avoid the very heart of the construct which is faith that the value that one participates in will remain, increase or decrease based on predictable patterns. The more the FED is creative the more the value predictability is threatened leading ultimately to the “Minsky Moment” when a sufficient signal occurs that construct is no longer to be trusted anymore. The longer we wait for the trust re-calibration the deeper the pain.
http://www.usdebtclock.org/
http://bawerk.net/2016/05/19/fed-suppression-long-term-economic-repression/
Joe, I’ve removed one comment of yours. Please keep it civil.
All caps is the digital equivalent of shouting, please don’t do it.
Thank you for your patience.
Here is a pretty good article on the efficacy of stock re-purchase programs. The underlying assumption of this approach is the share value will be higher in the future ( that is that the stock price is undervalued at the time of re-purchase). This has unfortunately proven to be wrong in any number of examples I could cite, such as IBM and 3M.
http://www.fool.com/investing/general/2013/09/05/buybacks-creating-vs-destroying-shareholder-value.aspx
That’s the same argument they used during the housing bubble from 2000 to 2006… Housing prices will always go up and be higher in the future.
Yep. All the time they were eagerly buying back their “undervalued” shares with easy money, the insiders were just as eagerly unloading them and absconding with proceeds from shares sold at a premium. Any body take a look, even now, at SPX, NDX, and DJI trailing P.E.’s compared to historical values?
The biggest problem with stock buybacks is they are almost always funded by new debt instead of cashflow. With corporate earnings in decline buybacks can “repair” the PE ratio so it doesn’t look as bad. But the result is a weaker, more debt ridden company that will have a harder time surviving a recession.
Instead of investing in income producing assets that could grow the company, companies sink into greater debt. Of course, buybacks are also needed to offset overly generous employee stock option schemes, also bad. Overall – as the article explains – stock buybacks are most often bad for shareholders.
http://seekingalpha.com/article/3977639-next-market-crash-happens
Bingo! Most of those buybacks already have a negative ROI as the shares are now much cheaper than when they were first acquired. It is entirely possible that by the end of the coming deflationary depression some of the issuing companies will have ceased doing business. In that case the value of those bonds go to zero.
Lara – a counterpoint to your comment below of “Because the other side of the balance sheet to all that cash by QE is debt” and ‘all bubbles debt fueled’. This is my area of expertise, I am an economist by degree and work. The Federal Reserve does not have debt on its balance sheet as a result of QE or any similar program. Our Central Bank created electronic money and then purchased assets from large financial institutions (13 is the number I believe). The Fed literally credited those institutions’ bank accounts with cash while at the same time those institutions sold the Fed various assets. There was/is no debt in the equation. In fact the Fed is making money on it as they are being paid interest on the bonds and mortgage backed securities they bought. They have even sold some earlier ones, where the base principle value increased, for some very large profits. The institutions got cash, the Fed. got assets, there is no debt. The money was created electronically, albeit out of thin air, and does not have to be paid back to any one or entity. If the 13 institutions or their sublings put money into the markets, which for sure some of it went, it is pure cash – not debt. The Fed. has last time I looked about $4 trillion dollars of assets on its books, not debt. For sure there is a whole host of problems with this, unintended consequences, skewing of specific markets, etc.. but that is another story. Noting I completely disagree with the Central Banks meddling with the free market system in the first place. Even the Govt. debt of, lets use $19 trillion as a number for here, is not a problem because our cash flow as a country can handle $22 – $24 trillion. Again, we should not have this debt at all and I completely disagree with it just to be clear; it already is hurting us in various ways, and many not so obvious. But our national income statement can handle it. Conclusion: there is no debt to be paid back in the Fed’s scheme.
Peter,
Thanks for sharing the insight into the debt situation, this explains ‘ NO FEAR’ state of mind. I bet no one is keeping any meaningful tab on a daily basis as FEDs and others support the market action.
One question for you Peter. How do you know the assets are worth 4 trillion dollars? Just because the FED assigns that value does not necessarily make it so. That value is realized when, and only when, they have a BUYER for those assets.
I know you are not implying that bond-like instruments cannot loose the entirety of their face value so I assume I am missing something in your argument.
Contrary to what many believe, the Federal Reserve has many oversights, one including the U.S. Congress whereby the Fed officers have to testify twice per year under sworn oath. Then, the Fed’s financials ARE audited (they put out both unaudited for the short term and audited for the long term). Those reports can be found here:
https://www.federalreserve.gov/monetarypolicy/bst_fedfinancials.htm#audited
Next, there are three main advisory groups the Fed works with and all of them have access to the Feds financials. As do the 12 Governors of the Regional Federal Reserve banks spread across the USA. Further, the Feds’ books have to balance with the U.S. Treasury’s and OMB. There are other agencies which work with the Fed too and some of those have access to the Fed’s financial books. Thus, you would have to have dozens upon dozens of people/agencies/organizations across the USA conspiring with each other over decades to believe the Fed’s numbers are phony.
I do not doubt what you are saying but it begs the question. There is a reason the FED bought those assets off the institutions’ books. I don’t care how many people warrant the FED’s assignment of value to the instruments they hold. Until they can actually SELL them we do not truly know what they are worth.
This of course leads to the gigantic elephant standing in the room, and that is that the FED was in fact the buyer of last resort so far as that 4T balance sheet is concerned. There is no remedy for an il-lliquid market, bond or otherwise. If no one wants to buy your asset, it is worth zero….
While I was not explicit on this point, you can glean that I was driving at the determination of the FED’s true capital ratio. I will grant you we cannot know with any certainty, but that is just the point is it not? We have to assume they remain solvent. Ah! that is the ultimate consideration – confidence in the system!
But as mentioned the Fed has already made huge profits on the financial instruments they bought and sold. That alone proves the instruments they have contain value in the real market. Further, one can find the price (value) of any financial instrument the Fed holds. Take mortgage backed securities, there is a daily market beginning with the creators of those instruments (a retail bank or mortgage broker for example) whereby you could go to your local bank and just ask them how much are they selling a $300,000 mortgage for to their buyer, if they would share that with you. Same with Treasuries/bonds which are sold at public auction all the time and thus it is easy to determine the value of these instruments. Take real world market value of those instruments and apply it to what the Fed holds, and you come up with their total assets (plus the gold and other things they hold on their balance sheet). But getting back to the base counterpoint – the stock market has not been fueled with QE debt, but with cash. Where I respectfully disagree with Lara’s comments of this subject.
So are you arguing that all those corporations that issued bonds used none of that money in stock repurchases? That is indeed a strange contention as they fully disclosed what they were doing. Of course you get cash when you issue bonds but you also create an equal amount of debt plus interest due on the bonds. That debt is only good so long as the issuing entity remains in business. That particular assertion makes no sense to me Peter. Am I missing something?
Yes, my counterpoint is to the comments of “QE debt” which I quoted in my opening sentence of my first post. I did not write about corporate bonds. And changing to a different subject yes, on the corporate bonds point for sure some of the QE money went into those bonds….but the Fed does not have debt on its books which needs to be paid back is my core point.
Peter, The Fed issuing it’s own debt is NOT and has never been the POINT!
I say you missed the point entirely!
The FED and other Central Banks are Crowding out Private Investors and with lower interest rates are RAPING the wealth from the Middle Class and Seniors Worldwide!
That’s the Point! + the points in my posts below!
Peter, You missed the point on what Lara was saying… But I don’t want to speak for her.
I say you missed the point entirely!
All Please Read my posts below… it didn’t line up in the proper place as a reply to Peter’s initial post.
Joseph – the Fed did not issue any debt in the QE scheme. They created money out of thin air, electronically, then purchased assets from the large institutions. They have no debt to be paid back in this scheme.
O.K. Peter I see your point. I guess we should technically change our description of the FED’s balance sheet from assets and debt, to assets and liabilities. This in my view does not materially change the larger point regarding the level of their exposure. Thanks for patiently clarifying! 🙂
As long as those for whom the FED is serving as creditor can continue to service the “assets” they hold, well and good…get my drift?
Vern, you caved on the wrong side! Where is your back bone?
I am done here, good day!
Oversights… Yea, the cat watching the hen house!
What the Fed is doing is allowing the political class to spend all they want on anything they want and pay back their crony’s with tax breaks & tax credits & favorable legislation without any accountability whatsoever! All at the expense of the citizens of this country. This is going on worldwide BTW.
And Joseph I agree with your end points, get the Feds/Central Banks/Govt. out of our ‘free’ market systems. They are causing the problems. I’m the old Austrian School of Economics which has proven itself time and again it is the best system man has invented to date for the most freedom, the most wealth, the lowest poverty rates and so on.
Thanks Peter, that is fascinating insight.
BTW, us old timers know Fed intervention isn’t a new thing since 2008. It is well known that in response to Black Friday 1987 the Fed established the Working Group for Financial Markets aka the Plunge Protection Team to prop up markets in downturns. That group has been more active than ever now, I suspect…
And this intervention is global and coordinated… Right now the BOJ owns 10% of their stock market and is buying more (I’ve always thought Japan could be the linch pin in a global collapse). EU purchases are huge too; really, this is quite a crazy economic experiment that is going on at an unimaginable scale.
And… how is it all working?
https://northmantrader.com/2016/06/05/macro-charts/
Peter, the central banks are buying debt instruments yes and it’s not an obligation to them as an issuer of debt to fund that exercise yes.
BUT, that is NOT the point! What they are doing by this action is allowing Governments worldwide to issue debt at extremely low interest rates without consequence or any regard those governments future ability to service that debt. When you factor in all the entitlements those same governments have + the unfunded liabilities that those same governments have… the Fed & other central banks are blowing one big bubble that will burst!
These Governments would NOT be able or have been able to issue that amount of debt at the interest rates that they have been… some may NOT have been able to issue that debt at all without the central banks taking this action.
They are also by these actions squeezing out private investment in these government debt instruments and are forcing private investors into Corporate Debt and more importantly forcing them into unsecured Corporate Debt and Junk Debt. The later two would in normal time have a difficult time getting issued at rates that make sense for those corporations. This is the 2nd huge bubble the Fed and other central banks are blowing. Add on top of that all the debt being issued by corporations with the sole purpose of buying back their own stock. Buying back stock… artificially increases earnings per share. Which is the big talking head sales pitch for why the public should buy stocks. However, the clue that this is all artificial is that These companies have little or no Revenue Growth… many have rising earnings per share and declining revenue. Senior Secured Corporate Debt is the only corporate debt that should be purchased by private investors… because if the Corp. goes Chapter 11, the Senior Secured Debt holders world then own that Company with the current shareholders getting nothing or very little.
Now… Since most Governments issue more short-term debt (1 month to 7 years) than longer-term debt… when interest rates rise, their budget deficit’s will explode Exponentially! Since no government operates at a current balanced budget they will all need to issue debt at an increasing amount!
I can spend another hour & paragraphs more explaining this… BUT here is the short summary:
This is all one big Ponzi scheme… One Big House of Cards…
All this debt will never be paid back… never.
We are there NOW… but nobody will admit it or they just don’t know it!
So what is the outcome?
The biggest deflationary cycle that has ever been seen in history… ever!
Stated another way… the largest debt haircut ever taken!
Can we get out of this? NO… IMO! The best way out is to have the entire system cleanse itself… NO MORE BAILOUTS! NO MORE SOFTING THE PAIN!
Let the natural course occur… because one way or another the end result can NOT be avoided. The longer the delay, the more the pain! It has been 7 years already of delay. If it was allowed to occur in 2008-2009… we all would be at least 4 years into a brand new beginning! Now instead of 3 horrible years, more or less, of existence… due to the delay it may be 5 to 10 years. The more delay the longer the pain cycle!
And we have not once mentioned the derivatives market. Keep an eye on DB. It’s the poster child for bad behavior in this arena, and something of a canary in the coal mine. When Cryan started loudly protesting about how they were adequately capitalised and had the liquidity to more than cover their liabilities, I really started to worry…. 🙂
Yes… The derivatives issue is still a big black box! That was a big complicating factor in 2008. Funny how not much government regulatory action took place in this area.
Government regulatory action extremely overreaching into just about everything else!
What was the quote by the powers that be??? Oh yea… “Never let a good crisis go to waste”
I did not write about corporate debt. My post was a counterpoint to “QE-created-debt” at the Fed. You wrote the Fed “issued debt” – no they did not. Go to the link of the Fed’s audited financial statements I provided above and you will see trillions of dollars of assets, not debt. As I wrote the Fed created money electronically out of thin air, then purchased assets from the big financial institutions. There is no debt in the QE equation. As to why the Tulip Bulb, Railroad and other bubbles are different. Those each involved individual people (in this context corporations and banks are individuals too), each who borrowed mass somes of money to fuel those asset purchases such as the Railroads. That debt had to be paid back, here the Fed has no debt to be paid back is my point.
Peter, When the Fed Buys existing Debt and also Funds Debt Issuance from Governments by maintaining a portfolio of Debt Issued by Others on the their (The Fed’s) Balance Sheet… they are taking assets off the market that would have been purchased by private investors.
In effect Crowding out Private Investors and forcing them into other assets! It’s this Crowding out that is blowing the bubbles… That is the EFFECT of what QE by the Fed and other Central Banks are doing … BLOWING BUBBLES!
Now the ECB is to BUY Corporate Debt… a new phase of Crowding out Private Investors and forcing them into other assets.
Private Investors being force into more RISK ASSETS!
Another point I wanted to make above…
The ECB is now purchasing Corporate Debt in addition to Government Debt, I am sure that will be Senior Secure Debt… That will further push private investors into more Unsecured Corporate Debt and Junk Debt and other assets.
Corporations: when this deflationary cycle accelerates the corporation issuing all of this unsecured corporate debt and junk debt (tends to be 1 mo to 10 years some is LT)… will Never be able to roll over that debt… therefore forcing the all into Chapter 11.
Who wins? Those owning the Senior Secured Debt! Who losses? Everyone holding the non-senior secured debt, junk debt and stockholders.
Who actually owns the senior secured debt??? Any new trends in who is actually buying Senior Secured Debt??? That may be a research project worth doing.
I did not write about the ECB, I responded to the QE scheme of the Federal Reserve of the United States. Plus, I’m wrote about what happened in the past and where we are right now. I wrote little about the future. Although I wrote about “unintended consequences” and the Fed’s scheme hurting us all.
They all are doing the same thing!
The consequences are as clear as day!
To those NOT drinking the Cool aid!
The phrase unintended consequences is way overused in all these arguments! Because again The consequences are as clear as day!
To say that the FED does not issue debt is technically correct, but in my view a bit of an obfuscation. As Joe points out, if the FED did not buy these bonds, the debt could not be created, especially at such low rates, so it may well be a distinction without a difference as it were. Look at Japan!
Thanks for this comment Joe.
I’ll be reading yours and Peters again a few times to let it sink in….
Okay Peter, I sit corrected. Thank you very much for explaining it to me.
I was under the (false) impression that it was a process akin to how banks create new money when they make loans (in the case of mortgages).
It’s not the same obviously.
So… thinking it through a little further…
The assets which were transferred from the 13 large financial institutions who were the recipients of the FED’s QE new cash, if those assets are based on debt then there may still a problem. If that underlying debt can’t be repaid then the FEDs balance sheets deteriorate. But then, they can just print more money (digitally) out of thin air so that may not be a problem for them?
But if all the money from QE was new cash, now circulating within the financial system which does not have a corresponding debt to be repaid… then that paints a different picture in terms of a bubble?
So the increase in reserves for the banks (their balance sheets of reserves held with the FED increased as a result of QE) means they can now make more loans. Which means there will again be more debt…
It’s confusing TBH. I’m still learning and open to new information.
Thank you very much Peter for your calm and reasoned comments. As you can tell, I’m not fully certain of exactly how this all works and I’m probably wrong on some points.
In addition to Dow Theory, I am watching for the consumer to break down by following the consumer discretionary to consumer staple ratio. It needs to break through to down side like it did in 2000 and 2008.
http://stockcharts.com/freecharts/pnf.php?c=XLY%3AXLP,PLAIWANRBOPADF1!3!1.0
Hi,
Am I right on weekly count from an all time low of 666.79 we are now at a Fibonacci week of 377?
Yes. Next week is week 377.
Lara, came across this today while trolling, wondering if you are familiar with this work and if so your thoughts. Part I find interesting are the comments about SPX being controlled via the futures market were as the NYSE can not be and how this impacts their EW counts.
https://caldaro.wordpress.com/
Kinda sounds like Caldaro is blaming the bogeymen for his analysis being wrong…
And there is nothing wrong with being wrong, provided you are not not an a-hole about it, like blaming someone else.
Same as being right. No value in saying” i was right.”
Just curious Tony -Did the futures control the SPX when your analysis was correct/were right? Hmmmm
Stuart,
Just went through some other TAs and given the failure of markets to go below 2085-2083, they are not project a ramp early next week to 2,144 before a meaningful down move.
correction meant ‘now’ instead of ‘not’ in “they are not project “
I figured that is what you meant. I expect something similar but it has nothing to do with TA. It has to do with the way banksters think and behave. They know full well everybody and his grandma is watching that all time high and trying to decide if it’s going to hold now that we are so close to it. Can you think of anything to get the bulls more in a frenzy than a massive cash dump to rip past it? I think that likelihood was greatly increased by the failure of the market to fall away from the round number pivot of 2100. In the vast majority of cases that I have observed, we will get move 1 to 2% past the round number after a protracted battle before it is finally and decisively taken out, assuming it is indeed a false break-out. Above 3% and we go much higher I believe. I expect we will probably see a slight adjustment to the wave count the next few days….
Vern,
Check EW reading on AMZN stock. I think there is something of significance happening from EW as well as Fibonacci Levels. Let me know your thoughts.
Thanks Ris 🙂
Also i note that currently retail trader sentiment is net short at almost record levels.
It will probably be too much temptation for the banksters NOT to run this thing up higher in view of same…
That is exactly the idea; run the stops of all the short positions expecting the near high to hold. We’ve seen this movie so often I am truly surprised people get trapped by it. Whenever I see these battle around the pivots end in what looks like a stalemate, you can take it to the bank that the banksters are going to ramp the market up past it. That’s why I am neutral short term. I will be looking for a bullish engulfing candle in UVXY to tell me we are looking at a temporary spike and not an extended run higher.
I’m reasonably familiar with Tony Caldaro’s work and have had some communication with him. He knows his EW well. We’ve exchanged links.
I disagree with his wave counts though. But they are entirely valid.
I’m struggling to see how futures could continue in a bull market while cash markets are in a bear market. Because the other side of the balance sheet to all that cash printed by QE is debt. Eventually it’ll have to be repaid.
Every bubble in the history of bubbles ever is at its heart a debt bubble; from tulips and railroads to property in the US 2008. This one will be no exception IMO.
You’ve nailed it Lara. All that is keeping the market at this level is futures buying. Bears are afraid to sell. Those contracts are eventually going to be unwound instead of rolled, and the market will quickly find its true level considerably lower than where it is today. We got a brief preview of what that is going to look like last August 24. The slope of the declines from the last two bear markets is also revelatory. Look at how the steepness of the decline increased in the last two steepest portions of the decline. If the pattern holds, the coming decline will be vertical. The higher they rise…the harder they fall…
The AI algos may be onto something Jim; I think the next area of interest will be around 1800…
Some serious concern on the booming housing situation in US
https://www.facebook.com/RBReich/photos/a.404595876219681.103599.142474049098533/1230616970284230/?type=3&theater
Thanks Lara 🙂
I think he has given the best summary of the role of central banksters (when you boil it down they are really nothing more than a financial criminal class folks) in market intervention. He has also astutely pointed out the fact that not all of the intervention is necessarily acknowledged, much less reported. He has also been correctly bullish the last several years and I am not sure whether or not that was because he was taking into account the massive injection of liquidity taking place in global equities markets. I noticed that he recently shifted from long term bearish to neutral.
I too happen to be neutral short term.
One thing he got absolutely right and which people would be wise to pay close attention to is the fact that we are in uncharted waters when it comes to market intervention. We really do not know how long they can continue to affect short term market direction because we have never seen this kind of effort before.
Where I would differ is on the question of any uncertainty with regard to how it will ultimately end. The paradigm shift of central bank manipulation, is going to usher in a super cycle paradigm shift of market implosion. I think people are going to be stunned by how quickly in unfolds once social mood fully turns negative.
Trolling? I thought that was urban slang for people who went on discussion forums with the express intent to foment strife or otherwise engage in general nastiness…
that does not sound at all like you Jim! 🙂 🙂
Here is what artificial intelligence is predicting for the S&P 500.
http://www.forecasts.org/stpoor.htm
Their broker is on the phone, something about margin.
LOL.
Like that a lot 🙂
Some thoughts. The fed has had interest rates at near zero for quite some time. They thought they were going to raise them when things got better. The jobs number was 38k after expecting 160k . The last 3 months were revised down. What is the fed going to do now? Painted into a corner comes to mind. There hands are tied. If they raise or not jobs will go down. What is next? If the market goes down hard do they start going negative rates? People would pull money out of the banks and put in gold. Fractional reserve practice would be exposed and banks would fail. ……buy a farm with a fresh water supply away from the cities….bury your gold…pay off your debts…have a back up country to move to…..when the treasuries can’t be paid back then we are in real panic mode. Lara…can you build us some temp huts to move into along the New Zealand coast ;). Surfboards included
My girlfriend has some land nearby in the bush. Bring yourself a kit set cabin. I’ve got plenty of surfboards 🙂
We’ll be all set
Hmmm…sounds like you have already given this some thought. You are quite the entrepreneur…..this is stage 2….good to have a plan though
How many hang men is it going to take to hang this market? The Hindenburg omen has been a reliable turning point in the past. I just don’t see the new highs & lows coming close to being at the required level. Would it be too much to ask to follow this indicator? I know there are a lot of indicators being followed right now….thanks
I suspect it is going to take some kind of exogenous shock. My own theory was that it would be tremors in the multi-trillion dollar bond market, but nobody even blinked over the PR default. This level of complacency is probably the most cautionary note about market sentiment.
I actually worry about getting out of my positions before the end. Some observers think markets as we know them will cease to exist in the coming melt-down…. 🙁
Wow. Can’t believe that nobody saw this post yet.
I did! Just wanted you to be first! 🙂
It was published pretty late. That took me about 5 hours. No kidding.