
Upwards movement invalidated the main hourly Elliott wave count and confirmed the alternate, which was judged to have a very low (5%) probability.
Summary: Divergence with price and VIX (inverted) supports a high in place today or very soon tomorrow. A third wave down is still most likely. Risk and the invalidation point remain at 2,111.05. Some confidence may be had in this outlook if price makes a new low below 2,088.59. A new alternate is published today (it has been published before and is resurrected today) which places risk at 2,116.48 but also expects an imminent trend change.
Last published monthly charts are here.
New updates to this analysis are in bold.
BEAR ELLIOTT WAVE COUNT
WEEKLY CHART
Click chart to enlarge.
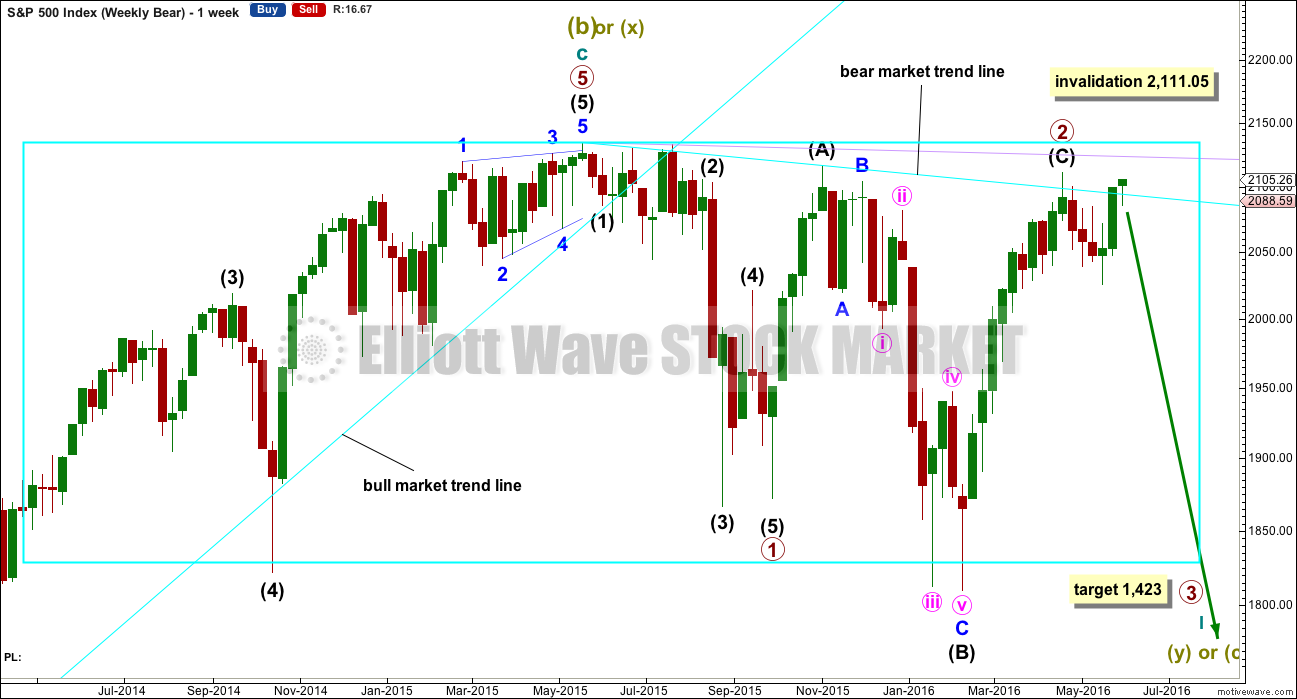
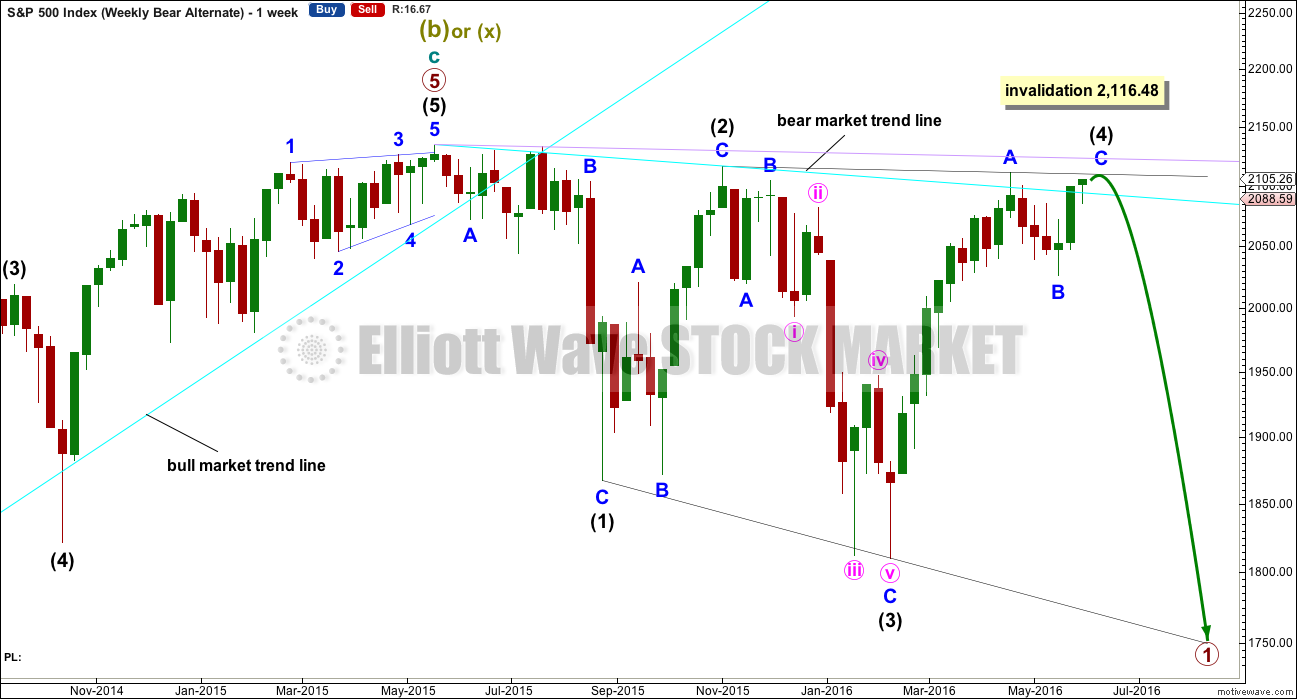
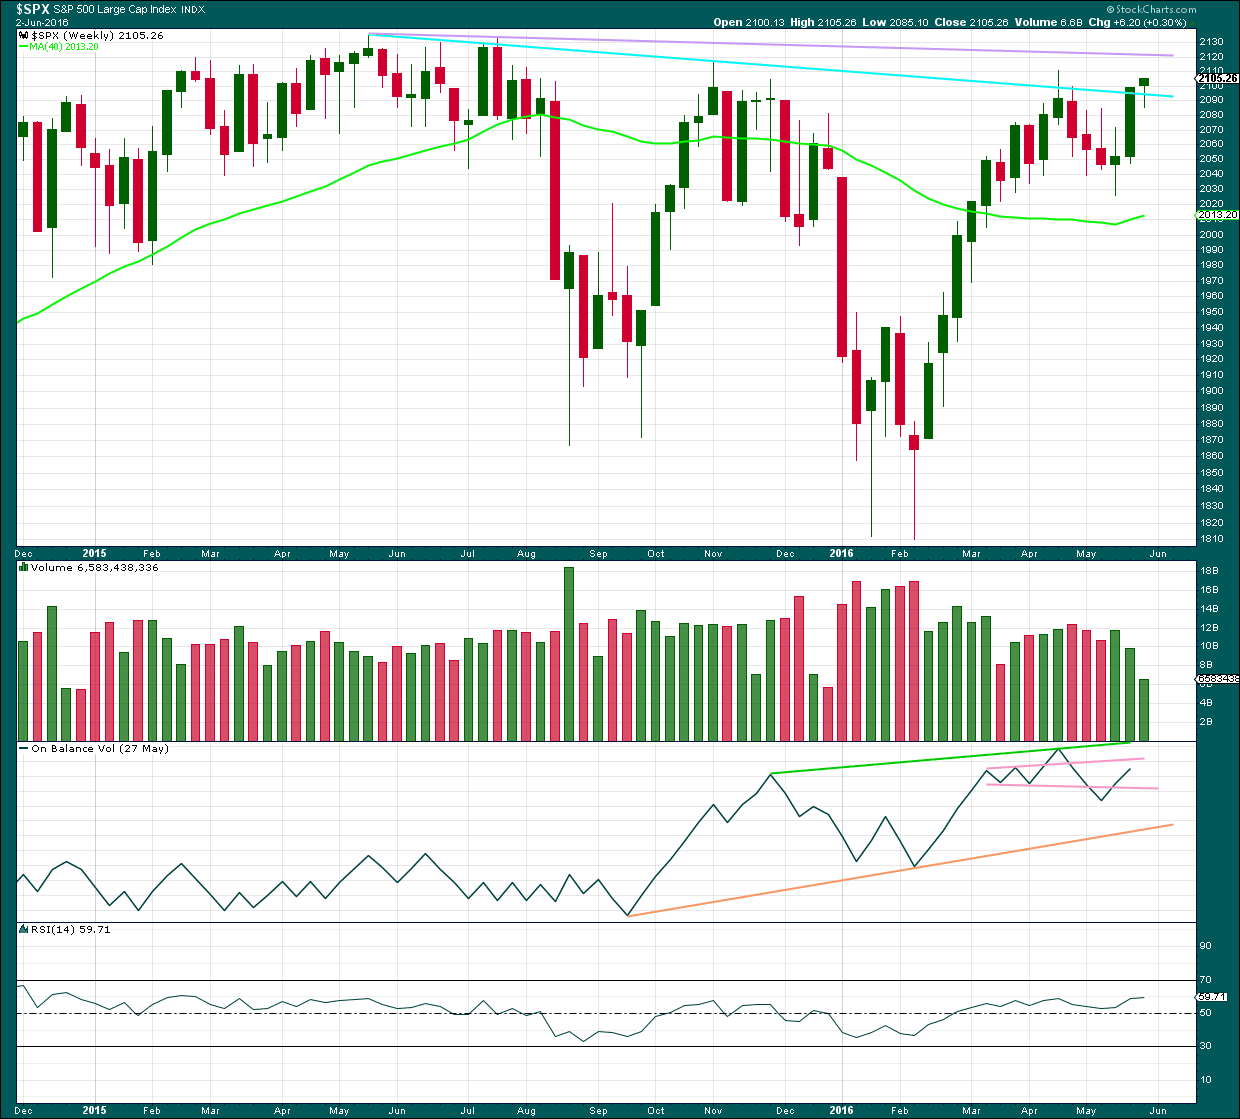
The box is added to the weekly chart. Price has been range bound for months. A breakout will eventually happen. The S&P often forms slow rounding tops, and this looks like what is happening here at a monthly / weekly time frame.
Primary wave 1 is complete and lasted 19 weeks. Primary wave 2 is over lasting 28 weeks.
An expectation for duration of primary wave 3 would be for it to be longer in duration than primary wave 1. If it lasts about 31 weeks, it would be 1.618 the duration of primary wave 1. It may last about a Fibonacci 34 weeks in total, depending on how time consuming the corrections within it are.
Primary wave 2 may be a rare running flat. Just prior to a strong primary degree third wave is the kind of situation in which a running flat may appear. Intermediate wave (B) fits perfectly as a zigzag and is a 1.21 length of intermediate wave (A). This is within the normal range for a B wave of a flat of 1 to 1.38.
Within primary wave 3, no second wave correction may move beyond its start above 2,111.05.
DAILY CHART
Click chart to enlarge.
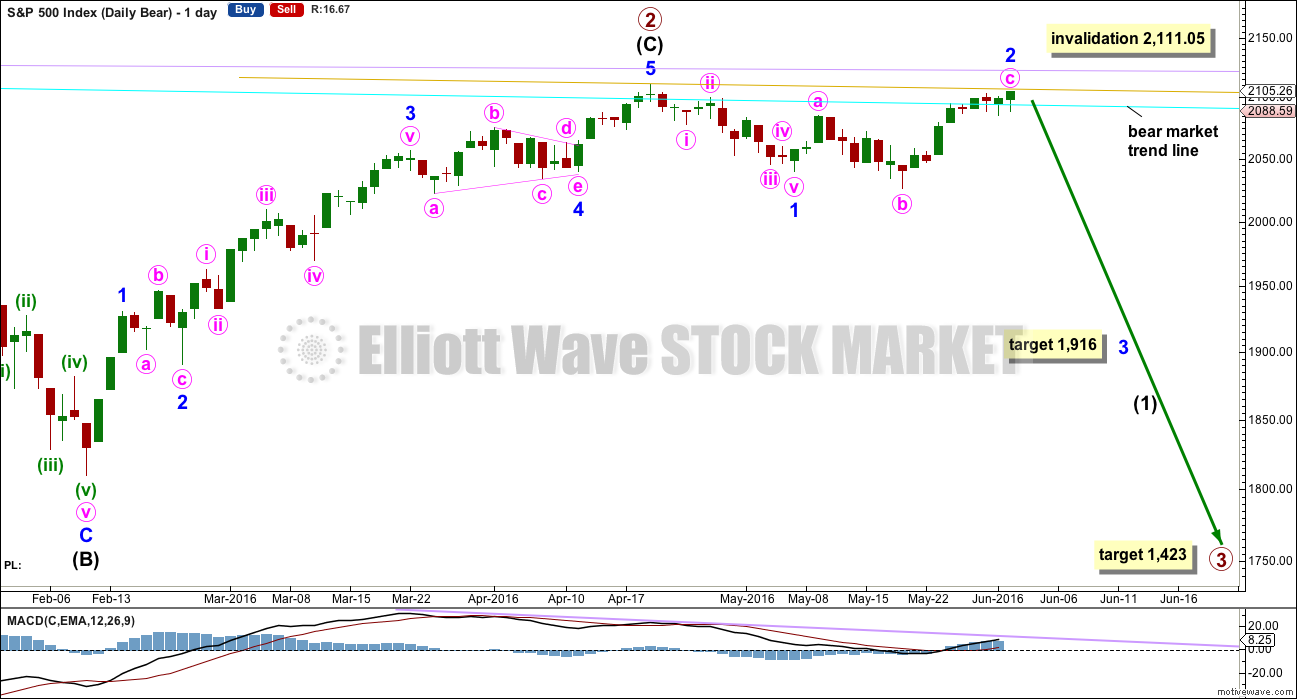
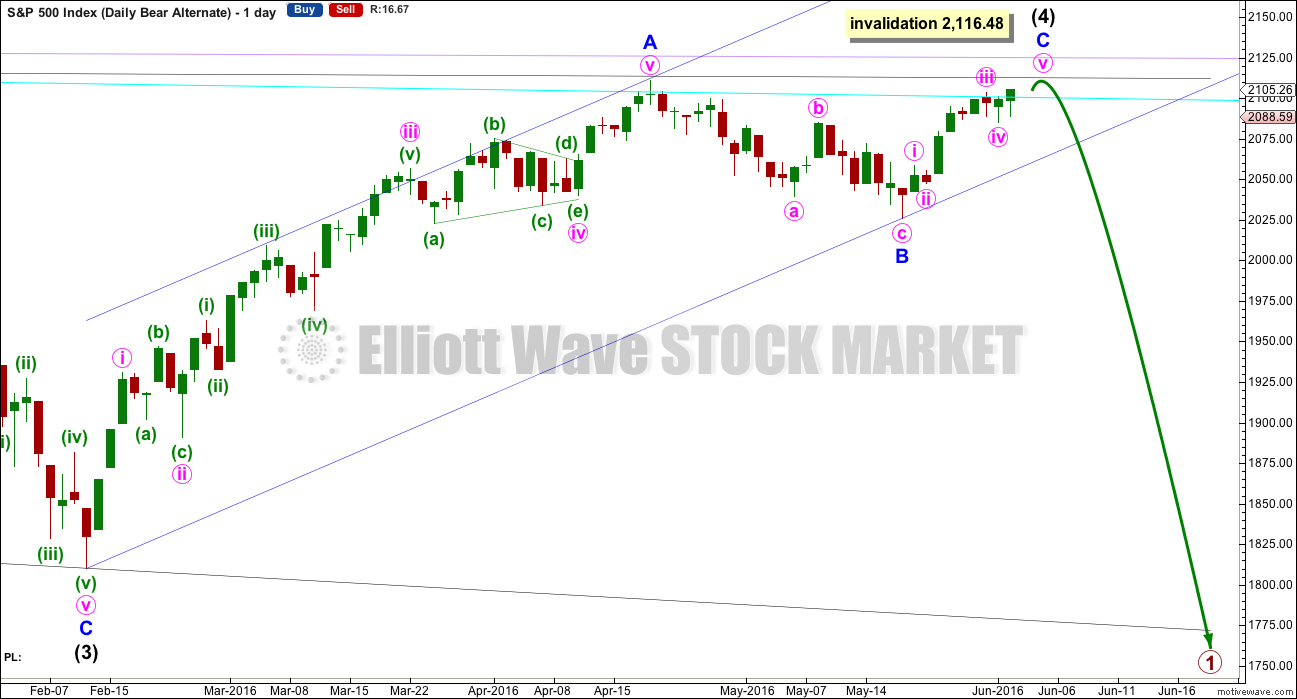
If intermediate wave (C) is over, then the truncation is small at only 5.43 points. This may occur right before a very strong third wave pulls the end of intermediate wave (C) downwards.
The next wave down for this wave count would be a strong third wave at primary wave degree. At 1,423 primary wave 3 would reach 2.618 the length of primary wave 1. This is the appropriate ratio for this target because primary wave 2 is very deep at 0.91 of primary wave 1. If this target is wrong, it may be too high. The next Fibonacci ratio in the sequence would be 4.236 which calculates to a target at 998. That looks too low, unless the degree of labelling is moved up one and this may be a third wave down at cycle degree just beginning. I know that possibility right now may seem absurd, but it is possible.
Alternatively, primary wave 3 may not exhibit a Fibonacci ratio to primary wave 1. When intermediate waves (1) through to (4) within the impulse of primary wave 3 are complete, then the target may be calculated at a second wave degree. At that stage, it may change or widen to a small zone.
Minor wave 2 fits perfectly as a very common expanded flat correction. Minute wave b is a 1.3 length of minute wave a, nicely within normal range of 1 to 1.38. If minute wave c is complete, it would be 5.86 points longer than 1.618 the length of minute wave a. If it continues a little higher tomorrow, then it may find resistance at the gold trend line which is a copy of the bear market trend line placed on the high labelled primary wave 2.
Minor wave 2 may not move beyond the start of minor wave 1 above 2,111.05. This is the risk to short positions at this stage.
If any members are choosing to enter short positions here, then manage risk carefully: Do not invest more than 3-5% of equity on any one trade and always use a stop loss to contain losses. Today short positions must now consider the alternate bear wave count published below. Both this main and the alternate expect new lows below 1,810.10, but their invalidation points are slightly different.
HOURLY CHART
Click chart to enlarge.
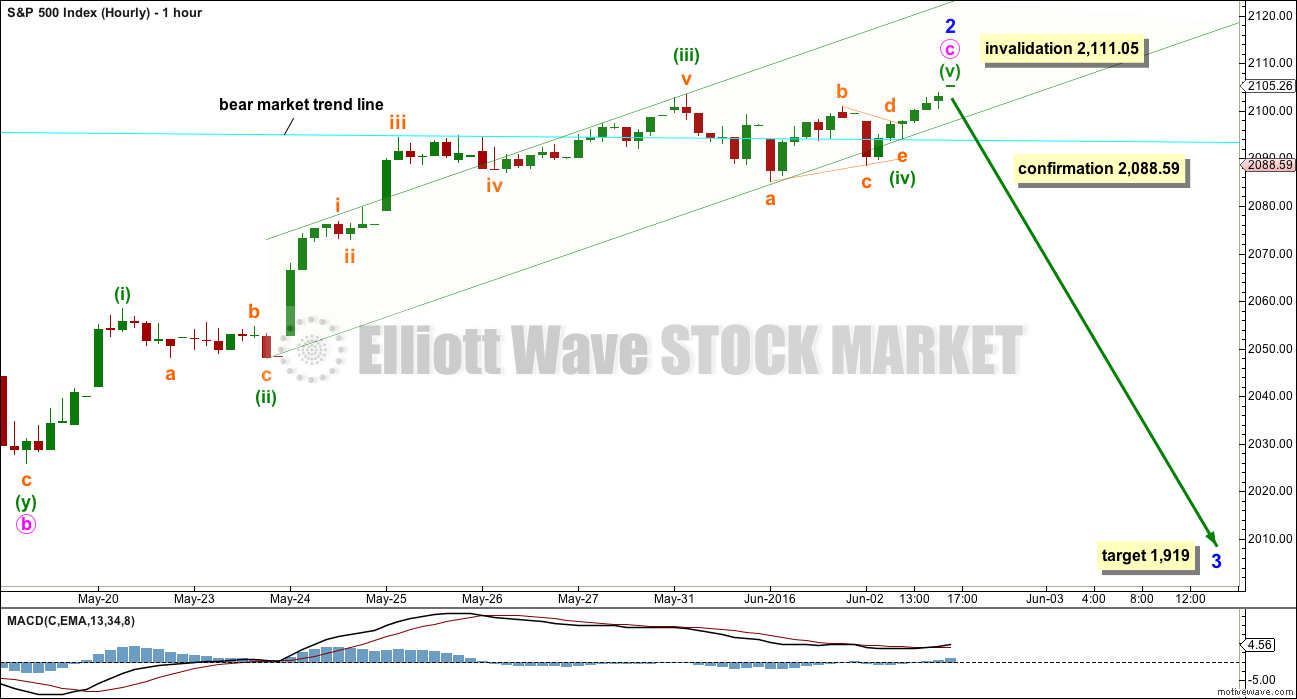
Minute wave c may be complete. I have two hourly wave counts today and this is the preferred wave count because it sees alternation between minuette waves (ii) and (iv). Minuette wave (ii) fits as a zigzag and minuette wave (iv) may have been a regular contracting triangle.
Minuette wave (iii) is 3.05 points longer than 1.618 the length of minuette wave (i). There is no adequate Fibonacci ratio between minuette wave (v) and either of (i) or (iii).
The channel here is drawn using Elliott’s second technique: the first trend line from the ends of the second to fourth waves, then a parallel copy on the end of the third wave. A breach of the lower edge of the channel would indicate a possible trend change.
A new low below 2,088.59 would invalidate the alternate below and provide some price confirmation of a trend change.
Minor wave 2 may not move beyond the start of minor wave 1 above 2,111.05.
At 1,919 minor wave 3 would reach 2.618 the length of minor wave 1. If minor wave 2 moves higher, then this target must also move correspondingly higher.
ALTERNATE HOURLY CHART
Click chart to enlarge.
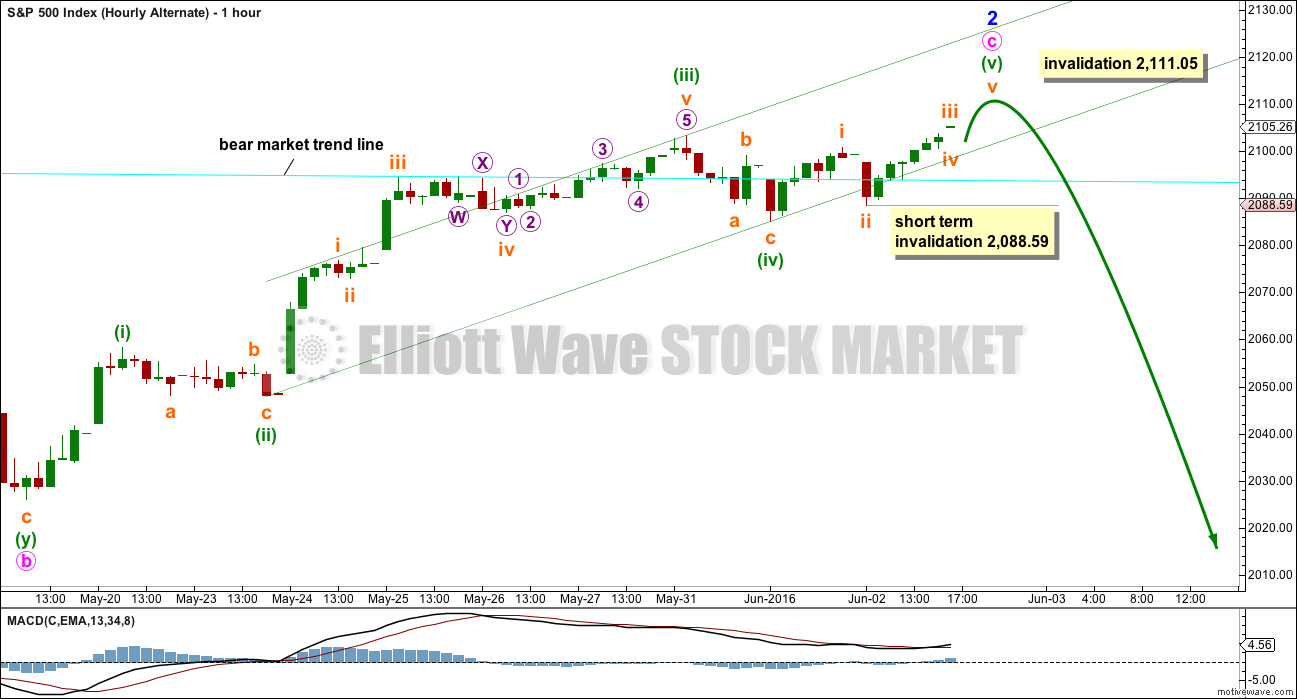
This alternate differs in the structure of minuette wave (iv). Here it is seen as a zigzag. There is no alternation in structure between minuette waves (ii) and (iv) which reduces the probability of this wave count to an alternate.
If minuette wave (iv) ended earlier as a zigzag, then minuette wave (v) would be incomplete. It must be a five wave structure. It may be either an ending diagonal or an impulse. Within minuette wave (v), subminuette wave iv may not move beyond the end of submineutte wave ii below 2,088.59 (the rule for a fourth wave of a diagonal).
There is no target given for minuette wave (v) because it has passed 0.618 the length of minuette wave (i). The next targets which may be calculated would all give a figure above the invalidation point at 2,111.05. Minuette wave (v) may not exhibit a Fibonacci ratio to minuette waves (i) or (iii).
When subminuette waves iii and iv are complete, then a target may be calculated at subminuette wave degree. That cannot be done yet.
ALTERNATE BEAR ELLIOTT WAVE COUNT
WEEKLY CHART
Click chart to enlarge.
This alternate has been published before. It was not published for some time to minimise the number of charts and keep the analysis a little simpler. It is again necessary though.
There are two possible structures for the start of a new trend, either an impulse (main wave count) or a leading diagonal (this alternate).
An impulse is more common than a leading diagonal which reduces the probability of this wave count to an alternate. However, the main wave count also has a rare running flat, so on balance this alternate should still be considered.
Within a leading diagonal, subwaves 2 and 4 must subdivide as zigzags. They are commonly very deep, between 0.66 to 0.81 the prior wave. Here intermediate wave (2) is 0.93 of intermediate wave (1) and so far intermediate wave (4) is 0.98 of intermediate wave (3). Both these subwaves are much deeper than normal, so this reduces the probability of this wave count a little more.
While leading diagonals are not as common as impulses for first waves, leading expanding diagonals are less common still. They are not exactly rare structures, but they are not common. This diagonal would be expanding: the third wave is longer than the first, the fourth wave is longer than the second, and the trend lines diverge. All rules are met.
Subwaves 1, 3 and 5 are most commonly zigzags within leading diagonals, but sometimes they may also appear to be impulses. Here so far intermediate waves (1) and (3) fit perfectly as zigzags.
Intermediate wave (4) may end a little higher when price comes to touch the (1) – (4) trend line. This line is drawn from the end of intermediate wave (1) along to the high of minor wave A within intermediate wave (4).
Intermediate wave (4) may not move beyond the end of intermediate wave (2) above 2,116.48.
Leading diagonals may not have truncated fifth waves. Intermediate wave (5) must move below the end of intermediate wave (1) at 1,810.10. Intermediate wave (5) must be longer in length than intermediate wave (3) which was 306.38 points.
If the next wave down does not show an increase in momentum or volume beyond intermediate wave (3), then this would be an explanation.
DAILY CHART
Click chart to enlarge.
Intermediate wave (4) must subdivide as a zigzag. Within the zigzag, minor wave C is likely to move at least slightly above the end of minor wave A at 2,111.05 to avoid a truncation.
No target is given for intermediate wave (4) to end because the best guide is likely to be the (1) – (4) trend line.
This wave count must see the downwards wave labelled minute wave c within minor wave B as a five wave structure. This is possible, but it looks forced on the daily and hourly chart levels. This reduces the probability of this wave count.
Momentum and volume of the next wave down would indicate which bear wave count is correct (if price remains below 2,111.05). A new high above 2,111.05 would invalidate the main bear wave count and confirm this alternate.
When the leading diagonal is complete, then a very deep second wave correction would be expected. This alternate wave count expects the box on the first weekly chart to remain essentially intact several more months.
BULL ELLIOTT WAVE COUNT
WEEKLY CHART
Click chart to enlarge.
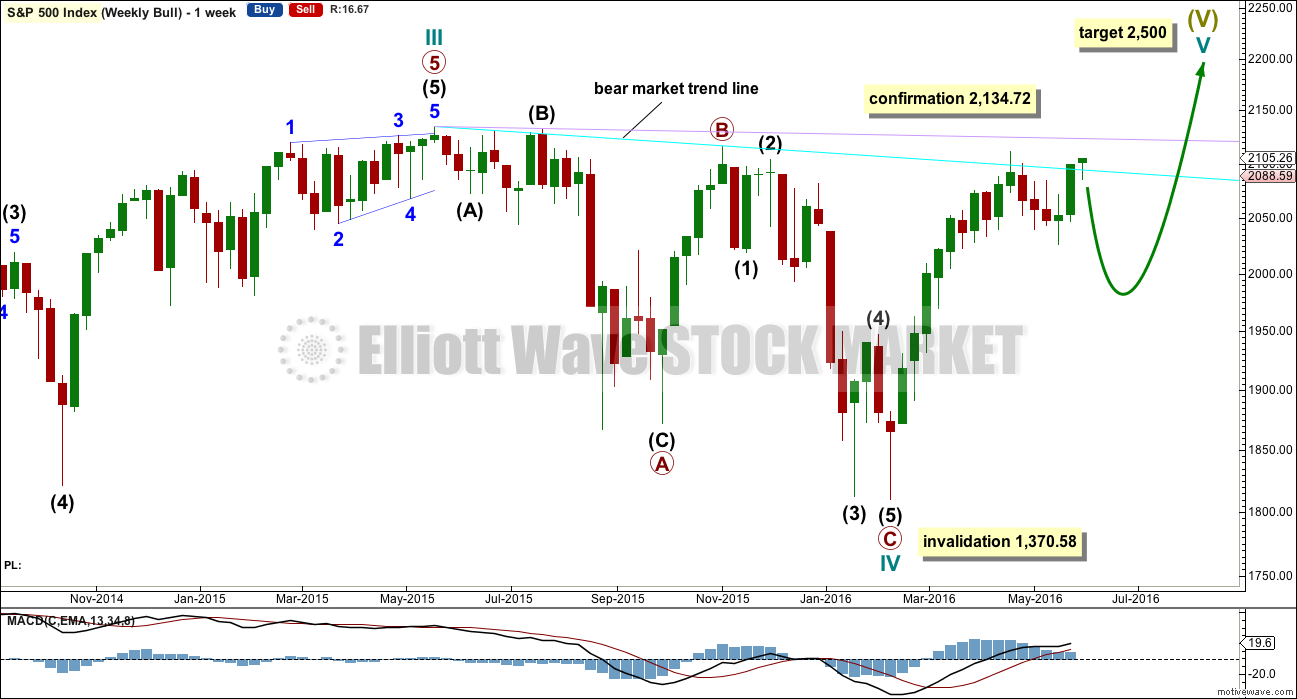
Cycle wave IV is seen as a complete flat correction. Within cycle wave IV, primary wave C is still seen as a five wave impulse.
Intermediate wave (3) has a strong three wave look to it on the weekly and daily charts. For the S&P, a large wave like this one at intermediate degree should look like an impulse at higher time frames. The three wave look substantially reduces the probability of this wave count. Subdivisions have been checked on the hourly chart, which will fit.
Cycle wave II was a shallow 0.41 zigzag lasting three months. Cycle wave IV may be a complete shallow 0.19 regular flat correction, exhibiting some alternation with cycle wave II.
At 2,500 cycle wave V would reach equality in length with cycle wave I.
Price remains below the final bear market trend line. This line is drawn from the all time high at 2,134.72 to the swing high labelled primary wave B at 2,116.48 on November 2015. This line is drawn using the approach outlined by Magee in the classic “Technical Analysis of Stock Trends”. To use it correctly we should assume that a bear market remains intact until this line is breached by a close of 3% or more of market value. In practice, that price point would be a new all time high which would invalidate any bear wave count.
This wave count requires price confirmation with a new all time high above 2,134.72.
While price has not made a new high, while it remains below the final bear market trend line and while technical indicators point to weakness in upwards movement, this very bullish wave count comes with a strong caveat. I still do not have confidence in it.
The invalidation point will remain on the weekly chart at 1,370.58. Cycle wave IV may not move into cycle wave I price territory.
This invalidation point allows for the possibility that cycle wave IV may not be complete and may continue sideways for another one to two years as a double flat or double combination. Because both double flats and double combinations are both sideways movements, a new low substantially below the end of primary wave C at 1,810.10 should see this wave count discarded on the basis of a very low probability long before price makes a new low below 1,370.58.
DAILY CHART
Click chart to enlarge.
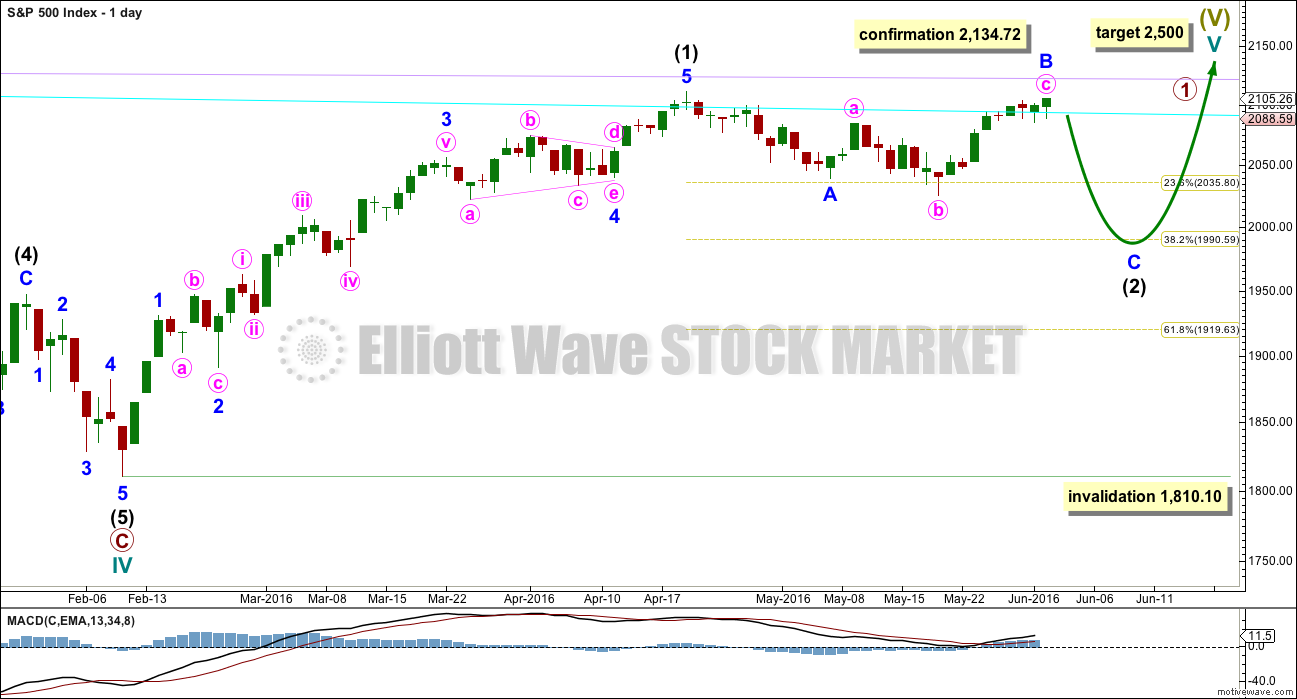
If the bull market has resumed, it must begin with a five wave structure upwards at the daily and weekly chart level. That may today be complete. The possible trend change at intermediate degree still requires confirmation in the same way as the alternate hourly bear wave count outlines before any confidence may be had in it.
Intermediate wave (2) may be an incomplete zigzag. Within the zigzag, minor wave B may now be a complete expanded flat. At 1,988 minor wave C would reach 1.618 the length of minor wave A. This ratio is used for this target because intermediate wave (2) should be expected to be relatively deep. If this target is wrong, it may not be low enough. The next likely target would be the 0.618 Fibonacci ratio at 1,920.
In the long term, this wave count absolutely requires a new high above 2,134.72 for confirmation. This would be the only wave count in the unlikely event of a new all time high. All bear wave counts would be fully and finally invalidated.
TECHNICAL ANALYSIS
WEEKLY CHART
Click chart to enlarge. Chart courtesy of StockCharts.com.
There is a bearish engulfing candlestick pattern at the last high. This has occurred at the round number of 2,100 which increases the significance. Volume on the second candlestick is higher than volume on the first candlestick, which further increases the significance. That it is at the weekly chart level is further significance.
Engulfing patterns are the strongest reversal patterns.
Now this pattern is followed by another red weekly candlestick. The reversal implications of the pattern are confirmed.
This is a very strong bearish signal. It adds significant weight to the expectation of a trend change. It does not tell us how low the following movement must go, only that it is likely to be at least of a few weeks duration.
There is also a Three Black Crows pattern here on the weekly chart. The first three red weekly candlestick patterns are all downwards weeks. The pattern is not supported by increasing volume and only the third candlestick closes at or near its lows; these two points decrease the strength of this pattern in this instance. That the pattern occurs at the weekly chart level increases its strength.
Last week completes a strong bullish candlestick, but it comes on declining volume. Price was not supported by volume although price managed to move substantially higher.
This pattern was seen back in July 2015 on this weekly chart. The week ending 13th of July, 2015, completed a strong bullish candlestick after a week immediately prior which completed a candlestick with a small real body and a long lower wick. The second candlestick there too came on declining volume. The following week managed to make a slight new high, but the advance of the bullish candlestick was fully retraced within two weeks.
The conclusion must be that this candlestick is bullish and would support more upwards movement. But the decline in volume is very concerning and indicates that if price does continue higher, it may not be by much.
On Balance Volume trend lines have been redrawn. OBV is constrained within two larger lines (green and orange). A break above the green line would be a strong bullish signal. A break below the orange line would be a strong bearish signal. OBV is constrained more short term between the two pink lines. The upper line may provide resistance; a break above it would be a weak bullish signal. The lower line has been tested and breached; this line is weak. A break below the lower pink line would be a weak bearish signal.
There is some long held divergence here between On Balance Volume and price. Between the last two major swing lows in price at the end of August 2015 and early February 2016, price made new lows but OBV made a higher low. This regular bullish divergence indicated the February low in price was weak. It was followed by a major upwards swing from price.
Now, from the major swing high for price in early November 2015 to the last major swing high in April 2016, price has made a lower high but OBV has made a higher high. Price cannot make a corresponding new high despite OBV making a new high. Price is weak. This hidden bearish divergence now supports the Elliott wave count.
DAILY CHART
Click chart to enlarge. Chart courtesy of StockCharts.com.
Volume data on StockCharts is different to that given from NYSE, the home of this index. Comments on volume will be based on NYSE volume data when it differs from StockCharts.
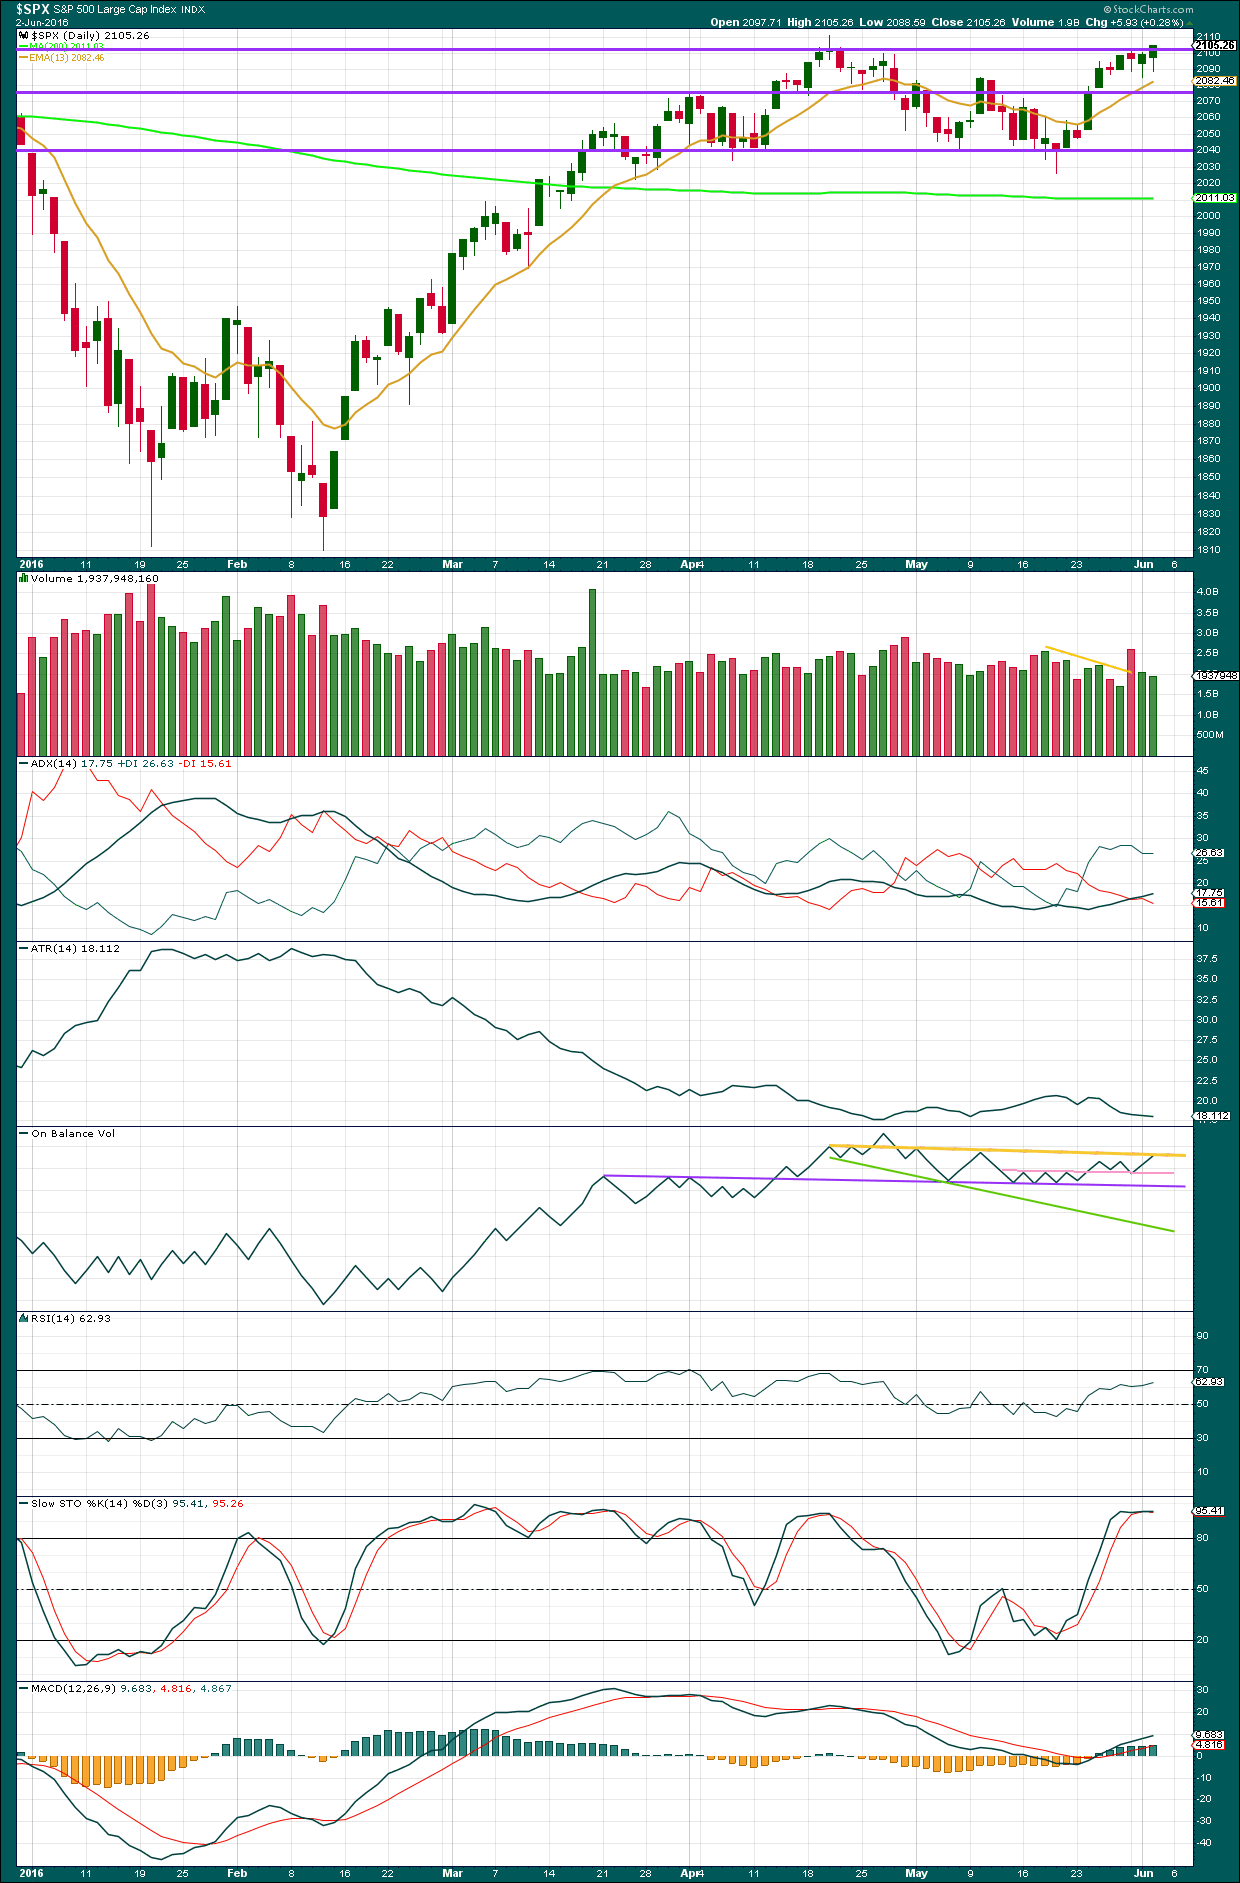
The hanging man candlestick has either not worked or was an early warning of an approaching high.
Price has moved higher on declining volume for two days in a row. The rise in price is not supported by volume, so it is suspicious. It is not sustainable. However, we can see prior examples on this daily chart where price moved up on declining volume and it did not indicate an end to upwards movement: 19th and 22nd February, 24th and 25th of February, 11th and 12th of March, and 6th and 9th of May. Lighter volume is concerning for a bullish wave count, but it will not tell us when and where a bear market rally will end. It just indicates weakness.
The day with strongest volume recently is the downwards day of 31st of May. This was the strongest volume seen back to 29th of April, which was also a downwards day.
The volume profile is bearish.
ADX still indicates an upwards trend is in place. ATR still disagrees as it is declining. This upwards movement looks more like a bear market rally than a bull market advance; there is something wrong with it.
On Balance Volume has today come up to touch the yellow line. This line could be redrawn with a shallower slope, depending on which highs it is drawn across. This line has been broken before and yet OBV returned below it, so it does not have strong technical significance. A break above this line would be a bullish indicator, but not a strong one.
A break below the pink line would be a weak bearish signal. A break below the purple line would be a strong bearish signal.
There is no divergence between price and RSI today to indicate any weakness to this upwards trend. RSI is not yet extreme. There is further room for price to rise.
Price made a new high today above the prior high of 31st of May yet Stochastics did not. This divergence is bearish, but it is weak and unreliable. I would not put much weight on short term divergence between price and Stochastics.
VOLATILITY – INVERTED VIX DAILY CHART
Click chart to enlarge. Chart courtesy of StockCharts.com.
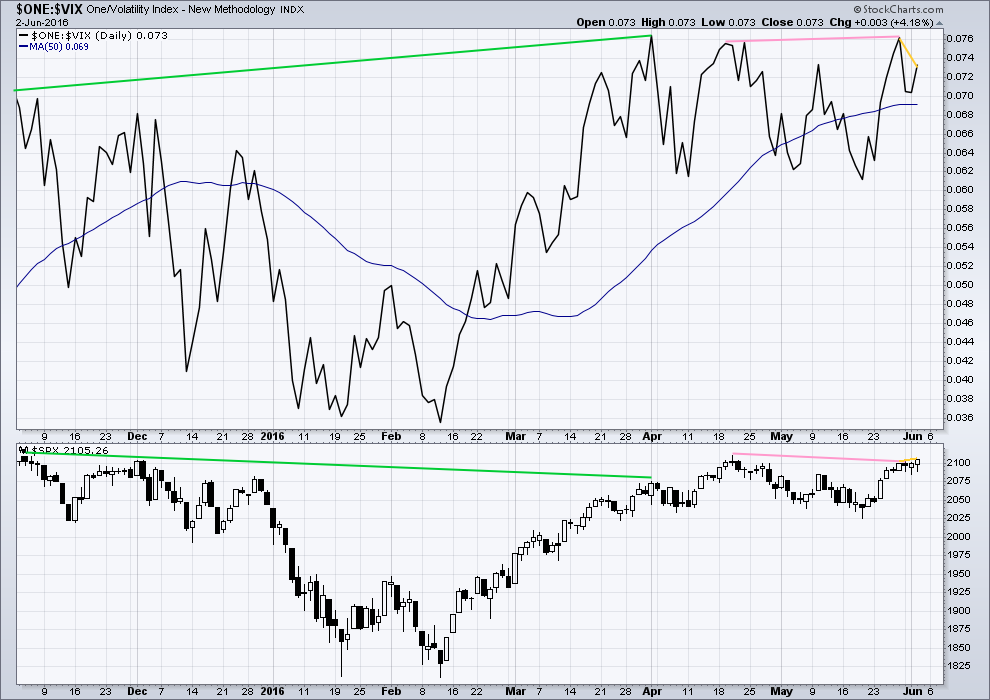
Volatility declines as inverted VIX climbs. This is normal for an upwards trend.
What is not normal here is the divergence over a reasonable time period between price and inverted VIX (green lines). The decline in volatility did not translate to a corresponding increase in price. Price is weak. This divergence is bearish.
There is now double negative hidden bearish divergence between price and VIX (pink lines). At the end of last week, VIX has made a new high above the prior swing high of 20th of April yet price has failed to make a corresponding new high. This indicates weakness in price. Volatility has declined below the point it was at on 20th of April, but this has failed to be translated into a corresponding rise in price.
Again, there is divergence today with price and VIX (yellow lines). Price made a new high above the prior high of 27th of May yet VIX has not made a new high (VIX has made a lower high). This divergence is clear and strong. I would put a lot of weight on divergence between price and VIX. This indicates that price has made a slight new high, but it does not come with a corresponding decline in volatility. This is regular bearish divergence and indicates exhaustion for bulls.
BREADTH – ADVANCE DECLINE LINE
Click chart to enlarge. Chart courtesy of StockCharts.com.
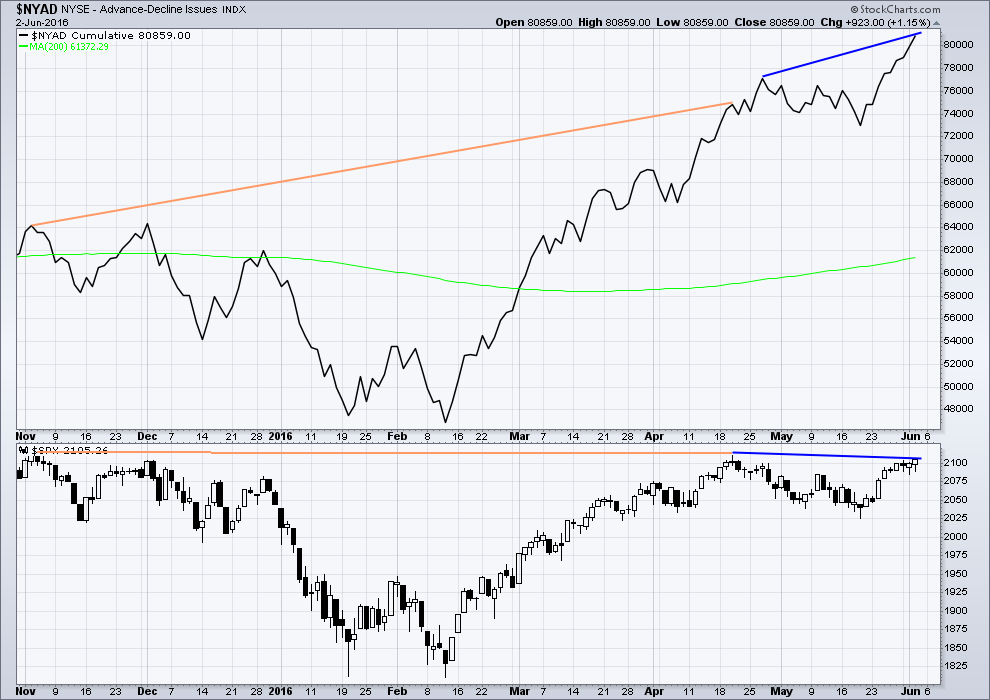
With the AD line increasing, this indicates the number of advancing stocks exceeds the number of declining stocks. This indicates that there is breadth to prior upwards movement.
From November 2015 to 20th April, the AD line made new highs while price far failed to make a corresponding new high. This indicates weakness in price; the increase in market breadth is unable to be translated to increase in price (orange lines).
The 200 day moving average for the AD line is now increasing. This alone is not enough to indicate a new bull market. During November 2015 the 200 day MA for the AD line turned upwards and yet price still made subsequent new lows.
There is now double hidden bearish divergence between price and the AD line (dark blue lines). The AD line has made a new swing high above the prior high of 20th of April. This increase in breadth to upwards movement has failed to translate into a corresponding rise in price. Price has failed to make a new high above 20th of April. This indicates weakness in price.
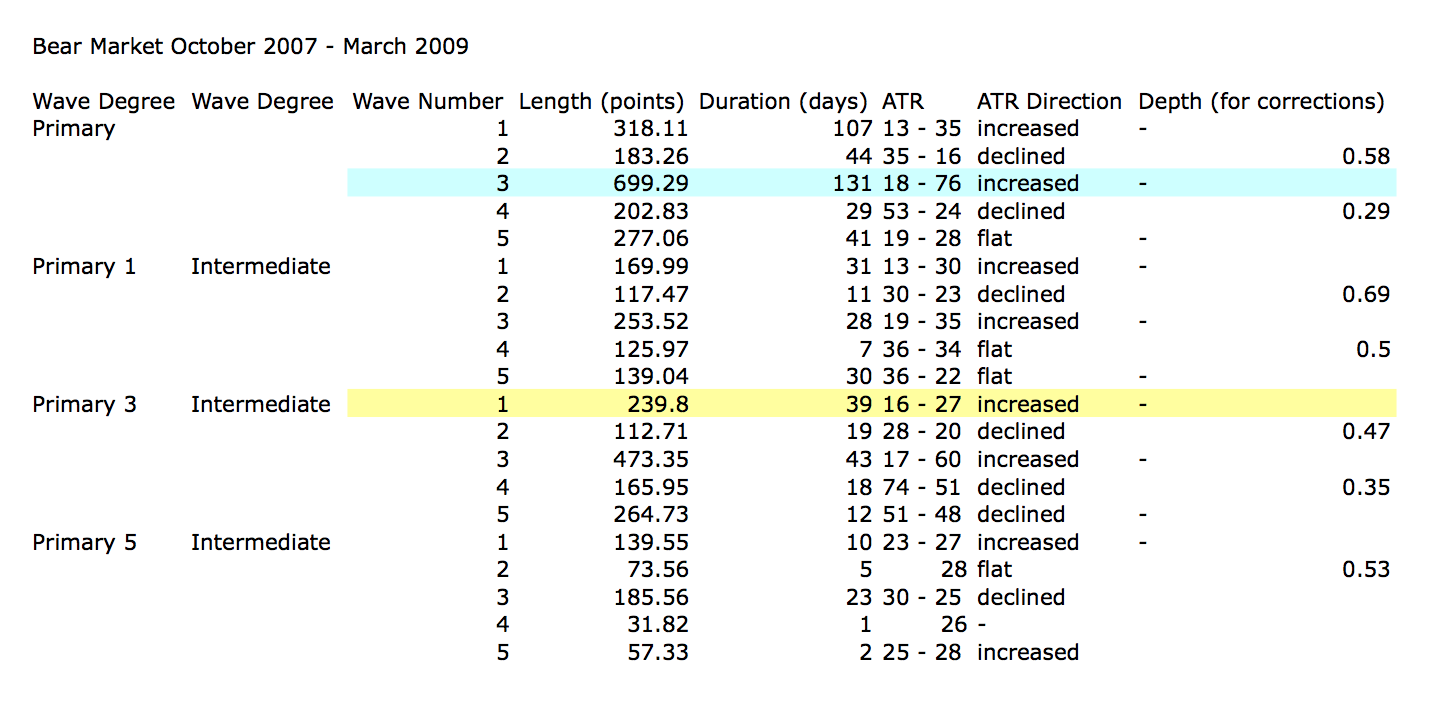
ANALYSIS OF LAST MAJOR BEAR MARKET OCTOBER 2007 – MARCH 2009
Click to enlarge.
In looking back to see how a primary degree third wave should behave in a bear market, the last example may be useful.
Currently, the start of primary wave 3 now may be underway for this current bear market. Currently, ATR sits about 19. With the last primary degree third wave (blue highlighted) having an ATR range of about 18 to 76, so far this one looks about right.
The current wave count sees price in an intermediate degree first wave within a primary degree third wave. The equivalent in the last bear market (yellow highlighted) lasted 39 days and had a range of ATR from 16 – 27.
To see some discussion of this primary degree third wave in video format click here.
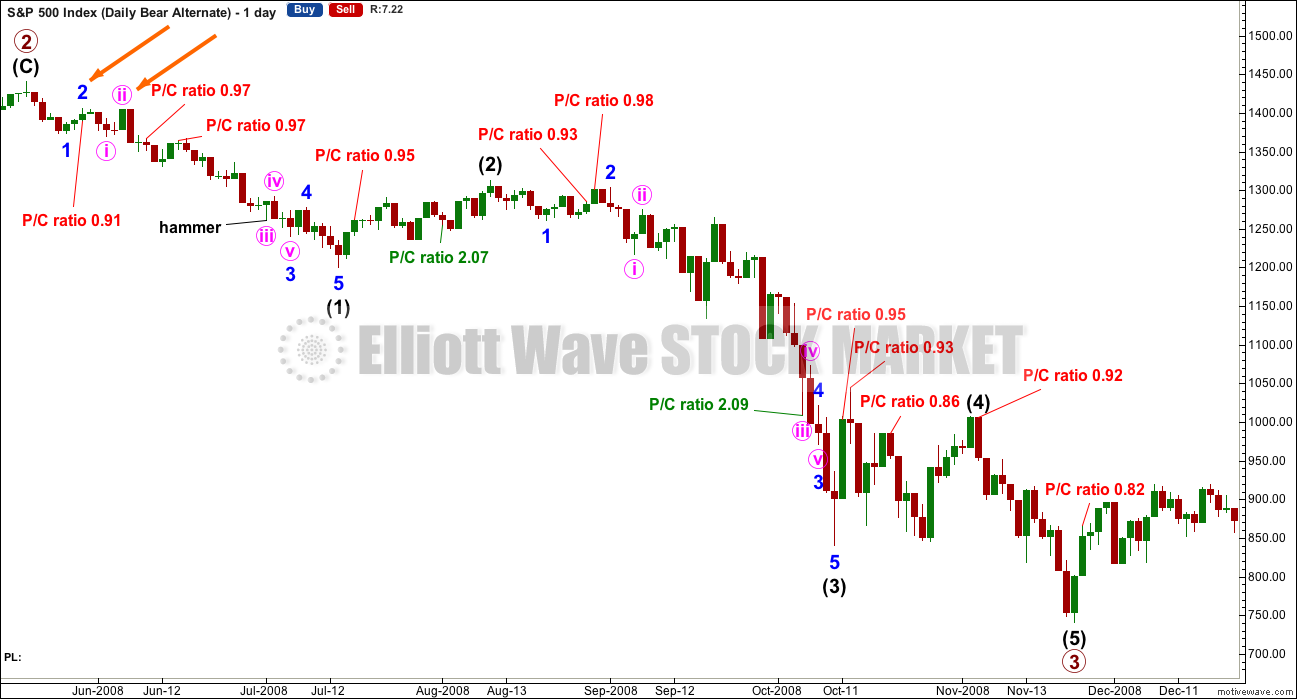
Click chart to enlarge.
This chart is shown on an arithmetic scale, so that the differences in daily range travelled from the start of primary wave 3 to the end of primary wave 3 is clear.
Primary wave 3 within the last bear market from October 2007 to March 2009 is shown here. It started out somewhat slowly with relatively small range days. I am confident of the labelling at primary degree, reasonably confident of labelling at intermediate degree, and uncertain of labelling at minor degree. It is the larger degrees with which we are concerned at this stage.
During intermediate wave (1), there were a fair few small daily doji and ATR only increased slowly. The strongest movements within primary wave 3 came at its end.
It appears that the S&P behaves somewhat like a commodity during its bear markets. That tendency should be considered again here.
Looking more closely at early corrections within primary wave 3 to see where we are, please note the two identified with orange arrows. Minor wave 1 lasted a Fibonacci 5 days and minor wave 2 was quick at only 2 days and shallow at only 0.495 the depth of minor wave 1.
Minute wave ii, the next second wave correction, was deeper. Minute wave i lasted 3 days and minute wave ii was quick at 2 days but deep at 0.94 the depth of minute wave i.
What this illustrates clearly is there is no certainty about second wave corrections. They do not have to be brief and shallow at this early stage; they can be deep.
This chart will be republished daily for reference. The current primary degree third wave which this analysis expects does not have to unfold in the same way, but it is likely that there may be similarities.
Put / Call ratios are added from data published at CBOE. This ratio is the index ratio published, not the ratio specifically for the S&P500. It should be a reasonable indicator of sentiment. Only values above 2 and below 1, extremes, are noted. A low P/C ratio indicates more long positions than short, so it is interpreted as bearish, a contrarian indicator. A high P/C ratio indicates more short than long positions, so it is interpreted as bullish, a contrarian indicator.
There were two instances where the P/C ratio gave a bullish extreme above 2 during primary wave 3. One instance happened right at the end of the middle of the third wave. My conclusion is that the P/C ratio may be a reasonable sentiment indicator, but it is not to be taken definitively. It should be one piece of information weighed up alongside other information. Currently, the index P/C ratio is not extreme. Only extremes will be noted.
DOW THEORY
The last major lows within the bull market are noted below. Both the industrials and transportation indicies have closed below these price points on a daily closing basis; original Dow Theory has confirmed a bear market. By adding in the S&P500 and Nasdaq a modified Dow Theory has not confirmed a new bear market.
Within the new bear market, major highs are noted. For original Dow Theory to confirm the end of the current bear market and the start of a new bull market, the transportation index needs to confirm. It has not done so yet.
Major lows within the prior bull market:
DJIA: 15,855.12 (15th October, 2014) – closed below on 25th August, 2015.
DJT: 7,700.49 (12th October, 2014) – closed below on 24th August, 2015.
S&P500: 1,821.61 (15th October, 2014) – has not closed below this point yet.
Nasdaq: 4,117.84 (15th October, 2014) – has not closed below this point yet.
Major highs within the new bear market:
DJIA: 17,977.85 (4th November, 2015) – closed above on 18th April, 2016.
DJT: 8,358.20 (20th November, 2015) – has not closed above this point yet.
S&P500: 2,116.48 (3rd Nobember, 2015) – has not closed above this point yet.
Nasdaq: 5,176.77 (2nd December, 2015) – has not closed above this point yet.
It is a reasonable conclusion that the indices are currently in a bear market. The trend remains the same until proven otherwise. Dow Theory is one of the oldest and simplest of all technical analysis methods. It is often accused of being late because it requires huge price movements to confirm a change from bull to bear. In this instance, it is interesting that so many analysts remain bullish while Dow Theory has confirmed a bear market. It is my personal opinion that Dow Theory should not be accused of being late as it seems to be ignored when it does not give the conclusion so many analysts want to see.
This analysis is published @ 01:04 a.m. EST on 3rd June, 2016.
Wow… I guess I missed a lot of action here late in the day.
I don’t see anyone commenting on the SPX doji candlestick on the weekly chart.
ES also has one on the weekly. Some of the other indexes have it as well.
Crikey. Missed that in all the morass of work and what not going on today.
Yes. A weekly doji.
Interesting….
Setting up for an evening doji star perhaps? Not yet though. Just a doji.
Looks like another hanging man on my chart.
I have been thinking about something you said about futures Joe and I think you are onto something. You mentioned that it has been a while since we have seen futures really jacked up and you are right. It could be they are leveraged out. I have a gut feeling that the next big clue we are going to see to a really big move down will be in tanking futures. It happened after the jobs report but they were able to buy the resulting dip. There could be some exogenous event that scares the crowd so badly they will not be able to buy the dip. I know you expect it to happen intra-day but I think we will first see the loss of control in the futures market. Just a thought. 🙂
A question to Verne and Olga specifically, and generally any other members very experienced with VIX:
The divergence I’m seeing with VIX (inverted from StockCharts) and price of S&P, how much weight would you give it?
Background: I have learned to not give much weight to short term divergence to most oscillators such as Stochastics and price, I’ve learned to give reasonable weight to divergence between RSI and price, but I’m less certain about VIX. So far I’d give it quite a lot of weight, but I wanted your opinions as you guys really are experts here.
I think it is important.
From 1990 to 2014 CBOE data show the average close for VIX was around 20.
Back around 2014 people were so amazed by the persistent low readings that folk were starting to say that the VIX was “broken” The average in 2014 was actually just under 14. The average in 2015 was even lower until that multi-year spike we saw in August ushered in a new several months of heightened volatility that lasted through February of this year. In fact it was the way VIX was acting that convinced me that the market had made a major turn and that Lara’s designation of a primary degree decline was right on the money.
I know we have already identified the top of primary two on April 18 at 2111.05 and VIX made a low of 12.5 that day. So far on this minor wave two top VIX has not made a new low but it could if price moves any higher next week. UVXY, on the other hand, has been making a constellation of new 52 week lows, eight in all, the last few weeks. It seems to be a time of extreme complacency for VIX futures, more pronounced than I have ever seen it, and consistent with a critical inflection point – either the start of a major run higher, or a substantial decline. I think the latter is more likely.
Thank you very much Verne.
I’m going to take a look at the monthly chart of VIX and see how well longer term divergence worked out; did it precede a big move in price?
I’m noting some current divergence at the monthly chart level with price and VIX… so far VIX has made a new high (inverted) above the high early November, but price (so far) has not.
What that tells me is while price has been moving higher for the last two or so months it hasn’t made a new high but volatility has declined to a lower point than early November 2015.
It tells me price is weak.
Most interesting.
I’m still working on this…
You’re right on about that low in February too Verne. Huge divergence there between price and VIX. You’ve pointed that out to me before… sorry… I’m a bit slow sometimes. I have noticed it before, now I’m going to put it into a wider context.
I’m adding looking at VIX on the monthly chart to my daily analysis. I think this will be useful.
And to those who have comments moderated by me from time to time, don’t take it personally.
I often type delete type delete… I know how frustrating this market can be, how annoying it is for you all when my analysis expects something to happen and it doesn’t, and how others comments can get to one and exasperate existing emotions.
It’s my job to remain professional and moderate. I completely understand the frustration, please don’t let my moderation be taken as a personal slight. It’s not meant so.
My money is underwater. It’s never easy. But I am neither annoyed at anyone nor the market. The EW count already helped me a lot. Perhaps it’s my skill level regarding the timing. Perhaps it is the timing that is the problem. What if the expanded flat in Minor 2 still goes on? Then we will need to change the channel again. I am using 2132 to 1872 of primary 1 to project fib time from 2111 for primary 3 and found that morning of June 4 is at 61.8% line. So it could be Monday June 6 that is the big day? Also, I heard Hurst cycle analysis predicts late May or early June to see a major happening.
Lets remain civil and polite. I’ve removed a comment because IMO it’s bordering on not being as polite as I would like.
Disagreement is absolutely okay, but please be careful how it’s worded. Focus on price, technicals and analysis. Do not focus on personalities of other members please.
My standards for how we communicate are very high. They may be too high for some, that’s okay. It’s my site and that’s how I’m going to run it. My goal is for everyone to remain polite and civil so that all are comfortable in sharing their analysis even if it goes well against what the majority (including me) are expecting.
Only when we are all confident that we won’t receive any negative personal comments for sharing views can we all be comfortable sharing those views.
I also want the chat amongst each other, the making friends and just hanging out together, to continue for those who want it. It adds value to all of us.
We are all entitled to our different views. Views on where the market is heading should be backed by some technical analysis, because this is a technical analysis site not a Make Random Predictions Of Markets site.
Finally, if any member has a specific problem with what’s going on in this forum please email me directly admin@elliottwavestockmarket.com and I will deal with it in that way, more discretely.
now can we have a group hug?
group hug
I always remember a quote from Walter Deemer, 30+ year TA pro….”in the end the market will do what the market wants to do”
Yep.
The market can remain irrational longer than we can remain solvent.
In other words, price is the final determinator, and it’s always right.
I’ll be the first to admit I’ve been wrong in the past and I’ll be wrong in the future.
Simples!
kool,, now thats a group hug,, is that Verne on the bottom? I am the very handsome one,,
Now if you could find a bear and a bull in a hug… that’d be right on!
Thanks for moderating Lara. This forum is one of the few places where I feel the liberty to think out loud as it were and enjoy friendly banter with other members. It is really sad to see how some forums can descend into the worst kind of unpleasantness due to a lack of civility in cases where folk disagree. Hey guys feel free to tell me “put a sock in it” when you get tired of the stream of consciousness commentary…. 🙂
It’s why my YouTube channel has comments turned off.
YouTube really is the worst most vile pit of nastiness.
I had someone send me a direct message on YouTubes recently suggesting that allowing comments would be beneficial, allowing viewers to engage.
Nope. Not happening. I did for a while and turned them off because I received some…. weird… and completely inappropriate comments.
It really is quite startling the things people post on internet forums. Until I became a member of EWSM I studiously avoided them. The atmosphere here is unique; I have not seen anyplace else quite like it.
The word “classy” comes to mind… 🙂
I think it is very interesting how different people interpret what is happening within the market, I also find it very helpful reading the daily comments from members and following the price action helping me learn, we are currently in a tence moment for price action and it definitely is being reflected in emotions! Keep your trading opinions coming folks but remember we are all wrong until proven right! Reguardless I’m staying bearish until like Lara says we are proven wrong!
Lara…Quick technical question. Do you interpret today’s S&P candle as another hanging man? I would think it qualifies and provides some evidence of buying exhaustion.
It does technically qualify as a hanging man because the lower shadow is more than 2X the real body.
But the bullish implications of the long lower shadow require the next day to give bearish confirmation. That would be an open below the real body or preferably also a close below the real body.
I’m wondering if we can view today’s candle as a Bearish Harami with a long lower shadow.?
I guess so, but I don’t think it’s a very good one.
I’m checking Nison and he doesn’t say how long the first real body has to be, but he does say it should be long. The real body for June 2nd isn’t really long, it’s quite small.
The second real body is contained within the first.
I’m not going to call it a harami though, I think the first real body is too small.
Lara,
During the last couple days here in your comment thread we’ve been told that your main wave count doesn’t have the “right look.” And I agree that looking at, say, a weekly chart of the last five years, even seasoned EW students can easily end up labeling the waves up differently than you do, seeing the last ATH as the top of Primary 3.
But I recall your repeated careful explanations over the last couple years as to why you label the top of Primary 3 where you do, in September 2013. That, to me, is critical to understanding your Bearish wave count. And I confess that even after totally grasping your point, my eye still wants to label the Bull run the other way.
It might be helpful to remind us again of that key piece of the puzzle.
Just a thought…
No matter how you label the movement up from the low of 666.79 there are a couple of points about that movement of which we can be sure in EW terms:
The first move up from March 2009 to May or July 2011 is most likely a five. The following move down to the low on October 2011 is most likely a three.
From October 2011 to the all time high in May 2015 the structure is an impulse. Any trend lines which provided support during that part of the bull market have been well and truly broken.
My conclusion is this move is a 5-3-5. Which could be 1-2-3 of an impulse (bull wave count) or A-B-C of a zigzag (main bear wave count).
The only other possibility is it could be a double zigzag, 3-3-3.
I’ll publish the daily chart of all the detail within cycle wave c today, and I’ll go over the possibilities in the video.
For now I did publish that chart in response to a query from Stuart yesterday here, in comments underneath the video.
But Stuart was referring to cycle wave a, not cycle wave c.
So I’ll go back over that too.
Thank you Lara,
I appreciate your relentless pursuit of excellence and precision in your analysis, and your patience in explaining it all so clearly and carefully!
My consolation for today is that NASDAQ is down double percentage points more than SPX. Tech sector has been leading the way down over the past 18 months, so the fact that it was much lower today is a good sign. I think others will follow…
Have a good wknd everyone. As we’ve been saying every Friday for the past several weeks, next week should be very telling… 😉
Transportations are down hugely too.
Hence the requests I had a few times for update to NASDAQ as looking at S&P alone is a narrow view.
consider me shocked we didn’t close the upside gap…shocked
We did not fill the closing gap, but we did penetrate the low from yesterday’s price action. The banksters burned a lot of dough today…a lot of dough….
Vern,
Banksters don’t care, it is retail trading folks that have limited supply for trading that get burnt faster.
You’re right. In some instances they are actually allowed to use 35 to 1 leverage in their trades which is absolutely incredible! Their intervention in the market is not merely a matter of keeping prices propped up, in many cases it has to do with their very survival. This is something that a lot of folk also overlook when it comes to the interest rate discussion and why the FED is in a bind. Even as little as a 25 basis point hike will have multi trillion dollar implications for some leveraged instruments!
Of course our own interest payments on the National debt is also a huge consideration.
Vern,
Any idea where we can get reliable numbers on houses that were possessed by banks during last market drop? I suspect the inventory on banks books is still showing inflated asset valuation and low interest rates might stick around long enough for major holders to offload the inventory from their books. Don’t forget FED is a group of bankers (or their delegated reps).
Hey Ris, do you have access to a Bloomberg terminal? If you do I can tell you how to get quite a bit of that kind of info. If not, the Fannie Mae and Freddie Mac websites can give some rough numbers. Congress quietly changed the rules that required banks to disclose the true value of assets on their books. That is another hidden, ticking time bomb in the financial markets.
The invalidation point has so far held.
So far we have a lower low and a lower high today.
We have seen wrestling around the pivot of 2,100 and the bear market trend line before. But I agree with Verne; the more price mucks around here the more concerning it is. It looks like resistance may become support and price may move up and away, not down and away.
We can be certain it will move, but which direction? My money (literally) is still on down because that’s what volume particularly is telling me.
So far price cannot break above the copy of the bear market trend line which was where the April high reached. While price remains below that line and below 2,111.05 then it is likely price will move downwards away from this area.
At the daily chart level it does look like a slow rounding top is forming for the end of minor wave 2 (or intermediate wave (4) )
Which is a common pattern for the S&P
The idea that a 2nd wave has to follow a certain path based on the degree of wave the market is in doesn’t jive with Elliott Wave Theory.
To me, in hindsight of course, a 2nd wave can be deep no matter what wave position you are in.
This does look like a deep zig zag, and we now have a beautiful looking H&S top forming on the 15 minute chart.
This isn’t wait and see. This is active positioning for a major move down at multiple degrees.
Next week will show up as decisive and brutal.
I do hope so. That should reduce the emotion in this forum, which normally I can cope with okay but am struggling with TBH ATM.
I’d also like to see this market get moving. It does make analysis easier.
Don’t mind the chattering Lara. Better folk get their frustration off their chest than bottle it up inside and it in no way reflects badly on you. All part of the trader’s rite of passage I think. I too think that when the downside move comes its going to be impressive. It’s just taking its ole sweet time!
Quite few bears headed for the hills today. Mid and long term I remain fully loaded and have been for months… 🙂
I have often thought actually that this forum could even be a small (completely unscientific) contrarian indicator 🙂
You may have quite a point there! In fact I consider myself a contrarian indicator. 🙂
When the banksters start to rattle my cage it’s time…. 😀
What I find interesting is that there is so much emotion around these levels. For example, both in mid April and now Lara has been fairly accurate with the upside targets. Yes, the analysis has changed and new interpretations come up. But, for all intents and purposes, I don’t get why 10 or 20 points in either direction at these levels upsets the bears? We’re talking about a potential 500 point move down! Why do some traders go so binary at these levels? Like, if we go above 2116 its done. Bull market. 20% more to go. In fact, there’s likely a bear count even if we go to new highs.
And the position would be underwater by 2% form here. What!!!
It only makes sense to me if you are massively leveraged.
I think Lara’s analysis will play out here. The longs and the short VIX crowd will get trapped…soon.
I think it may be a second wave correction doing it’s job of convincing most market players that there has been no trend change, that the old trend (in this case the upwards trend from February) hasn’t changed.
Furthermore, if everyone is managing risk carefully then no one should have massive losses here if I am wrong.
Losses if any members are short should be no more than 3-5% of equity.
Yep! There is a massive amount of shorting of volatility. They have so far been on the right side of the trade. I expect another gigantic capitulation spike sometime in the next 90 days so I am holding a set-it-and-forget-it position with a contingency order to execute when that happens. As long as they don’t ambush us with a reverse split I am not at all worried about it. Even if that happens I will simply make a few adjustments and stay in the trade. These series of 52 week lows are unprecedented in all the time I have traded it. Something big’s afoot I surmise…
I could not agree with you more. I think we sometimes get excited in the heat of the short term market gyrations but I think Lara’s analysis of the overall condition of the market is rock solid. Long before the market actually turned, there were a number of markers identified which she indicated would determine when the market turned from bull to bear. The wave count is not based on sentiment. There is no doubt in my mind about the ultimate outcome. And yes, even if the current count is invalidated short term, a lot more would have to happen to change my current perspective. Great points!
I believe this is going to break one way or other very soon, large sell off in USD’s today, maybe the first sign of $$ leaving the U.S. markets
I agree. Second waves at any degree can be quite deep obviously but the question is how quickly they unfold. Clearly if this is indeed a second wave of a minor degree third down, it is behaving a bit more sluggishly than usual. I think second waves at any degree are not invalidated until they retrace more than 100% of the first wave.
I can agree with that statement. The slow, choppy, drawn out second wave provides little satisfaction when analysis suggests huge declines are coming.
Definitely a concern.
I’ve been saying often here that second waves can be and often are deep. I’ve pointed out that during the last primary wave 3 early on there were deep second wave corrections. I’ve pointed out there were a few small green daily candlesticks and doji early on too.
I think I’ll stop talking of a primary wave 3 and start talking of intermediate wave (1). Because that’s what the bear wave count sees. A first wave down from here.
Yep. Looking at the last bear market, it is really quite striking how much protracted sideways movement there was during its initial stages…
Exactly.
No more talk from me of third waves folks.
This is intermediate (1) for the bear count, intermediate (5) for the alternate bear count, and still intermediate (2) for the alternate bull count.
I guess a huge zig-zag wave two is still technically possible but I sure would not count on it….bye again!
best guess vern..4th wave ..
this was a F..U.. Friday .. for sure
Any thoughts on a possible wave count?
Whatever it is, it is clearly NOT a third down, which became evident fairly early I think…..
UVXY another 52 week low…
Looks like a reverse split is in our future….
This has got to be the strangest market behaviour I have ever seen. The market is so not amenable to any kind of rational assessment. Talk about broken price discovery. Time to take a break from the screens. I think I will follow Joe into an early departure. Sure glad I stayed on the sidelines. Something not quite right about all this.
As “Ace” used to say….Laters!
It’s called the federal reserve printing money and having their cronies bid this market up…at any costs. How else could this market be up? There’s no rational explanation.
I call it crony capitalism. They are penalizing everyone with this, but can’t/won’t allow the these markets to be truly free. 😉
If any one ever doubted that markets can indeed be manipulated, at least in the short term, today’s action I present as exhibit “A” 🙂
Correction – they are penalizing the savers as for the rest addicted to low interest for their wants and desire ( multiple houses on multiple mortgages) this is nirvana.
I agree, very odd market behaviour. Almost like the big boys are sell out of futures the force market opens down, then on with the share buy back programs during regular hrs.
No question incredible things going on behind the scenes. You would have to be totally blind to not see it imo….
Once again the impulses down complete intra-day, and up we go. This is not natural folks. Something’s eventually gonna break….
We got a gap today but no go. Let’s see if it can manage to close above 10. That would be good…
Out of here… next week is another week! This is stuck in the mud.
Have a great weekend all!
Deeeeelighted to see the assault on that open gap halted. What we need now is some big Mo. Kinda like what the Warriors had against the Cavs last night! 🙂
Loved the game last night James and Cavs got some serious beating. Love to see GSW win again as the team is so classy compared to loud Cavs…
I was watching my Mariners getting beat 12-2,,, they ended up winning 16-13,fun game to watch, normally baseball is a yawner
62% retrace from yesterday’s high as well as kissing underneath the channel it broke down from this am. If this thing doesn’t turn back down here… we need to consider a bullish possibility more seriously. Taking a bigger look at this picture, we have been sideways since 5/25, which if resolved from a classic TA perspective, favors a break to the upside…IMHO.
I hear ya. The longer the meandering goes on the more likely a break to the upside in my experience. Bearish moves generally unfold more swiftly and decisively than bullish ones as a general rule. Just compare the duration of bull and bear markets.
I will say this. If we get a drop from here I think it is going to be massive….
Agree!!
The correlation between stocks and crude oil has to be about 97% since Feb 11.
Crude is breaking its hourly channel downward, nearly hit Lara’s upside target over on the other site (subscribe), and has got to at some point react to the record inventory levels around the world.
The last two hours have been incredibly frustrating, but I still wholeheartedly believe by end of today, and at the very least by end of next week, 2100 will be a distant memory for the bulls.
This pop above 2098 completes the final 5th wave of my count of a zigzag more this corrective move up.
3rd degrees to the x level all loaded up.
Time to fall.
Need to take out 2085.10 today… if this to all unfold today.
Otherwise, sometime next week.
It may be starting right now???
61.8% retrace = 2097.66………… high in counter move now 2098.08
The equivalent low in ES was breached… 2083.25 this morning 10:20AM 10min candle.
Those are the Lows of the SPX & ES 9:30AM 10 min candles on June 1st.
I’m a trader, not an analyst, and so I don’t use a lot of technical indicators on my charts.
In fact I use NOTHING other than PRICE and how it performs around support and resistance.
I draw lines and fibs. That’s it. And if I’m feeling adventurous maybe some EMA’s, but that’s it.
No macd, no BB, no keltner or iki mojo or whatever it’s called. Dead simple.
I did have had a bash at some EW mapping in the past, like this chart I posted on this very site – way back on the 3rd of March 2016
At the time it wasn’t popular, was told it didn’t look right, had wrong proportions etc, and I was reminded that all technical indicators point down….however the market has went up over 100 points since then, and I’ve traded that long (and short) the entire way up to where we are today.
All this in spite of the detailed technical analysis presented here that – almost daily- has been calling for downside and this elusive third wave to begin, and without seriously considering a bullish alternative. To my eyes, price has been proving the third wave idea wrong for quite some time.
I’m almost past the post of caring now if my posts are controversial and it upsets the status quo because my motivation for doing so is an altruistic one – I don’t want to see anyone getting hurt financially or otherwise by overconfidence in anyone’s analysis or positioning for something that is unlikely to happen.
I will remain with my positon that until support gets taken out convincingly, the pressure is to the upside, and it would be prudent to be prepared for such.
And for the record, there is nothing I would like to see more than a waterfall back down to the 1700’s, I just don’t see it happening again for another few years.
I for one really appreciate another perspective Stuart so please don’t feel your posts are controversial just because they take a different perspective. Glad to hear your viewpoint.
Thanks Verne, appreciate that a lot 🙂
I use everything, including fundamentals.
To me… the STARS are all Align with Lara’s Bear Wave Count… I follow many.
By STARS… = everything!
By fundamentals… I mean By fundamentals by honest data… and even now with the bogus data that is reported shows it’s bad. The best valuation metric… Market Cap to Sales/Revenue multiple. That metric shows equites Grossly Overvalued by historical standards. This alone will be a very harsh adjustment in valuations.
Debt to Free cash flow for both Companies & Governments.
You are free to post anything you want… But I have to ask, what value does being here bring you?
Thanks for your warning… but I respectfully disagree.
You’re welcome 🙂
TBH There are some great traders here Joseph, and that alone is worth the price of admission in my book.
Fair enough!
Yeah, it’s great to have your point of view. I really appreciate your post and remember this chart. Why have a forum if everyone is saying the same thing? Please keep on posting!
Thanks David.
Zero sum game this, so it take two sides to make a market 🙂
Stuart,
Appreciate your perspective and I am in the same boat as you. We were expecting strong downturn mid May and I came across another analyst perspective (that was shared here) stating no downturn until June 03,2016. So far that call has been on the money and expectations are to have this downtrend all done by June 19,2016 so going to be swift and ugly… Let’s see if that second part of analysis comes true:)
Yep. I think the next move down is going to be swift. I expect the line in the sand to be the 1810 area, where a triple bottom holds, or all hell breaks loose! 🙂
If we get a swift downside move like described, but don’t break 1950, that would be all the confirmation i need to take a large positional long and ride that third wave to the upside.
Watch out for this if it happens. Absolutely key in my book fwiw
Stuart,
Same thinking and approach I have been working on. Additionally, I suspect FED would want markets to correct ahead of the meeting so they are not blamed.
Wow.
I missed that post Ris but would love to read it and compare notes.
What you have said would fit perfectly and it would be beyond awesome if it played out like that…
Thank you v much for sharing this 🙂
Support, resistance and trend lines… the most simple and effective technical analysis.
It’s still technical, not fundamental.
But to be fair I haven’t been almost daily calling for huge downside moves. Since 15th March I had a target for the end of primary 2 at 2,126 and did expect price to at least move above 2,116.48 for a long time.
I have also repeatedly pointed out that just because this is a third wave I am expecting does not mean it must show foot long red candles right now.
Your point of view is welcome. Your reasoning around support / resistance will be certainly considered.
Because it’s not just some random prediction, it’s based on sound technical reasons.
Curious, do you use volume as well as price? If so, what additional indicators? (VWAP, CMF, PVO, etc)
Can’t believe VIX just about went negative with S&P down 7 pts.
To me, that means no fear, and the big move is yet to come.
Also, bonds still trading at highs, yen, etc.
The selling will come, and it will be relentless.
The one thing that would change my mind is if we see a bullish VIX engulfing candlestick but it would happen in a way I have never seen. Typically those come after an initial strong move up in the market to make an outside reversal pattern, with VIX doing the same at its low before taking off to print a candle engulfing the previous day’s.
Zig-zag now looks perfect- about 50% retracement. Now a third down at multiple degrees should be unmistakable…
This additional move up gives the possible zig-zag a more proportional look. We need to turn down from here and I mean now. We close that gap from the open, to me that is deadly to the bearish case…
abc … 3 waves total counter move on 10 min… clear to me. As of right now with 2 min left in the candle.
It may not be as deadly as you think. c would be equal to a at 2098.28 and it would close the gap.
Not if impulse down started at the open. Counter move to that should end ~ right now. Over at 2096.08
Agree. If this is a third wave it should turn down here for another 20 to 30 pts.
Counter move S/B over at 2096.08… with next impulse down starting very soon… if counting correctly from the open or last nights close on the SPX 10 min chart.
Or may it may extend a bit more… In any event s/b over soon.
61.8 retrace
61.8% retrace = 2097.66………… high in counter move now 2097.96
I have never, ever, ever, ever, seen a gap filled during a third wave down during the same session. Not ever….
I know there is a first time for everything and considering the rampant bullishness in the market, I guess it could happen…
on the one min. chart, I count a clear 5-3-5 zig zag with the opening gap filled. Time to resume the drop, imho.
I don’t see the SPX gap filled. You must be looking at ES?
No GAPS on ES always trading.
Open on SPX 2104.07…. Close 6-2 2105.26
Not sure what gap he is looking at.
Rick, 2098.08 now the high of counter move… so you are right on, but I still don’t get the GAP filled part of your post.
I don’t know… I expected this market not go down with a bull fight. I believe not only subminuette 2 of minute 1 (where we seem to be now), but also minute 2 of minor 3, and also intermediate 2 (after intermediate 1 is over)… to keep bringing us up close to bear market trend line…
Typically even with deep retracements, they unfold sharply and the downtrend swiftly resumes. The corrections are violent, the impulses are relentless. This slow, meandering rise from an impulse down in recent sessions has been bad news. We have seen it often enough to recognize the pattern imo…
The onset of a third wave also does not usually see volatility retreat, even during the corrections; at least not significantly.
ABC zig-zag still in play but price action worrisome…
Could be a zig-zag developing on 15 min for a second wave…?
Definitely not another 1,2…..not a flat either…
To me… in wave 2 now of impulse down on 10 min…. not sure of the degree or pattern of this wave 2. abc??? But a clear 1 down from open on 10 min.
My Candle stick comments below still in play.
So far, so good…volatility heading South not so good; not for a third wave down anyway…
I certainly don’t want to be a wet blanket but once again I have to say I don’t like the absence of selling pressure. This is not the way third waves to the downside typically unfold. SPX still far too close to 2100 and that should have been decisively dealt with on that first wave down by way of extension. I guess we will see what develops….
Vern,
I am glad some of us are looking at overall picture and influences. It will be a mistake to blindly trust TA alone. If TA was the ONLY tool, we will all be rich.
What will a unchanged or positive close do to bear’s confidence? Lot of things in play with very little control (at present) in the hands of bears.
Yep. I learned the hard way that despite our personal leanings, even when based on sound TA and after having done due diligence, price action trumps all. You simply have to pay very close attention to what the market is actually doing, as opposed to what you are expecting it to do….
It looks like we might get a replay of yesterday as markets were down but ended up closing positive. It is puzzling that after being down over 130 points, bears can’t push the market further into RED while Bulls have so far been able to negate all the selling pressure. Market is teaching something and numbers in front of us are the hard facts as you mentioned.
Bears need to take out 2085.36 (hopefully not yet another expanded flat) with increasing momentum if this is the real deal…
The equivalent low in ES was breached… 2083.25
So to me… 2085.36 will also be breached soon.
Those are the Lows of the SPX & ES 9:30AM 10 min candles on June 1st.
TOS charts show the low to be exactly 2086.36…
Sorry —-> 2085.36
On the 10 min chart for SPX… if this candle stick pattern (10 min Candles from 10AM to 10:49.59AM) fails with a break below 2085.10…
Then LOOK OUT BELOW… TODAY!
BTW… same thing in ES… but the 2083.25 low (SPX equivalent 2085.10) was breached in the middle of the pattern… so now for pattern must break 2082.75 in ES to fail.
Looks like we have our first five down. Now hopefully a three up, and really get this party started. At that point I reload…
Watching the same thing – shout out when you make your move! 🙂
Imagine 1919 in 7 to 10 days. Would be par for the course compared to the last two wave 3 declines. Also note that Friday closing weak tends to align with Monday carnage.
Oh boy… I have that data freeze again. Anyone else?
10:31.39 … working and market jumped lower.
Nice looking hourly candle for the shorts! Seems to have scared away the dip buyers…for moment at least.
looks like for the most part money is flowing to consumers and utilities as I would guess as a safe haven
Skeptically short..need to take out yesterday’s lows to have some confidence.
Lara’s triangle idea very likely playing out imho – below 2088 seals the deal, but we already went into the alternates W1 low.
For a EW site I’m still amazed how much emphasis is placed on ‘news’ (I’ll bet the farm that Lara had no idea that NFP was being released today when she posted her count) 🙂 🙂
Hi Olga! We missed ya!
I find it very hard to trade and read emotional comments so took a bit of time out.
This thing will resolve itself eventually (hopefully today!) and is really frustrating, but comments based on little or no technical evidence wind me up especially when they undermine the huge amount of tech evidence Lara provides for us.
I realise it is all part of the game Mr Market plays on all of us, so not having a go at anyone – just find it hard to be around it during trading hours. 🙂
(PS – I have followed EW daily at 1min level for quite a few years, so appreciate I may have a little more faith in it than most, which helps cap my emotions I suppose)
That is why we need you around so leveler heads prevail! 🙂
AGREED!!!
2nd that!
Third!
Triple it 🙂
You are the best… as it happens counter… posting on this board.
There goes 2088 🙂
Low of 2085.36 – awesome!
Hi Olga, sorry, but you lost the farm 🙂
Richard over at Elliott Wave Gold posts what “news” is coming up for the next week, I glanced and noticed NFP coming up.
But you’re absolutely right in that I take zero notice of it. If it wasn’t for Richard’s comment I’d have no idea when it’s going to turn up.
NFP should be excellent for the bearish case… I’m looking for a break of 2090 in Jun ES as the first clue to some meaningful downside.
Testing that now…
Looking good…want to see 85 taken now
The Futures Market was one big FLATLINE overnight!
SO much so… that the Indexes and the Futures are almost the same in amount down! That rarely happens.
EDIT: END of DAYS??? It’s one of the signs.
big sell off in the financials to start the day, lets see if it lasts plus volume is higher
Spin machine in full flow and this might ramp the markets higher :), unreal
“June’s out for a Fed rate hike and July’s on life support, analysts say”
Yeah. Labor Sec Perez is letting us know the bad numbers are due to the Verizon strike. Right!
So far not at all impressed with the price action. We should be down in DJI a few hundred points, and nowhere near SPX 2100.The idiocy of the crowd remains. What did someone say about the market remaining irrational? Watching from a distance still..
“improved worker productivity” is to blame, ha.
Only down .06% – really absurd. We need another strong surge of selling or this will retrace back up by noon.
I laughed hysterically when I heard that spin from a talking head!
LIARS…. All of them. One BIG CON Job!
102 million Americans who are either unemployed or no longer looking for work.
Yet… Unemployment Rate = 4.70%
“Historic Milestone: Negative Yielding Debt Surpasses $10 Trillion For The First Time
according to Fitch negative-yielding government debt rose above $10 trillion for the first time.”
“A third of all global government debt now has a negative yield.”
Go ahead… BUY RISK! I DARE YOU!!!
You might as well just flush you money down the toilet! IT’s what will happen to your money!
You know what I think Joe? All those folk buying paper at negative yields are ultimately going to get exactly what that paper is worth…..NOTHING!
(Unless of course they find another bigger sucker to unload it on)
If that’s nothing… Equities are more than nothing!
Is that a GAP I see 😉
Really need a gap and go. Lately all opening gaps to the downside have been promptly closed.
Vern wanted a gap for a while his got it.
Watching very closely. Equally important, we need a decisive demolition of the round number at 2100. A ten point gap down is a good start but below 1975.00 is my comfort zone…
Agree 100% on your level Verne.
If we get sub 2080 i will press the bearish side hard 🙂
I also want to see a bit of medium term fear, which means a lot of UVXY short sellers covering the 12.20 area sell-off. If this is really the start of a third wave down we should see some evidence of that today imo….
As I always say, if you have to ask if it is a third wave, chances are it is not! 🙂
Nice!!! Now I can relax a little…that move into the close had me doubting.
Bankster ambush! They got me good, can you believe it? And I know how these guys roll! 🙂
Well the shorts aren’t out of the woods yet….. We need some follow through on the downside here. If so Verne, there will be plenty of places for you to get back short.
You are right. Curious to see if we get some selling pressure today. Still not quite sure why we don’t see it. The economic news this morning in really nothing new. Even the most hopelessly clueless must have some notion of what is really going on…
Need to get flush low enough to scare away the buy the dip crowd. If price can start hitting stop loss levels then the action can begin. Still too much buying going on…
depending on how today goes, I may close out of my shorts and stay nimble
Wow! Jobs report showing the smallest number since 2010 at 38K. We are in recession.
The expectation of no rate hike versus the reality of recessionary times should be interesting in terms of market reaction. This market should be down several hundred points considering its trailing PE ratio but it hardly moved. Amazing!
Bloomberg’s Tom Keene says the vigilantes are “away from the docks”. He is absolutely right!
If those are the numbers they are giving us you can depend on the real situation being much worse.
We’re getting a real recession too and not just a so called “earnings recession”…
Market PE has been heavily manipulated by buybacks, M&A and creative accounting to hide how bad it is.
It will be interesting to see if the flood of cash comes in after the open to try to save this sinking ship…
The flood of cash already came in this week ahead of the report…they knew what it contained….
87 points down in futures will give a reasonable gap down, but it should be hundreds of points for DJI, and at least 50 for SPX, plain and simple….
If UVXY clears 12.20 today that will be an extremely auspicious sign for the bearish case…contratulations to you bears who sat tight! 🙂
Agreed, that is why there was a high volume EOD buying rush yesterday. Pump up the market into the close – then the drop doesn’t look so bad.
Premarket SPY is already clawing back the drop. The acid test will be the open and whether this drop gets bought, as it has been consistently. If it gets bought up the bearish case goes out the window.
Anyone BUYING Risk in the Face of those CON JOB numbers today… needs to be committed into a Mental Institution!
That has been the problem all along has it not? 🙂
As David astutely observed, the BTFD crowd is alive and well…
Five down, so far three up in futures, I want to see a triple digit down print in DJI futures at the open to be impressed….
Agreed David with your earlier post about this feeling like the QE days. Everything just seems like a reason to go higher. Still leery about this morning getting bought up too. 8EMA daily has been the rock the past 2 days with perfect bounces off it. Today it’s sitting around 2089.68.
You Can’t believe… at all… any of the GDP number’s coming out of China either.
China’s growth is ZERO to negative 2 to 6%.
Vern,
Keep in mind these numbers are being tailored for audience. If you look at the raw data and numbers the picture is far worst. Now what does this mean for FED in terms of raising the interest rate in June. Does this report make the market self correct before the FED meeting to take the pressure off them to raise the rate if it was still extended over 2,100 (for S&P)?
Congrats to folks who bought shorts into the close yesterday as a lot of bears folded once 2103 got invalidated by the move to 2105!
4.7% unemployment headline number! Look out below!
As usual numbers are bogus! One BIG CON Job!
Next up the Fed… The other BIG CON artist!
One BIG CON Job!
Government needs to get out of the Data Collection Business………..
They are EXTREEMLY Incompetent!
OR
It’s ALL One BIG CON Job!
I vote for the latter! Nobody is that DUMB!
BLS stands for Bureau of Lies and Scams….lol
I agree with Joe on the trustworthiness of that number. That fact that it was so low meant that after all the legerdemain so typical of this bunch, the true number was hugely negative!
I am still shaking my head in amazement at the muted futures. We are living in a market environment completely disconnected from reality, and this makes trading it very dicey indeed….! This is completely nuts! 🙁
Next Week is the FED BIG LIE fest!
Low & Negative Interest Rates was/is the biggest RAPE of wealth from the Middle Class & Seniors worldwide in the history of the world!
Joseph,
These numbers are all being manipulated to keep the public from panicking. Folks paying attention to job situation for graduates will know this loud and clear as what is being reported is not how it being played out in the business.
The old methods need serious review and overhaul, I firmly believe that inflation is being under reported cause of the way they are lumping the goods. But this fits into the big plan and agenda hence will not change.
From the Alternate:
“This alternate wave count expects the box on the first weekly chart to remain essentially intact several more months”
Several more months of vacillation! What joy.
The NASDAQ/S&P 500 Ratio is also interesting. See Chris Kimble….
http://blog.kimblechartingsolutions.com/2016/06/nasdaq-facing-most-important-resistance-test-this-year/
Thanks Lara! How would you reconcile the Russell 2000 into this which today made a new YTD high?
The RUT small cap has already “invalidated” its bear wave count I believe?
Thanks!
Check out Dana Lyon’s take…
The potential levels of resistance near here include these big 3:
-The underside of the post-2009 Up trendline (broken on January 6), currently ~1161
-The 61.8% Fibonacci Retracement of the June 2015-February 2016 decline ~1162
-The 500-day (~100-week) simple moving average, currently ~1164
http://jlfmi.tumblr.com/post/145326912820/a-big-test-for-the-little-stocks
RUT has a different wave count. For RUT I would see it’s bear market rally beginning not at the last low on 20th January, but the next swing low on 11th February.
So the new high above 27th April high now makes the upwards movement look like a three on the daily chart. Which is what it should be.
No problems there.
The thing to take from that is it is a very different index and has a different wave count.
Help!
we will save you!!!, just don’t lose yer shorts..I like Laras leading diagonal alternate, an option for sure.
If that count is right, intermediate five down is going to be very deep. Volatility is acting a lot like a wave two top. If not for Lara’s wave count, I would have assumed it had to be of a higher degree than minor because of the unprecedented level of complacency with regard to market prices more than thirty days out. When medium term volatility collapses as it has the past few weeks, it usually means we are at the start of a run much higher, or at a major top. The last time it meant a run higher was in early 2013 when additional QE was announced. If the market closes above 2100 again today I will stay on the sidelines and wait to see if the primary two high holds. There will be plenty of time to get short once the resumption of the downtrend is confirmed. Futures not indicating strong movement to the downside, and so far sharp intra-day moves down have all been quickly retraced. Odds are we will have another inconclusive close to this week’s trading, with Mr. Market finally showing his hand next week. Have a great week-end everyody!
After SPX Closed at the High of the day yesterday and over 2100,
Futures are as FLAT as a pancake at 7:00AM and in fact FLATLINED since it Closed regular trading yesterday…
Futures Showing absolutely NO BULLISHNESS for such an SPX CLOSE! If SPX was going to Break UP to 2111 or UP closer to new highs or all time highs… Futures would be UP 100+ in the DOW and UP 10-15+ in the S&P right now or at the very least volatile… UP… Down.. UP… in big swings overnight.
Futures FLATLINED! That’s a message!
Good point Joe. That has been the pattern when banksters were planning to push price higher. The problem is flat futures does not necessarily mean we go lower. The pattern lately seems to be to let prices meander sideways for a while before a ramp higher and that may continue today.
I am really struck by the absence of any selling pressure at all in this market, especially ahead of a third wave down. Something just does not quite add up. Without strong selling pressure, who knows how long this could go on…..
Vern, A 2100 close & at the high for the day should have created a big reaction in overnight futures and NOTHING! Futures FLATLINED! Draw a straight line from the 4 close & trading basically right on that line with very low volume.
I will spell it out… to me that means a big sell off at some point this morning after the regular market opens. Maybe a small 2 – 3 point gain for an hour then strong high volume break down.
From your mouth to God’s ears my friend. I have felt for some time that a big move was in the cards but so far I have been proven wrong with this protracted wrangling around the round number pivot and essentially sideways movement. My own uncertainty stems from the fact that in the past when these round numbers are surrendered, you tend to see a bit more movement in the momentum direction, in this case upwards, by as much as 3%, even if it is reversed later. Maybe this time it will be different…..
Futures are always very active after a round number close + at the high… This time a DEAD FLATLINE!
Stated another way the Banksters accomplished what they wanted and/or the huge # of shares they were unloading the last several days have been sold… see my post yesterday on trading desk.
I hope Joseph is right! This market been difficult to trade and has only worked for using the drawdowns to buy the dips. Something is very wrong about how this market is trading, very one sided with little price discovery. Even the bearish moves seem like they are controlled by the bulls manipulating the markets.
Something is going on we don’t know about, but it is creating a consistent uniform upwards price movement. It feels like the days QE was pouring cash into the market. Maybe its the Fed padding the market ahead of a rate hike, or most likely a flood of Chinese money escaping their house of cards economy, and definitely desperate US companies using record levels of buy backs to compensate for falling earnings. What ever it is it has created a very poor market for traders on the short side at least – that could change however. Hopefully very soon.