
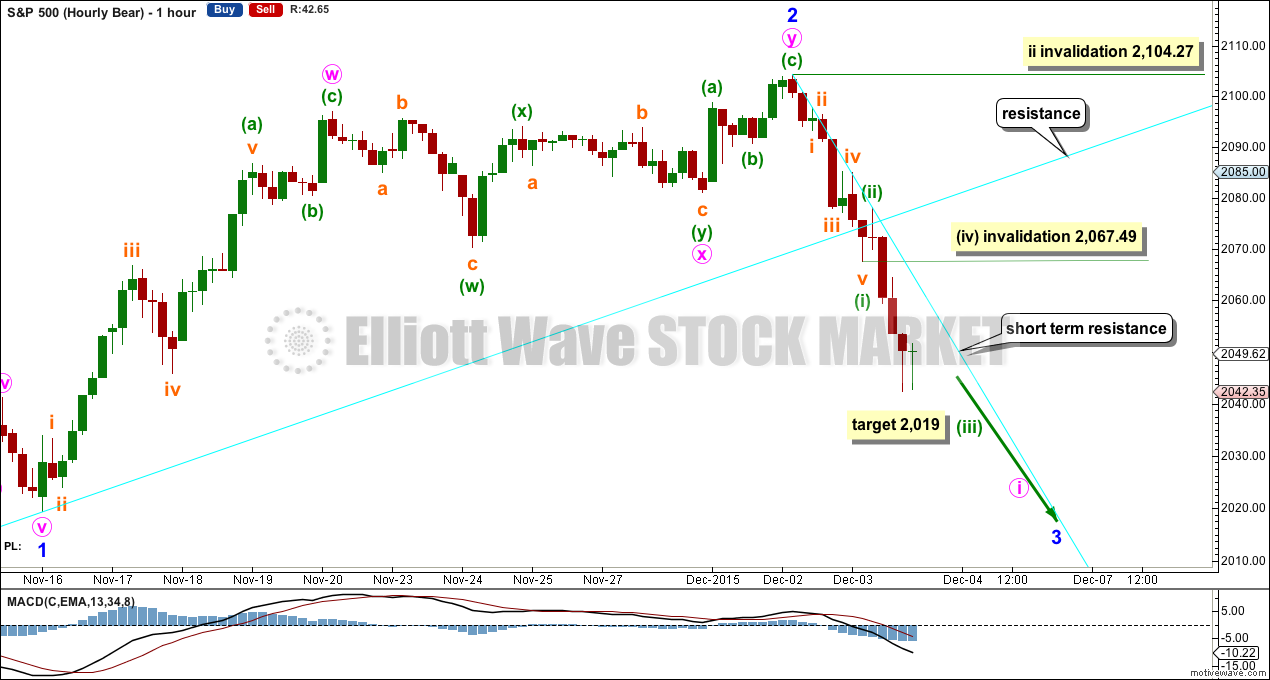
A new low below 2,066.69 invalidated the hourly Elliott wave counts.
At that stage, a third wave down was expected to be in the early stages.
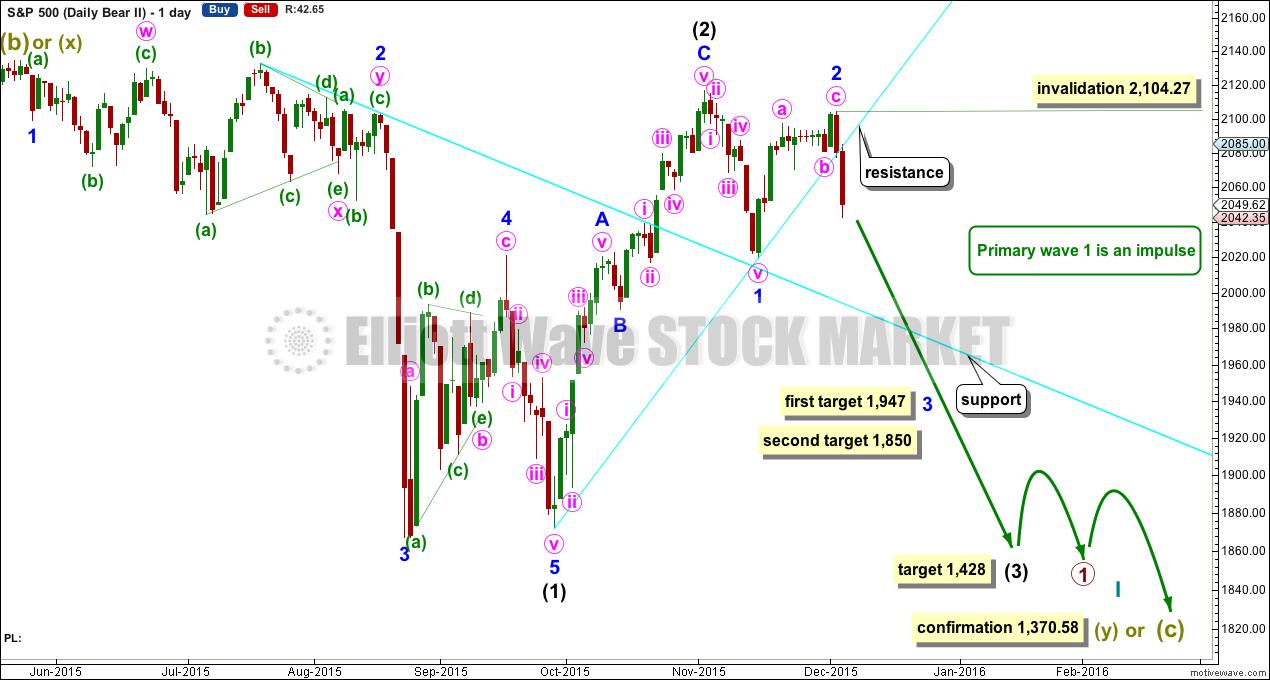
Summary: A third wave has most likely begun. I cannot see a five down complete yet on the hourly chart, so more downwards movement should be expected tomorrow. The first invalidation point for a small fourth wave correction is at 2,067.49. Along the way down, use the sloping trend line on the hourly chart for resistance. When that line is breached by upwards movement expect a bounce has arrived. A target for this third wave to end is at 1,947 in the first instance, and 1,850 if price falls through the first target.
To see how each of the bull and bear wave counts fit within a larger time frame see the Grand Supercycle Analysis.
To see last analysis of weekly and monthly charts click here.
If I was asked to pick a winner (which I am reluctant to do) I would say the bear wave count has a higher probability. It is better supported by regular technical analysis at the monthly chart level, it fits the Grand Supercycle analysis better, and it has overall the “right look”.
New updates to this analysis are in bold.
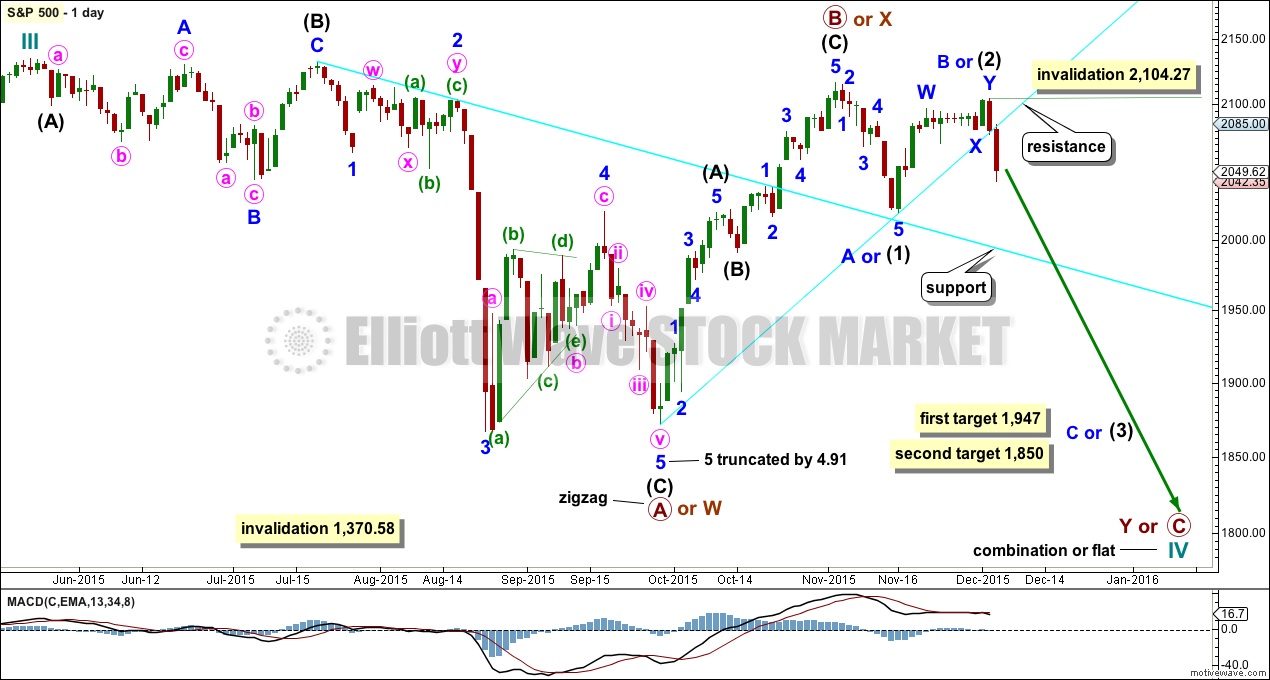
BULL ELLIOTT WAVE COUNT
DAILY CHART – COMBINATION OR FLAT
Click chart to enlarge.
Cycle wave IV should exhibit alternation to cycle wave II.
Cycle wave II was a shallow 0.41 zigzag lasting three months. Cycle wave IV should exhibit alternation in structure and maybe also alternation in depth. Cycle wave IV may end when price comes to touch the lower edge of the teal channel which is drawn about super cycle wave V using Elliott’s technique (see this channel on weekly and monthly charts).
Cycle wave IV may end within the price range of the fourth wave of one lesser degree. Because of the good Fibonacci ratio for primary wave 3 and the perfect subdivisions within it, I am confident that primary wave 4 has its range from 1,730 to 1,647.
If a zigzag is complete at the last major low as labelled, then cycle wave IV may be unfolding as a flat, combination or triangle.
The wave count is changed today to again see primary wave B or X as a zigzag completed earlier. Primary wave C should subdivide as a five and primary wave Y should begin with a zigzag downwards. This downwards movement is either intermediate waves (1)-(2)-(3) of an impulse for primary wave C or minor waves A-B-C of a zigzag for intermediate wave (A). Both these ideas need to see a five down complete towards the target, so at this stage there is no divergence in expectations regarding targets or direction.
Primary wave A or W lasted three months. Primary wave Y or C may be expected to also last about three months.
Within the new downwards wave of primary wave C or Y, a first and second wave, or A and B wave, is now complete. Intermediate wave (2) or minor wave B lasted a Fibonacci 13 days exactly. At 1,947 intermediate wave (3) or minor wave C would reach 1.618 the length of intermediate wave (1) or minor wave A. If price falls through this first target, or gets there and the structure is incomplete, then the next target would be at 1,850 where intermediate wave (3) or minor wave C would reach 2.618 the length of intermediate wave (1).
No second wave correction may move beyond the start above 2,104.27 within intermediate wave (3) or minor wave C.
DAILY CHART – TRIANGLE
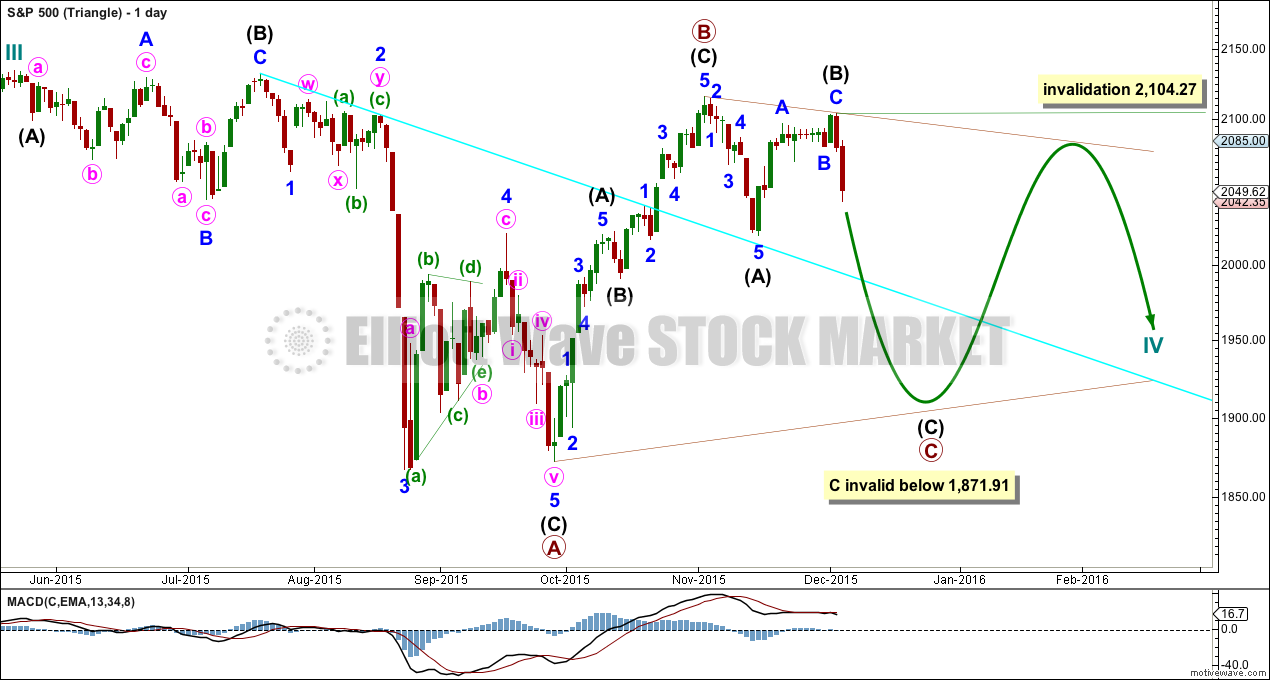
Click chart to enlarge.
Cycle wave IV may unfold as a shallow triangle. This would provide alternation with the 0.41 zigzag of cycle wave II.
Primary wave B may be a complete zigzag. Primary wave C downwards may be underway and within it intermediate waves (A) and (B) are complete. No second wave correction may move beyond its start above 2,104.27 within intermediate wave (C).
The whole structure moves sideways in an ever decreasing range. The purpose of triangles is to take up time and move price sideways. A possible time expectation for this idea may be a total Fibonacci eight or thirteen months, with thirteen more likely. So far cycle wave IV has lasted six months.
HOURLY CHART
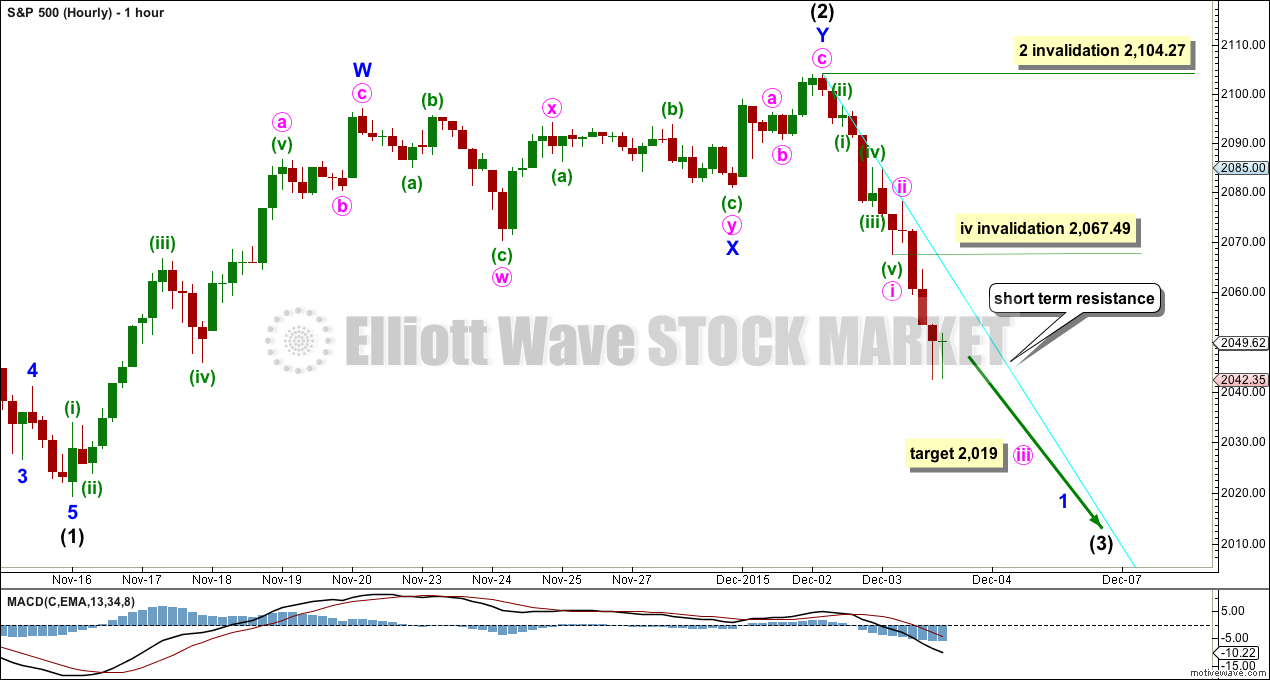
Click chart to enlarge.
I cannot yet see a complete five wave structure downwards at the hourly chart level. If the small green candlesticks labelled minuette waves (ii) and (iv) are both corrections at the same degree, then a first wave may be complete at the low labelled minute wave i. The following correction was very shallow and brief for a quick second wave.
Minor wave 1 downwards would likely be incomplete. When minute waves iii and iv within it are complete, then a target for minor wave 1 to end may be calculated. That cannot be done yet, but I may be able to do that tomorrow. In the absence of a target for minor wave 1 support trend lines should be used.
Ratios within minute wave i are: there is no Fibonacci ratio between minuette waves (i) and (iii), and minuette wave (v) is just 0.13 points short of 1.618 the length of minuette wave (i).
At 2,019 minute wave iii would reach 1.618 the length of minute wave i. I do not think this target will be particularly useful though because minute wave ii lasted barely one hour, so minute wave iv should also be over quickly. The next reasonable bounce should be minor wave 2 and not minute wave iv.
The downwards sloping cyan trend line should be more useful. Along the way down, price should find resistance at that trend line. Expect downwards movement to continue while price remains below this trend line. When price breaks above that line expect a bounce has arrived.
Minute wave iv may not move into minute wave i price territory above 2,067.49.
ALTERNATE BULL ELLIOTT WAVE COUNT
DAILY CHART
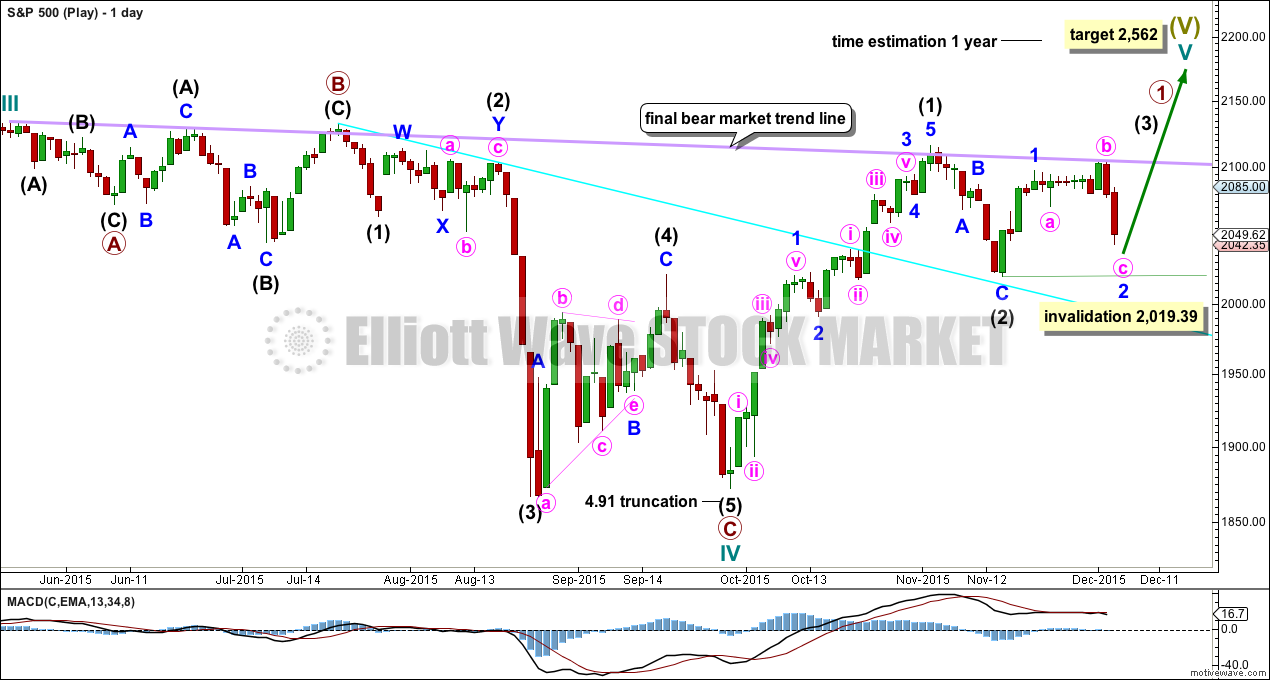
Click chart to enlarge.
It is possible to see cycle wave IV a completed flat correction. This would provide some structural alternation with the zigzag of cycle wave II.
This is a regular flat but does not have a normal regular flat look. Primary wave C is too long in relation to primary wave A. Primary wave C would be 3.84 short of 4.236 the length of primary wave A. While it is possible to also see cycle wave IV as a complete zigzag (the subdivisions for that idea would be labelled the same as the bear wave count below, daily chart) that would not provide structural alternation with the zigzag of cycle wave II, and so I am not considering it.
This idea requires not only a new high but that the new high must come with a clear five upwards, not a three.
At 2,562 cycle wave V would reach equality in length with cycle wave I. Cycle wave I was just over one year in duration so cycle wave V should be expected to also reach equality in duration. Cycle degree waves should be expected to last about one to several years, so this expectation is reasonable. It would be extremely unlikely for this idea that cycle wave V was close to completion, because it has not lasted nearly long enough for a cycle degree wave.
I added a bear market trend line drawn using the approach outlined by Magee in “Technical Analysis of Stock Trends”. When this lilac line is clearly breached by upwards movement that shall confirm a trend change from bear to bull. The breach must be by a close of 3% or more of market value. If it comes with a clear five up, then this wave count would be further confirmed.
While price remains below the bear market trend line, we should assume the trend remains the same: downwards.
Intermediate wave (1) is a complete five wave impulse and intermediate wave (2) is a complete three wave zigzag.
For this wave count, when the next five up is complete that would be intermediate wave (3). Within intermediate wave (3), no second wave correction may move beyond the start of its first wave below 2,019.39.
This wave count does not have support from regular technical analysis and it has a big problem of structure for Elliott wave analysis. I do not have confidence in this wave count. It is presented as a “what if?” to consider all possibilities.
BEAR ELLIOTT WAVE COUNT
DAILY CHART
Click chart to enlarge.
This bear wave count has a better fit at Grand Super Cycle degree and is better supported by regular technical analysis at the monthly chart level. But it is a huge call to make, so I present it second, after a more bullish wave count, and until all other options have been eliminated.
There are two ideas presented in this chart: a huge flat correction or a double flat / double combination. The huge flat is more likely. They more commonly have deep B waves than combinations have deep X waves (in my experience).
A huge flat correction would be labelled super cycle (a)-(b)-(c). It now expects a huge super cycle wave (c) to move substantially below the end of (a) at 666.79. C waves can behave like third waves. This idea expects a devastating bear market, and a huge crash to be much bigger than the last two bear markets on the monthly bear chart.
The second idea is a combination which would be labelled super cycle (w)-(x)-(y). The second structure for super cycle wave (y) would be a huge sideways repeat of super cycle wave (a) for a double flat, or a quicker zigzag for a double combination. It is also possible (least likely) that price could drift sideways in big movements for over 10 years for a huge triangle for super cycle wave (y).
Today I have a new wave count at the daily chart level for the bear. The downwards movement labelled intermediate wave (1) looks like a five and I have long tried to see if it will fit. If minor wave 2 is seen as a double zigzag with a triangle for wave X within it, then the subdivisions all fit nicely.
Ratios within intermediate wave (1) are: minor wave 3 is 7.13 points short of 6.854 the length of minor wave 1, and minor wave 5 is just 2.81 points longer than 0.618 the length of minor wave 3. These excellent Fibonacci ratios add some support to this wave count.
Intermediate wave (2) was a very deep 0.93 zigzag (it will also subdivide as a double zigzag). Because intermediate wave (2) was so deep the best Fibonacci ratio to apply for the target of intermediate wave (3) is 2.618 which gives a target at 1,428.
Within intermediate wave (3), minor waves 1 and 2 are complete. The upwards movement for minor wave 2 does have a strong three wave look to it at the daily chart level. Minor wave 2 was another deep correction at 0.87 of minor wave 1. Targets for minor wave 3 are 1.618 and 2.618 the length of minor wave 1.
It is still possible (but still less likely) that primary wave 1 is unfolding as a leading diagonal. I will keep that chart up to date and will publish it if and when it begins to diverge from the idea presented here. For now I want to keep the number of charts published more manageable.
HOURLY CHART
Click chart to enlarge.
All the subdivisions at the hourly chart level for bull and bear are again the same. Targets and invalidation points are the same. The most important piece of analysis on this chart is the short term resistance line. When that is breached expect a bounce. While price remains below it expect price to keep falling.
TECHNICAL ANALYSIS
Click chart to enlarge. Chart courtesy of StockCharts.com.
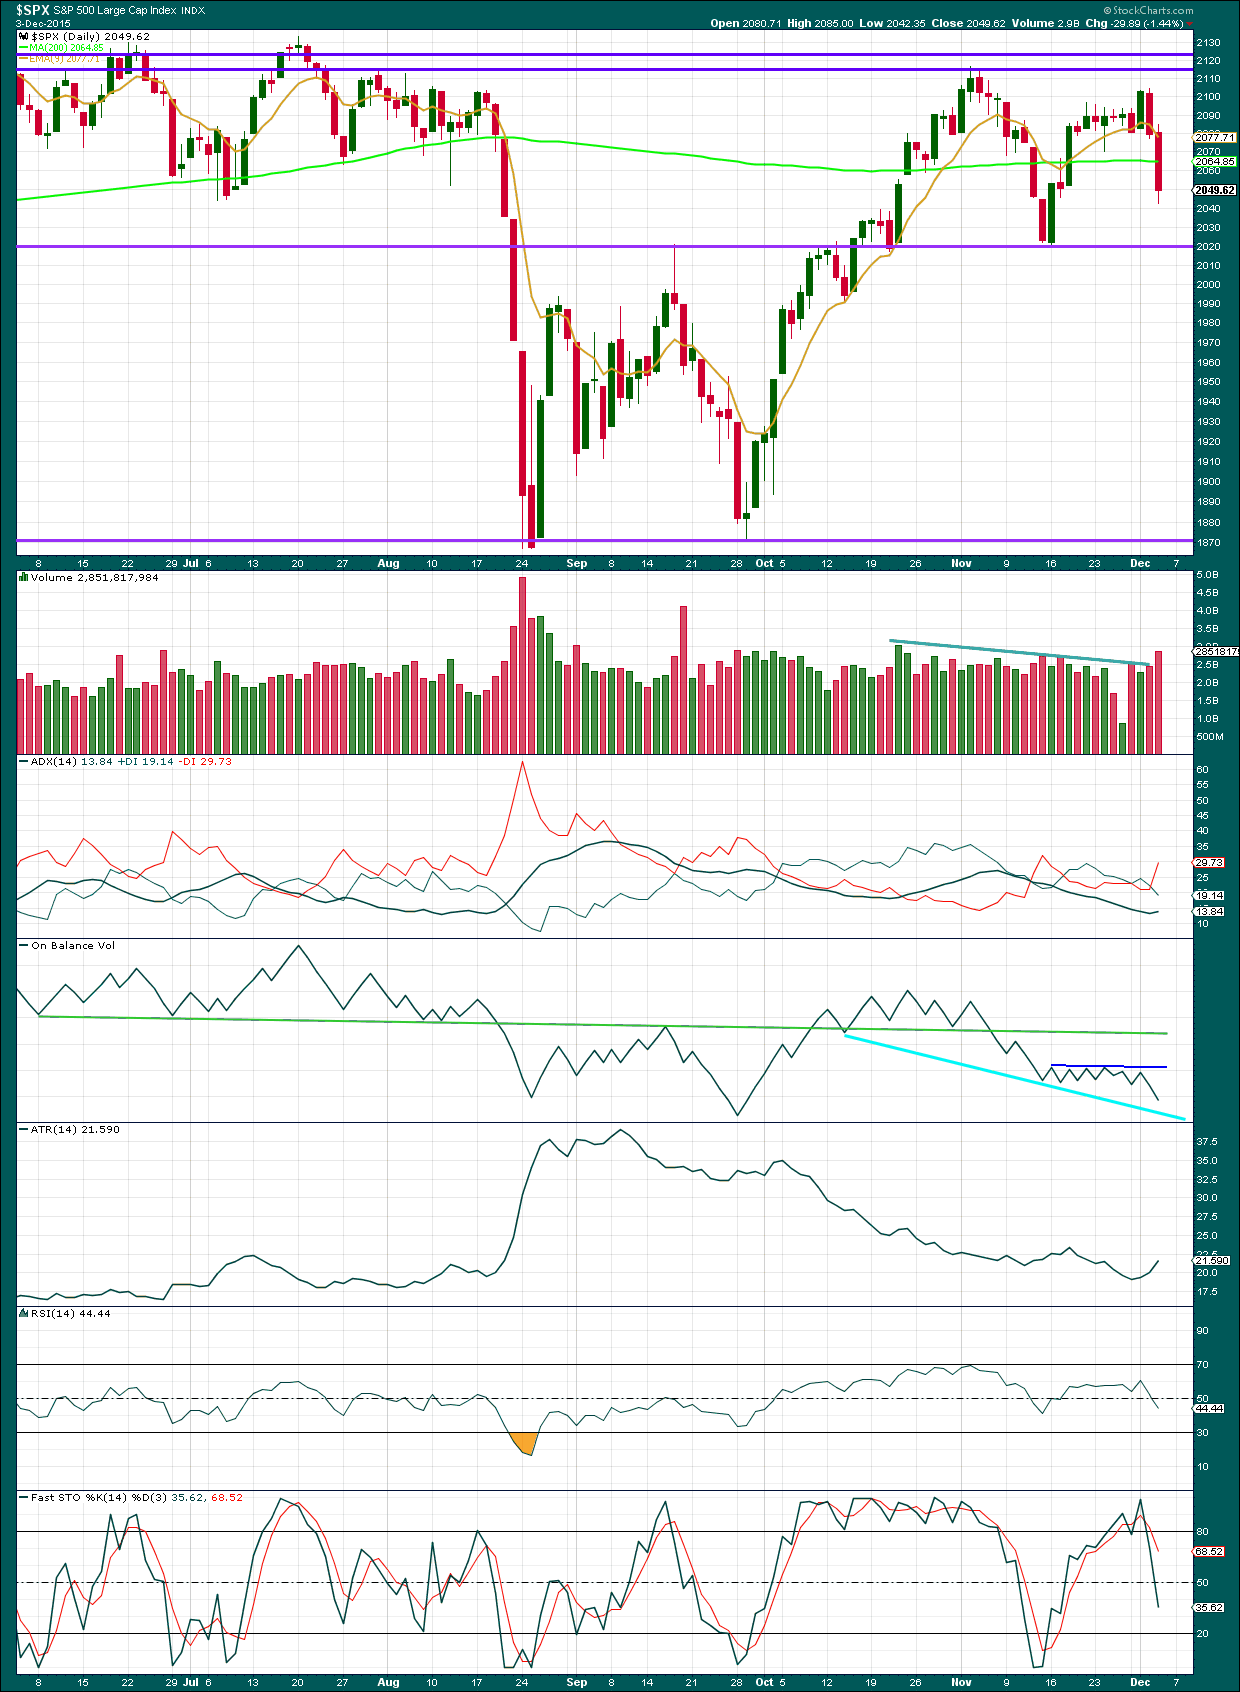
Daily: An increase in volume for a strong downwards day supports the fall in price. On Balance Volume remained below the green and dark blue trend lines. The dark blue line particularly has offered strong resistance and is repeatedly tested. When / if price bounces for a smaller bear market rally, look for OBV to lead the way again. If it again comes up to touch that trend line, then that may be when and where price ends a bounce.
I am adding a new trend line to OBV today. It is not too steep, but it has only been tested once and is not long held. It is not very technically significant. This cyan trend line may offer some support. If OBV breaks below it, that would be further bearish confirmation.
The bearish engulfing candlestick pattern was a good warning that the bear market rally was over. The pattern is confirmed now with a strong downwards day to follow it.
Today ADX is turning up, but it is below 15. A downwards trend would be indicated when ADX reaches above 15 and is increasing.
ATR is beginning to increase indicating a potential new trend.
Neither RSI nor Stochastics are oversold. There is plenty of room for this market to fall.
Price sliced through the 200 day SMA. The next line of support would be the purple horizontal trend line at 2,020.
Along the way down, upwards corrections may find some resistance at the 9 day EMA.
A note on Dow Theory: for the bear wave count I would wait for Dow Theory to confirm a huge market crash. So far the industrials and the transportation indices have made new major swing lows, but the S&P500 and Nasdaq have not.
S&P500: 1,820.66
Nasdaq: 4,116.60
DJT: 7,700.49 – this price point was breached.
DJIA: 15,855.12 – this price point was breached.
To the upside, for Dow Theory, I am watching each index carefully. If any make new all time highs, that will be noted. If they all make new all time highs, then a continuation of a bull market would be confirmed. So far none have made new all time highs.
This analysis is published about 06:35 p.m. EST.
Hi Jack:
I can send you an e-mail with a brief summary but in a nutshell, a really smart trader a few years ago taught me that we should not CARE what the market does if we are trading correctly and should be generally taking profits no matter what the market does. I know it sounds a bit contradictory but there are many strategies one can use like option strangles and straddles. I prefer credit spreads.
They limit damage to your account when your are wrong, and they allow you to pivot quickly and still be in the trade even if the market moves against you. Clearly the first and foremost consideration is getting the trend right and getting positioned accordingly ahead of the trend’s strongest moves.
Right now I believe the trend is down.
Secondly, you have to hedge. Always!
Even if you are right about the trend, your timing could be off and you have to be prepared to survive sudden strong counter-trend moves and live to fight another day. Anyone trading this market is keenly aware that viscous whipsaws are par for the course and yesterday was a classic example when a second wave, though anticipated, arrived sooner than some of us thought.
Though I am mostly short, I had a number of hedges in place against exactly what happened yesterday. You can imagine the dismay of most traders holding only short positions when the market rocketed higher the way it did yesterday. I remember that feeling well and I don’t like it one bit.
In my case, I had some UVXY bearish call spreads (and a few other hedges) that went hugely into the money on the market pop yesterday, even though I was mostly bearish. So although my long term outlook is bearish, I cashed out and reloaded several positions on yesterday’s move. That’s it in a nutshell.
I do have another number, based on Lara’s analysis that will tell me that my mid-term bearish posture is incorrect and at that time will adjust. The specific trading plan is not as important as actually having one that works, and being disciplined in following it. Hope that helps a bit Jack.
Thank you,
hi
All,
Before I officially turn off the computer. You can expect the unexpected in this FINAL stage of the BULL MARKET…
Laters,
Quite a few Elliotticians are counting yesterday’s down move as the C wave of a flat to end minute two and today’s move as the start of minute three of minor five to the upside. This would imply one more correction for minute four and a final wave up for minute five and possibly new highs. Wonderful opportunities for those of us with a short side bias. IF a third down starts on Monday and today’s pop was minute two of minor three down…all the better, I’m still uber bearish.
I dont know but I can’t be bearish after such a strong thrust today. The correction won’t be that easy mattey!
Further, the real point is. Nobody really knows the FUTURE. There are always TWO sides to a trade outlook. It is how you manage the risk…
These wave counts can keep changing and keep us all in AWW SUSPENSE. So, Im taking the MARKET Day by Day!
I dont get attached to any one view on markets…
Staying FLEXIBLE and OPEN to direction is what TRADING is all about mattey!
And that’s the hardest part of analysing impulses. Which of the small corrections do you see at each wave degree within them?
Upwards movement invalidated the fourth wave correction, and so the prior wave down was complete and my analysis of it was wrong.
That trend line worked well. That’s why I use them, they’re the best indicators of trend changes.
So this upwards wave now fits nicely as a three, looks like a three, and is very deep, about 0.76 of the first wave. It’s highly likely to be over today. A third wave down would reach 1.618 the length of the first at 1,989.
Hourly bear chart attached.
I need to look for alternates. Something bullish short term. What if my analysis of intermediate (2) as over is wrong? What if upwards movement continues above 2,104?
Will work on that today. Would probably see intermediate (2) continuing as a double zigzag or combination.
For now use the channel on this hourly chart. If it’s breached by downwards movement then expect the middle of a big strong third wave may have started. That’s the highest probability wave count I can see at this time, so do take this possibility very seriously.
May you all have a lovely weekend.
Yep Yep Yep! Picking up a few more VERY cheap puts. Reloading my very attractive UVXY calls. Thought it would end at the previous wave four around 2080 but close enough. Have an awesome week-end everyone!!
Verne,
We will all find out by NEXT week. My instincts GRIND IT UP UP and away – park it near 2134.72 by DEC 15/16 or higher just maybe.
This is so exciting matey:)
thanks!
Sun of a gun…….
This could be the third wave of the fifth wave up in the bull case. If it is, we’re gonna hit new highs before any major bear moves…
Nice chart John!
Price has broken slightly above your trend line there and is now finding some support as this session comes to a close.
I’ll add that line onto today’s hourly charts. It’s a good one.
I just noticed how awesome this chart is. Classic double back to retest the underside of a previous support line decisively broken. Note how it provided powerful resistance before what has to be considered a false break-out above it followed by waterfall move down through it. Thanks John!
Corey & Verne,
Guys are kidding me? Before I close my screen. Just look at NASDAQ. NO WAY this is going down.. ALL FANG holding this entire market up..
Options,
Of course you might be right, however, you can’t get too wound up over the daily whipsaw. Remember my comment from yesterday:
“Corrective 2’s can be fast and furious up, and it looks like we are closing with an hourly hammer on the S&P 500. For those not short, you may get your chance tomorrow. Jobs report shenanigans?”
Look at the leading indicators – bonds are up, gold is up, and oil is down under $40. The last time moves like this happened it was absolutely terrible for stocks. Remember August? Down over 10% in 5 days.
What goes up fast, comes down faster in a bear market.
If oil was up, bonds were falling, and gold was down, then I’d be much more inclined to go neutral near-term.
i shared the same view. This is not going down in the next week or so. FOMC MAYBE 15/16 MAYBE!
Guys I am just saying seriously dont get caught up.
I learned the hard way – I’m not bearish or bullish. I just take what the market gives me with conviction…
Corey
I am in several leading trading groups. My view is with some of the industry’s best and brightest east coast traders. I am here to learn some more stuff. I am just saying – be careful man!
I am once again eyeing the transports; so far no indication that they will be challenging their 200 DMA any time soon and the ongoing divergence with the other indices remains a cautionary tale. Today a great example of why it is so important to stay hedged – as someone said the market can remain irrational longer that most of us can remain solvent… 😀
Transportations are barely up.
Industrials up.
Europe down.
FTSE down.
It’s quite a mixed bag really.
Volume for today’s session for S&P will be really important.
if this indeed is the end – it is going to be more complex to analyze. Just awesome swings i might add both directions…
I just LOVE these manic rallies in bear market conditions. They make all your out of the money upside hedges explode and lets you load up on more short side bets. More than one way to skin a cat matey!
If this is a thrid of a third coming up, then this rally is a gift to either get out, or get short.
We are already off 10 handles from the top. Not that today needs to be red…but if that did happen, it would surely set-up a very negative week next week.
I’m wondering if we have a embedded 1-2, 1-2 set-up here?
GLTA
I could be wrong, but boy does this smell like the mother of all bull traps; will hedge with half a point bullish put spreads at the close if prices still elevated just in case pop continues next week. If it gaps down big next week damage will be limited…and some folks think these markets are not manipulated…are you kidding??!!
Trade on the miners starting to look good…took some off the table today and reloaded with later expiration dates as I think we are going higher…
VIX down -17.5% in 1 DAY. This is not going down mattey!
MACD READY TO CROSS OVER TO THE DOWNSIDE ANYDAY!!
I called the rejection on the bollinger band yesterday!
If you have traded the VIX, you must be aware that there are two kinds of collapses- a) At the start of a new protracted bull run, and b)At the end of a deep second wave correction right before a major third wave down.
A little secret for distinguishing the two? Despite the manic run up today, we did not see new lows in either VIX or UVXY. In the larger context of the market, today’s decline is of no real significance. The bearish call spreads I bought as a hedge a week ago are back to the exact same price I paid for them despite the huge pop today. Talk to me about VIX and UVXY prices in a week and take another look at what the B bands have done.
O.K., now I am really off to enjoy my weekend. TADA!!!
Actually, I dont trade the VIX at all but only all other instruments. But -why would the VIX go to new lows? We didn’t move to NEW highs. The magnitude of the move was just as equal putting us back to midday WED.
What I will agree to is this is somewhere near the END as I said weeks ago and I made my point clear that this won’t give CLARITY until the FOMC 15/16
Can you imagine the drama with a HUGE DECLINE before the biggest decision on interest rates in a decade. Come on – is all I am saying. They won’t let it drop that much!
Cheers!
Lows in the VIX do not always coincide with market highs. When new highs are ahead though, it will almost always take a waterfall decline and CONTINUE lower. Today looks like a sharp correction ahead of a massive bull run higher. I am loaded to the gills with volatility calls matey!
I explained that I WANT to end this nonsense, maniac bull market but the market WAITS for no man. It will go where it needs to go before it is done. My chart assessments pants a picture that NDX could potentially FULFILL the highs back in 2000 – and that is what this is all about. FANG!!
I never said it was with highs, i said the previous level of midday Wed. Highs is a term I defined as the range 2134-2060 CHOP FEST.
There is nothing worse than holding falling value soon to be busted calls unless of course you are buying months out – that is your business.
I appreciate the BIG SHORT enthusiasm but I think you are to early to the party!
Watch this clip 🙂
https://www.youtube.com/watch?v=j4SRsGn14PI
Have a great weekend mattey!
There is a way to compensate for being early matey and that is by using spreads to hedge. I hate having options expire worthless and rarely buy just puts or calls. I am actually having a bit of fun with this last bankster ambush. It is going to let me buy back the sell side of my bearish UVXY call spreads for a nice profit while remaining positioned for the downside and do it at their expense!
I really like spreads as they quickly let you know when you are wrong and you can make timely adjustments without blowing up your account. It took me years to develop this system and this kind of market is perfect for it. Happy Trading!
Vernecarty,
Is there is anyway you could share your option spread technique with me…appreciate it.
Verne
Yes, Just for educational purpose only. What is the strategy:
For example: When we got to 2104 SPX last week.
IF you wanted to short, you could have just got the FEB 16 1800 PUT and ride it down to 2049 and dump it at the CLOSE before the MIRACLE BUYERS SHOWED UP!
What is your strategy? What is the spread you are talking about?
Education only!
Let’s take it easy folks…
We are all here to learn, not sure what is to take easy?
I am all about education!
I even have a degree in Finance with a specialization in market theory!
Covered all the topics in real time finance…
I don’t do this very often but I am calling the banksters’ bluff with a day-trade on today’s expiration diamonds 177 puts. It’s a small speculative trade admittedly but I think they are full of it….very few traders are willing to short bear market rallies but every now and then you can really stick it to the banksters…. 😀
Right now the very best advice for this market whatever trading plan you are using is: TAKE PROFITS IMMEDIATELY!
We had about an 800 point move in the DJI in three days! Fat profits on Thursday turned into huge losses on Friday. Folk who remained long into the week-end without taking at least some profits may suffer the same fate on Monday.
Once the bear really gets going the declines are going to be more protracted and far less amenable to bankster meddling. Mark my words. The market will fall farther, faster, and for longer than most people can imagine if we are indeed in a super cycle trend change.
The problem right now is that for accounts under 28,000.00 your broker will not allow you to be a pattern day trader and you are limited to three or less round trip trades (buying and selling the same day) per week, to say nothing of loosing your margin privileges.
Clearly this puts traders with small accounts at a huge disadvantage and you are better off taking mid and long term positions rather than trading the day to day machinations of the market.
Just my two cents guys.
I agree and I also think it is worth mentioning that probably nothing to the DOWN SIDE GREATER THAN 1-2% happens until the countdown to FOMC. Save this note…
Thanks,
The point is it should not matter. You should be positioned to take advantage whether it goes up 2%, down 2%, or simply trades sideways, which is what the market does for a majority of the time. The DJI is up about 1% for the year, the SPX a bit more. Most traders get crushed in this kind of environment.
We can always expect the unexpected, for that is what Mr Market does. 🙂
So for education only what is your
option spread technique ?
For education purposes only, since I am NOT a licensed broker and not qualified to give out investment advice. I like to buy bearish credit spreads on ETFs that track volatility. This is because on average volatility is declining 90% of the time so odds are greatly in your favour to buy back the sell side for a profit or at least enter the position cost free. I like to go out two standard deviations and three months (unless market action is providing an immediate opportunity). When done right you are left holding lots of calls on volatility acquired at a profit or zero cost that absolutely explode (typically ten baggers) when the market inevitably takes a dive. It sounds simple and it is simple but NOT FOR THE INEXPERIENCED TRADER.
Currently holding fifth week December 26/26.50 call spreads that will continue to go deep in the money if and as the market powers higher. As soon as the resumption of the down trend is confirmed, I buy back the 26 and let the 26.5 detonate. It took me a long time to fine tune this trade and there area other nuances I can detail here so it would seem to me to be smart to experiment with a contract or two ONLY. This is only ONE of several trading approaches that should be in every trader’s arsenal. The coming bear market is going to make it a very potent weapon for a few…
Brokers don’t know that much about REAL TIME MARKETS anyways imo. Of course anyone can explain the past just read the charts. The problem is most people can’t read the charts properly LOL. Those guys are clowns and everyone is right in a bull market – you could throw a dart blindly for the past 6 years at a board and make money in this market. They just watch a couple wall street movies and act the lines.
It is possible we had the end minute one down and the furious run-up today is minute two. These kinds of moves almost always occur during bear market rallies. Banksters notwithstanding, I am not entirely convinced. They need to take out 2104.27 to dislodge me. I got spooked by the run-up yesterday and today they have redoubled their efforts. I suspect a lot of shorts have already bailed. 🙂
hi
all
I’m closing all my trading screens. Have a good weekend!
laters,
Looks like another down move has been stopped by intervention. Might be a 4th wave triangle unfolding now with new highs following by year end. Would take a move below 2020 to turn bearish.
jb
I dont know about new highs as I share the same view as Lara on the 2134.72 limitation as that sounds very rational to me(especially given this aging bull market). Tricky markets for sure. We are going to close today 2080+. I can’t believe this is happening as I have been through SO many market moves. I was right, changed my view got short was wrong and now neutral – what a day! uhhh I need some coffee matey!
Absolultely! Determined banksters at work. Situation now unclear. Note the low volume.
Question is whether the crowd can be convinced.
Cashing in my upside hedges. Will decide whether to reload at the close. In this environment one has to be prepared for bankster ambushes.
verne
2080 by the cash close today is what i see now…. magnet there….
Yeah; that’s also around the last smaller degree fourth wave down….
verne
its holding up pretty good no? I was looking for 2064-2070 and we got it 🙂
I did short but feeling a bit jittery?
also, did we pass the invalidation point of 2067? Does intraday count for this type – I forgot?
uh oh I’m out. This is not looking good verne 🙁
a move under 2040 in Dec. futures will complete a clean 5 wave decline from 2105.
Spike higher in futures after the smoke and mirrors jobs report this morning, including an upward revision for last month. It is remarkable how ISM (institute for supply management) which provides and excellent gauge on the health of the overall economy could have shrunk by as much as it did the last report and we get these robust reports.
Anybody buying what they are selling?
At any rate, it is looking like you reluctant bears may get another opportunity! 😀
Well put. We hit my target pop 🙂
verne
you looking for a gap down at the open?
Futures are mildly higher so we could open in positive territory. The caveat is that they were up hugely two nights ago (probably bankster activity as Europe was already tanking) and we saw what happened at the open. I would consider any green print on the tape an opportunity…
Verne
50% retrace by the open tomorrow before a downward continuation?
Despite the fact I knew we would get a bounce of some sort I didn’t get short today – Just crazy and now just can’t wait to get in after a -55 handle drop.
I like Lara’s bearish Elliott Wave count best. If it is correct, then we are in the middle of minor three down and within minor three, we have not even completed minute one down so far. The point is the strongest portion of the move down is still ahead of us. I guess you could try and follow the wave subdivisions on the five minute chart and wait for a minute two bounce to get in IF it comes tomorrow. While we are in three down I think bounces are going to be brief so you will have to be nimble. Alternatively, you can simply get short, any which way you can. It is still early in the decline.
Thanks Verne!
I have a neat little technique to use to time my entry points .
See this post, it’s in “trading tips”.
thanks a bunch!
Thank you Lara. I am still learning so much.
I am not bullish anymore : /
You’re welcome.
And remember, this analysis always comes with the caveat that I could be wrong.
I am sometimes.
It’s simply not possible to be right all the time.
Risk management. It’s the key to profit and loss 🙂