Set up the following indicators on a 15 minute chart:
– Bollinger bands; 1 sd and 2 sd.
– Elliott wave oscillator, or MACD (to use the histogram only).
The sequence of steps is:
1. Get the expected direction from your Elliott wave count. On the hourly chart draw a channel about the most recent movement which should be nearing an end.
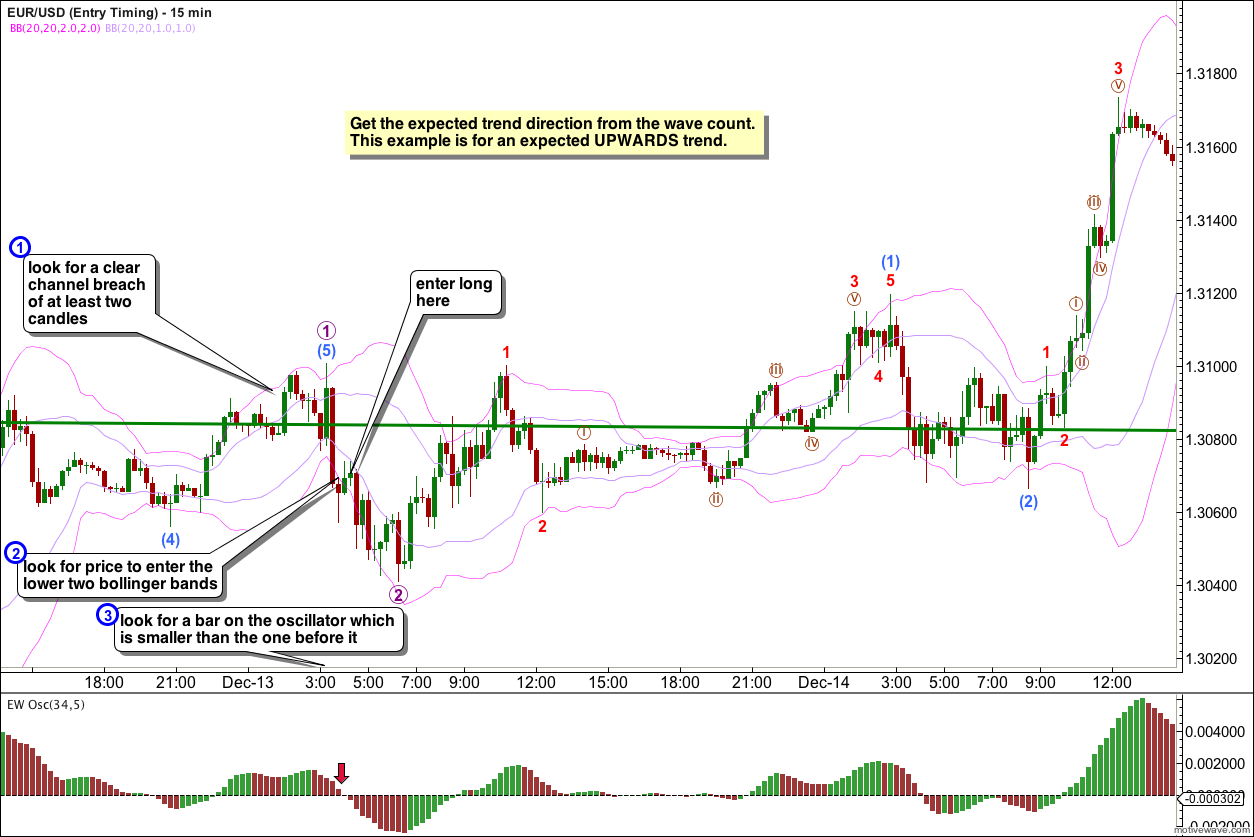
2. Wait for a channel breach. Depending upon risk appetite, either on the hourly chart (less risky) or the 15 minute chart (more risky).
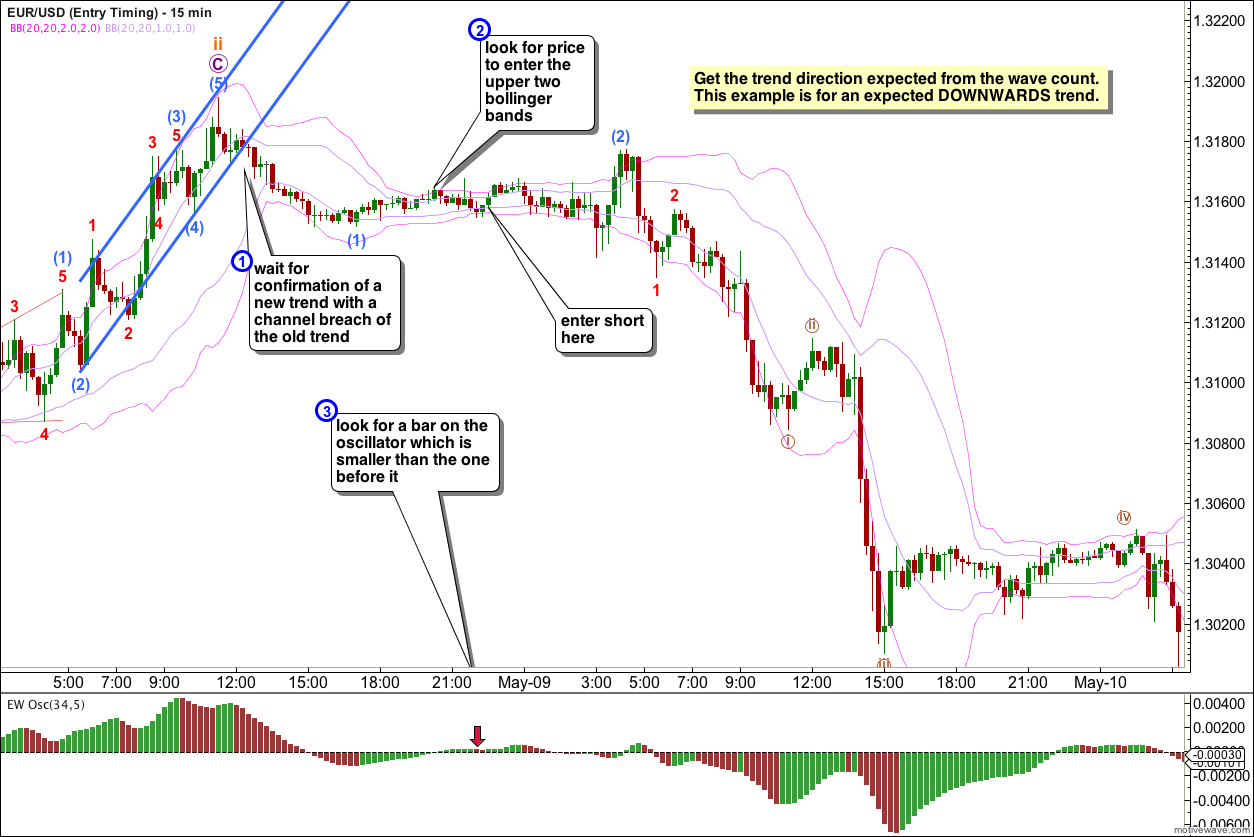
3. Wait for price to enter the two Bollinger bands on the OPPOSITE side to the expected trend direction. If you expect price to go up wait for price to enter the lower two bands. If you expect price to go down wait for it to enter the upper two bands.
4. Finally, wait for a bar on the histogram which is smaller than the one before it.
5. Enter your trade.
6. Take profit either using a target calculated from your Elliot wave count, or after a channel breach of the new movement.
Example for an upwards trend:
Example for a downwards trend: