
Last Nasdaq analysis expected upwards movement to either 5,142 or 5,156. Price moved higher to reach 5,163 and has since turned down.
To see monthly and weekly charts for bull and bear click here.
New updates to this analysis are in bold.
BULL WAVE COUNT
DAILY CHART
Click chart to enlarge.
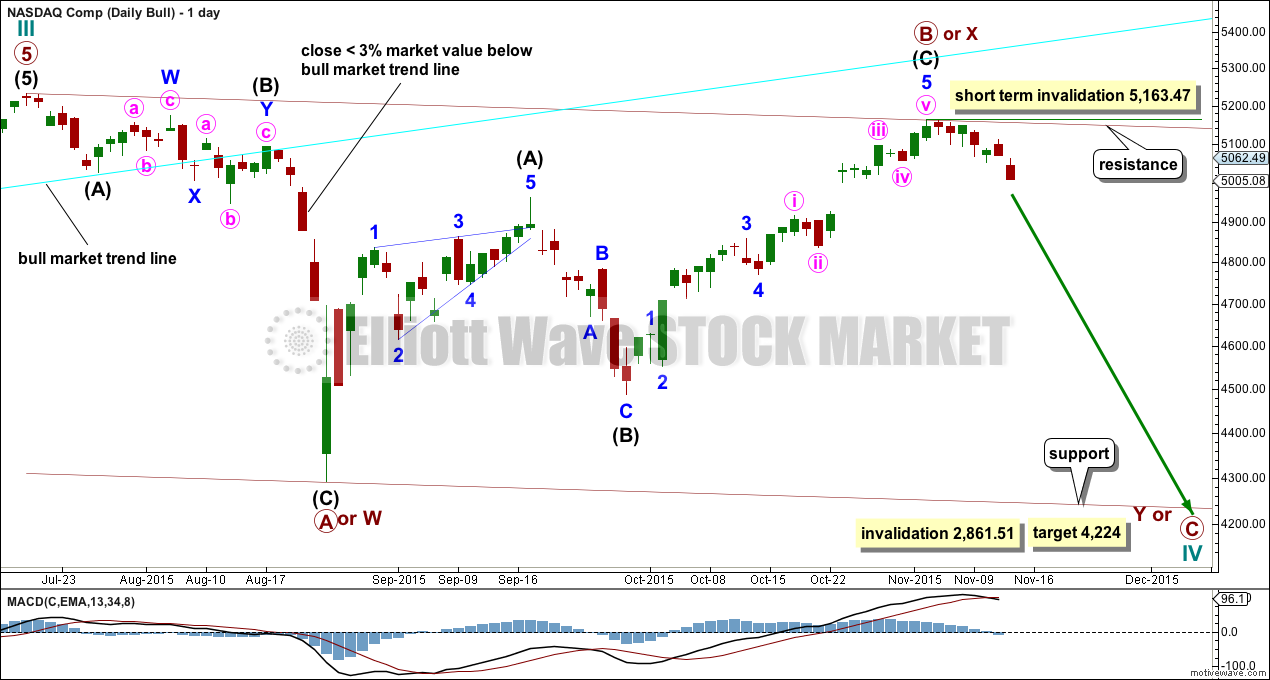
Grand Super Cycle wave II is seen here as over in just 31 months. This is possible, but it is more likely it would last longer than this.
This wave count sees Nasdaq in a Grand Super Cycle wave III upwards.
The bull market trend line was breached by a close more than 3% of value below it on 20th August.
There is a 5-3-5 complete thus far to the downside. This may be a three wave structure for a primary degree A or W wave for this more bullish wave count (more bullish than the very bearish wave count below). Cycle wave IV is most likely to be a flat, combination or triangle to exhibit alternation with the zigzag of cycle wave II.
If cycle wave IV is a flat correction, then primary wave A may be a complete three. Primary wave B is 0.93 the length of primary wave A, more than the minimum requirement for a flat at 0.9. This may be a regular flat. Primary wave C would reach equality in length with primary wave A at 4,224.
If cycle wave IV is a combination, then the first structure is a completed zigzag which would be labelled primary wave W. The double would now be joined by a complete three in the opposite direction, a zigzag labelled primary wave X. Primary wave Y may be a flat which needs to begin with a clear five down for a movement at primary degree. The second structure in a double combination for primary wave Y would be expected to end about the same level as the first, about 4,292 so that the whole thing moves sideways.
If cycle wave IV is a triangle, then primary wave A would be a complete zigzag. Primary wave B would now also be a complete zigzag. Primary wave C for a triangle may not move beyond the end of primary wave A at 4,292.14. A triangle could take several months to unfold as price moves sideways in an ever decreasing range.
At this stage, a short term upper invalidation point would be at 5,163.47. If primary wave C or Y has begun, then within the first five down no second wave correction may move beyond its start.
BEAR ELLIOTT WAVE COUNT
DAILY CHART
Click chart to enlarge.
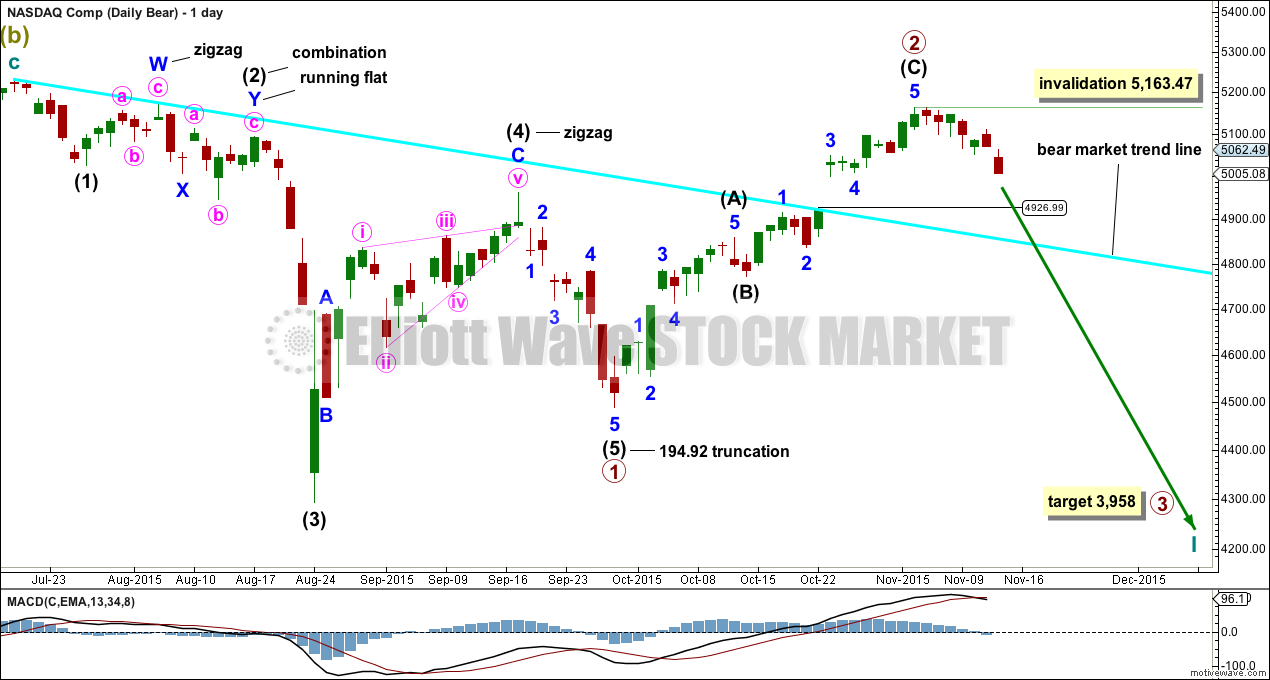
The bear wave count just moves everything from the all time high at 5,132.52 all down one degree. Grand Super Cycle wave II may be an incomplete flat, combination or double flat.
A new low below 2,861.51 would invalidate the bull wave count and confirm a huge market crash.
All subdivisions are seen in exactly the same way, only the degree of labelling is different.
There may now be either a complete five down with a severely truncated fifth wave as labelled, or there may be a complete three down for a first wave of a leading diagonal.
The structure of the next wave down and then the depth of the following upwards correction would indicate if an impulse or a leading diagonal is unfolding. If the next wave down is a zigzag, then a leading diagonal would be unfolding. If the next wave down is an impulse, then it would be more likely a larger impulse would be unfolding. If the following correction moves above 4,292.14, then it would overlap back into a first wave of a leading diagonal, and a leading diagonal would be indicated. If it remains below 4,292.14, then an impulse would be indicated.
Primary wave 2 should now be over as a deep zigzag. At 3,958 primary wave 3 would reach 1.618 the length of primary wave 1. No second wave correction may move beyond its start above 5,163.47 within primary wave 3.
The bear market trend line was breached by a close of more than 3% of market value. This is a warning that this bear wave count may be wrong. While none of the indices (S&P500, DJIA, DJT or Nasdaq) have made new all time highs though a bear market should be expected to remain intact.
TECHNICAL ANALYSIS
MONTHLY CHART
Click chart to enlarge. Chart courtesy of StockCharts.com.
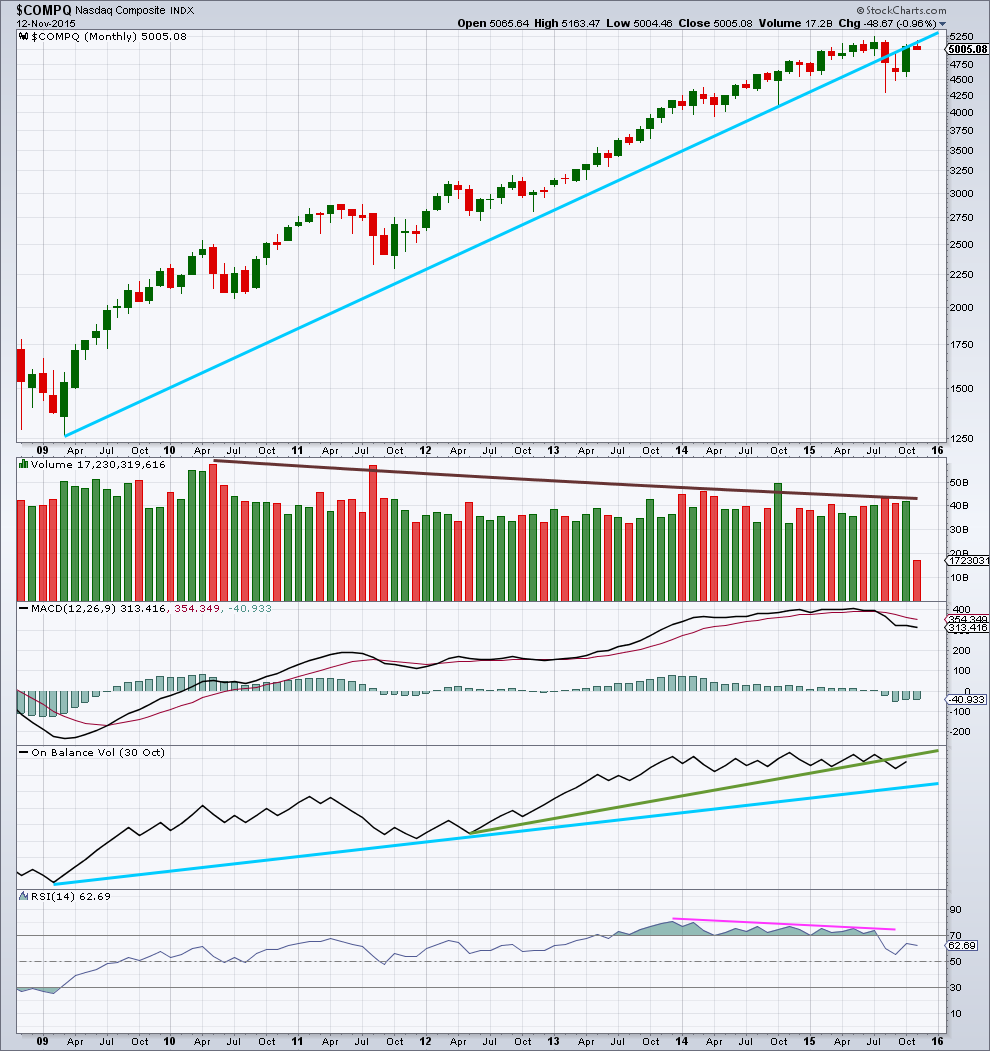
A more conservatively drawn trend line from the end of March 2009 is drawn here (blue line). It was reasonably shallow, repeatedly tested, and is highly technically significant. It has been breached and provided resistance.
Since May 2010, overall, as price rose to all time highs volume declined. The bull market was not well supported by volume and is suspicious.
There was slight negative technical divergence with price and MACD at the all time high.
On Balance Volume has breached a trend line held since May 2012, (green line) which is bearish. OBV is turning up. If it finds resistance at the green line and does not break through, that would be further bearishness and the strength of that line would be reinforced. If OBV breaches the longer held blue line, that would be further and stronger bearish indication.
There is negative divergence between price and RSI going back to December 2013, as price made all time highs. This is a strong bearish indicator. This was also seen up to March 2000, and was followed by a 78% drop in market value to the low of 1,108 in October 2012. It does not mean that the market must make a similar fall at this time, but it is a strong bearish indicator.
DAILY CHART
Click chart to enlarge. Chart courtesy of StockCharts.com.
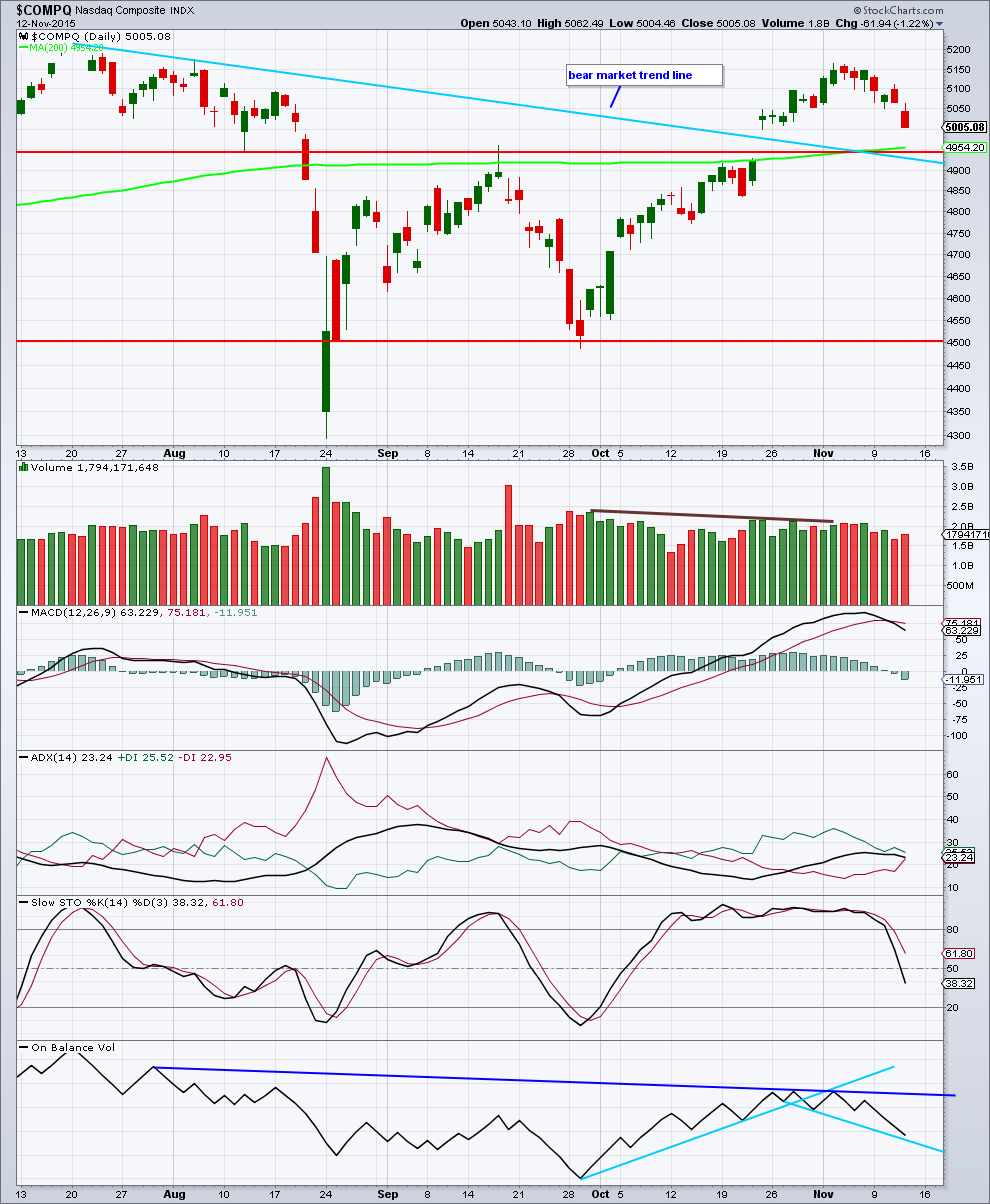
Volume declined slightly while price has been rising overall for 25 days. The rise in price was not supported by volume and is suspicious.
ADX is turning downwards indicating no trend currently. The -DX and +DX lines may be coming to cross. If they do, it would indicate a trend change.
So far the fall in price of the last seven days comes on overall a decline in volume. Volume is not supporting price movement either way.
Price may find some support here at the breakaway gap. If the gap is closed and price closes below the horizontal trend line, that would be a bearish indicator. If price bounces up from here to new highs, then it would be a strong bullish indicator.
On Balance Volume is a good leading indicator and works well with trend lines. It has breached the upwards sloping blue line, a bearish indicator, three days before price found the last high. OBV has come to touch a short held downwards sloping line. If this is breached, it would be further bearishness. If OBV bounces up from here, it would reinforce the strength of that line. OBV needs to break above the dark blue line for it to provide a bullish indication.
Today’s session isn’t quite closed, so this may not be the result, but so far it looks like Nasdaq is forming an island reversal on the daily chart.
A strong bearish reversal pattern.
Stay disciplined and take profits folks. Rolled a number of positions again today with new leg down. Those of you looking to do some early Xmas shopping November UVXY 50.0 calls looking very merry! 😀
Thanks for the tip vernecarty!
Remarkably, the rally off the September lows resulted in a new high for the Nasdaq 100, and bullish sentiment was even higher than prior to the August correction although none of the other major indices confirmed. The implication is that the market is going to have to decline quite a bit to dispel the extreme optimism, farther than most expect I think. It will be interesting to see how high the VIX spikes this time around to signal an intermediate bottom as the last spike exceeded the panic during the Lehman’s Brothers crisis. One strange development during the last cycle was the decoupling of UVXY from VIX when VIX made its spike high on August 24 at 53.29. Although I made a great trade on UVXY, I left a substantial amount of money on the table as UVXY did not make its high some twenty points higher until a week later on September 1. In all the years I have traded UVXY I have never seen it do what it did then. Something strange was definitely going on behind the scenes, probably a harbinger of the utter chaos that is going to develop in the derivatives market as the bear really gets going. It is now looking like we are going to get another early Christmas present in the form of a potential ten-bagger with the current decline. I plan on holding onto half my position after VIX spikes and employ a very generous trailing stop on the rest just in case UVXY throws us another curve ball. Futures suggesting a tepid bounce and that the carnage will continue. Very strange times indeed!