
Nasdaq has breached its bull market trend line by a close of more than 3% of market value.
I have two Elliott wave counts today. The first is bullish still at super cycle degree. The second expects Nasdaq is in the early stages of a huge market crash.
Changes to last analysis are bold.
BULL WAVE COUNT
MONTHLY CHART
Click chart to enlarge.
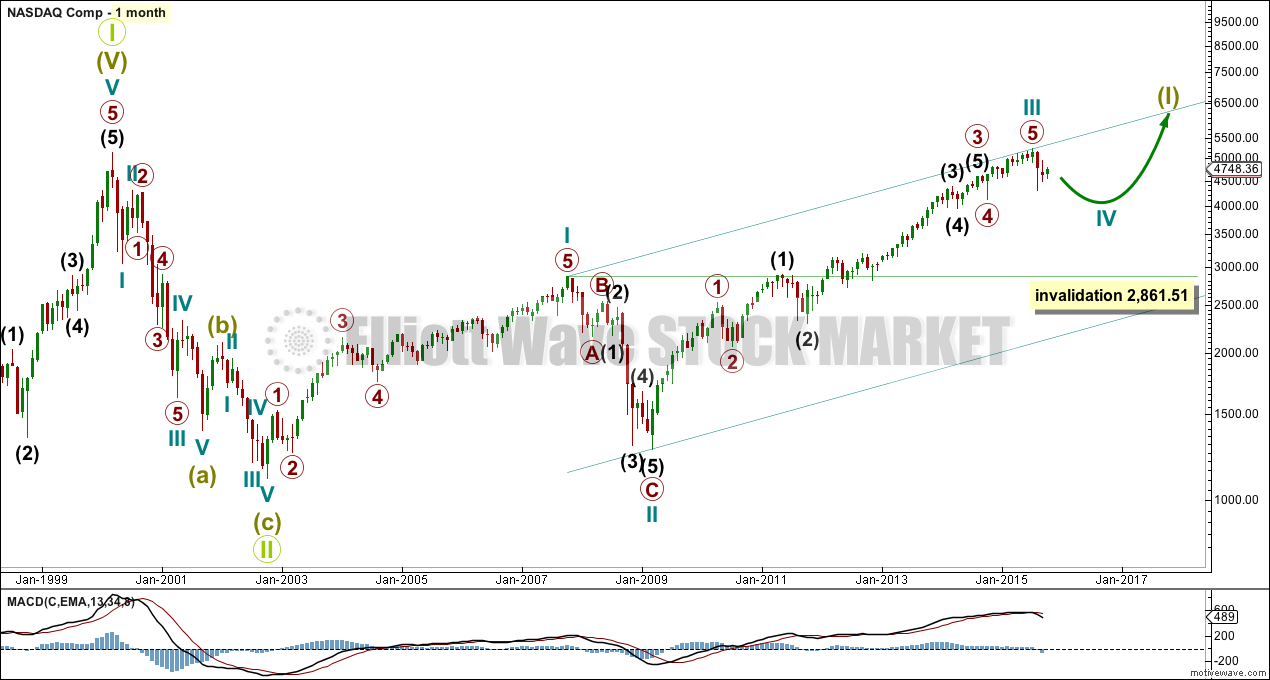
Grand Super Cycle wave II is seen here as over in just 31 months. This is possible, but it is more likely it would last longer than this.
This wave count sees Nasdaq in a Grand Super Cycle wave III upwards.
There is no Fibonacci ratios between cycle waves I and III.
Super Cycle wave (I) is an incomplete impulse. Within Super Cycle wave (I), cycle wave IV is underway.
Cycle wave II was a very deep 0.91 zigzag lasting 17 months. Cycle wave IV should exhibit alternation, so is most likely to be a flat, combination or triangle. These are more time consuming structures than zigzags, so cycle wave IV should last at least 18 months and may last a total Fibonacci 21 or more likely 34 months.
Cycle wave IV may not move into cycle wave I price territory below 2,861.51.
WEEKLY CHART
Click chart to enlarge.
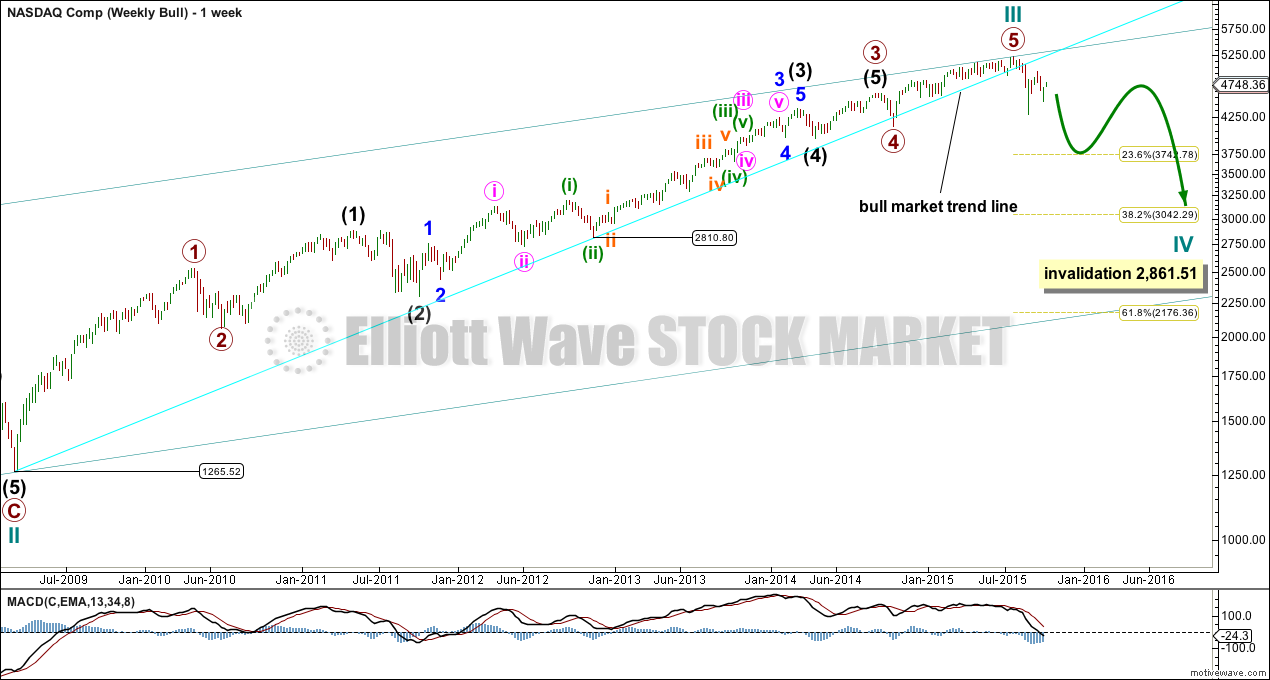
Within cycle wave III, there are no Fibonacci ratios between primary waves 1, 3 and 5.
Ratios within primary wave 3 are: intermediate wave (3) is 28.3 short of 2.618 the length of intermediate wave (1), and intermediate wave (5) has no Fibonacci ratio to either of intermediate waves (1) or (3).
Within intermediate wave (3), there are no adequate Fibonacci ratios between minor waves 1, 3 and 5.
Ratios within minor wave 3 are: minute wave iii is 119.3 points longer than 2.618 the length of minute wave i (this variation is less than 10% the length of minute wave iii and so acceptable), and minute wave v is 36.6 points short of 0.618 the length of minute wave i.
Ratios within minute wave iii are: minuette wave (iii) has no Fibonacci ratio to minuette wave (i), and minuette wave (v) is 26 points longer than 0.618 the length of minuette wave (i).
Within minuette wave (iii), there are no adequate Fibonacci ratios between subminuette waves i, iii and v.
Nasdaq just does not reliably exhibit Fibonacci ratios in its impulses. This makes target calculation unreliable.
Cycle wave IV may end about either the 0.236 or 0.382 Fibonacci ratios of cycle wave III at 3,748 or 3,042.
The bull market trend line is drawn from the end of cycle wave II in March 2009, to the end of minuette wave (ii) in November 2012. This trend line has been breached by a close of more than 3% of market value indicating a market change from bull to bear.
DAILY CHART
Click chart to enlarge.
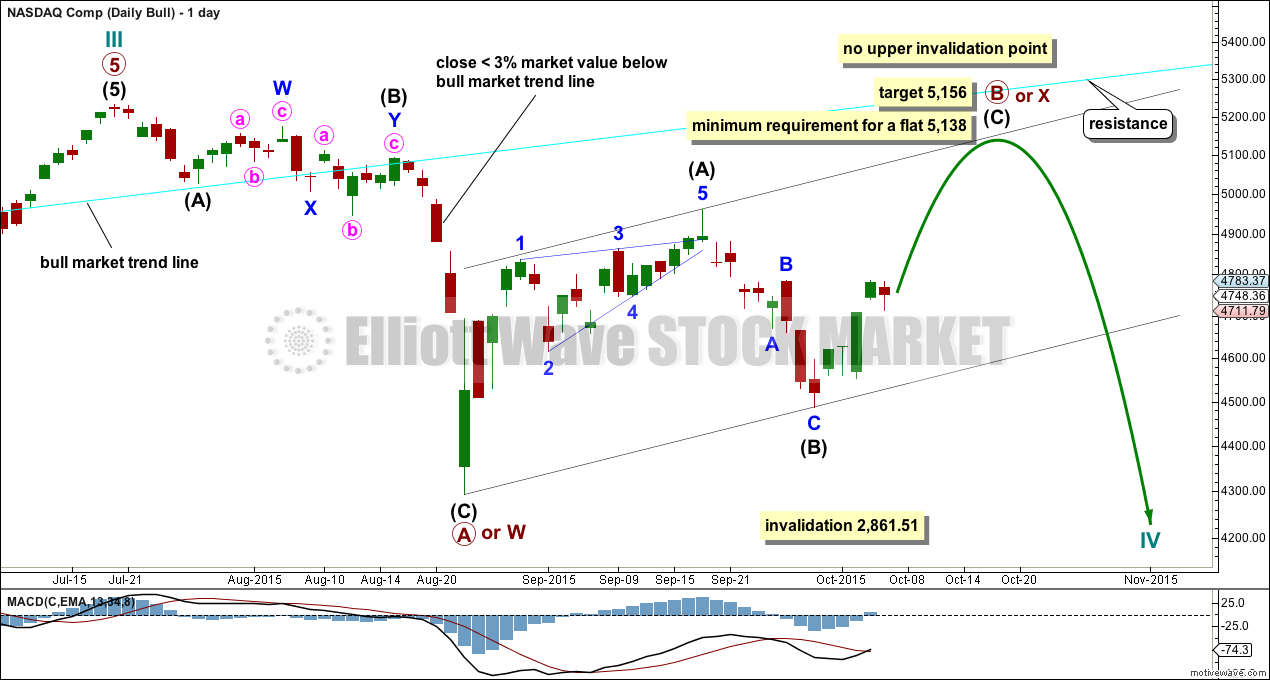
The bull market trend line was breached by a close more than 3% of value below it on 20th August.
There is a 5-3-5 complete thus far to the downside. This may be a three wave structure for a primary degree A or W wave for this more bullish wave count (more bullish than the very bearish wave count below). Cycle wave IV is most likely to be a flat, combination or triangle to exhibit alternation with the zigzag of cycle wave II.
If cycle wave IV is a flat correction, then primary wave A may be a complete three. Primary wave B must retrace a minimum 90% of primary wave A at 5,138. Primary wave B may make a new all time high above the start of primary wave A as in an expanded flat. Primary wave B must subdivide as a three.
If cycle wave IV is a combination, then the first structure is a completed zigzag which would be labelled primary wave W. The double should be joined by a three in the opposite correction labelled primary wave X. Primary wave X may be any corrective structure, has no minimum requirement, and may make a new high above the start of primary wave W.
If cycle wave IV is a triangle, then primary wave A would be a complete zigzag. Primary wave B must be a three wave structure and may make a new high above the start of primary wave A as in a running triangle.
If a zigzag is unfolding upwards for primary wave B or W, then at 5,156 intermediate wave (C) would reach equality in length with intermediate wave (A).
There is no upper invalidation point for any of these three most likely structures. At this stage, it is impossible to know which structure cycle wave IV may unfold as.
BEAR ELLIOTT WAVE COUNT
MONTHLY CHART

Click chart to enlarge.
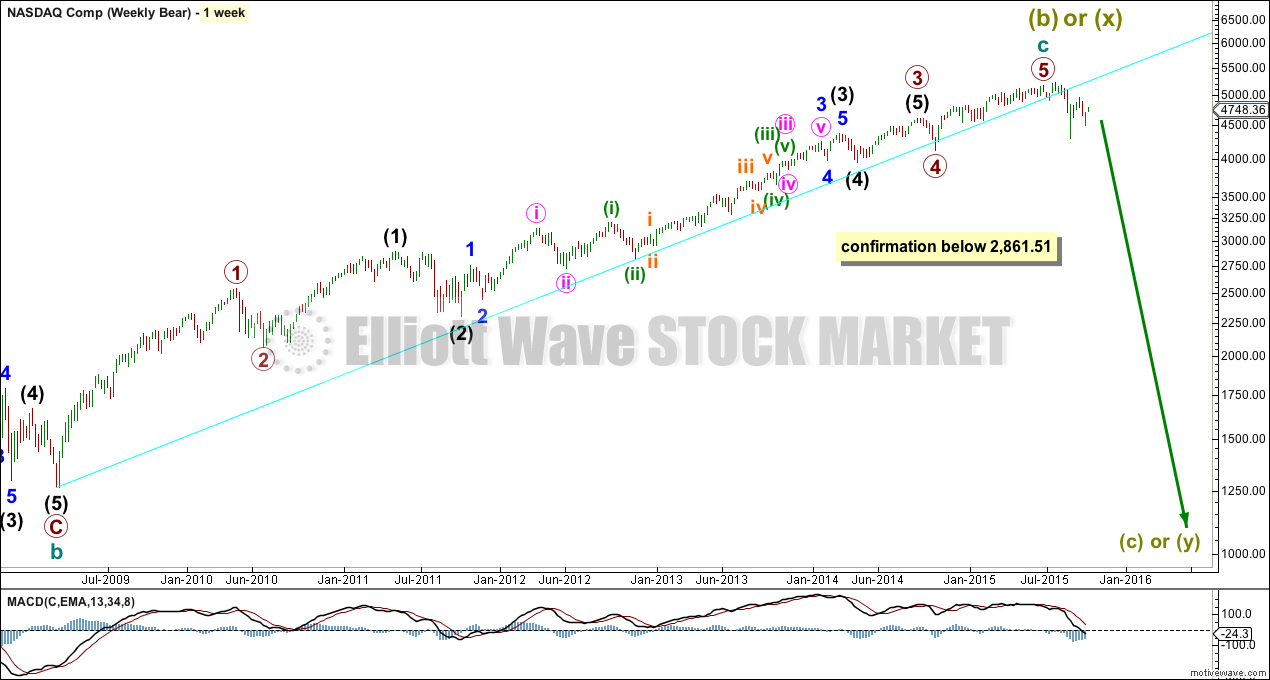
The bear wave count just moves everything from the all time high at 5,132.52 all down one degree. Grand Super Cycle wave II may be an incomplete flat, combination or double flat.
A new low below 2,861.51 would invalidate the bull wave count and confirm a huge market crash.
All subdivisions are seen in exactly the same way, only the degree of labelling is different.
If Grand Super Cycle wave II is a combination, then super cycle wave (y) would be a zigzag or triangle.
If Grand Super Cycle wave II is a double flat, then super cycle wave (y) would be a flat correction ending about the same level as super cycle wave (w) at 1,160.
If Grand Super Cycle wave II is a regular flat, then super cycle wave (c) would be a five wave structure to end below super cycle wave (a) at 1,160 to avoid a truncation.
WEEKLY CHART
Click chart to enlarge.
The labelling of this upwards impulse is exactly the same as the bull wave count at the weekly chart level because 1-2-3 of an impulse subdivides 5-3-5, exactly the same as a zigzag. Here the bull market from March 2009 is seen as a zigzag for a super cycle wave (b). Super cycle wave (b) was a 101% length of super cycle wave (a).
DAILY CHART
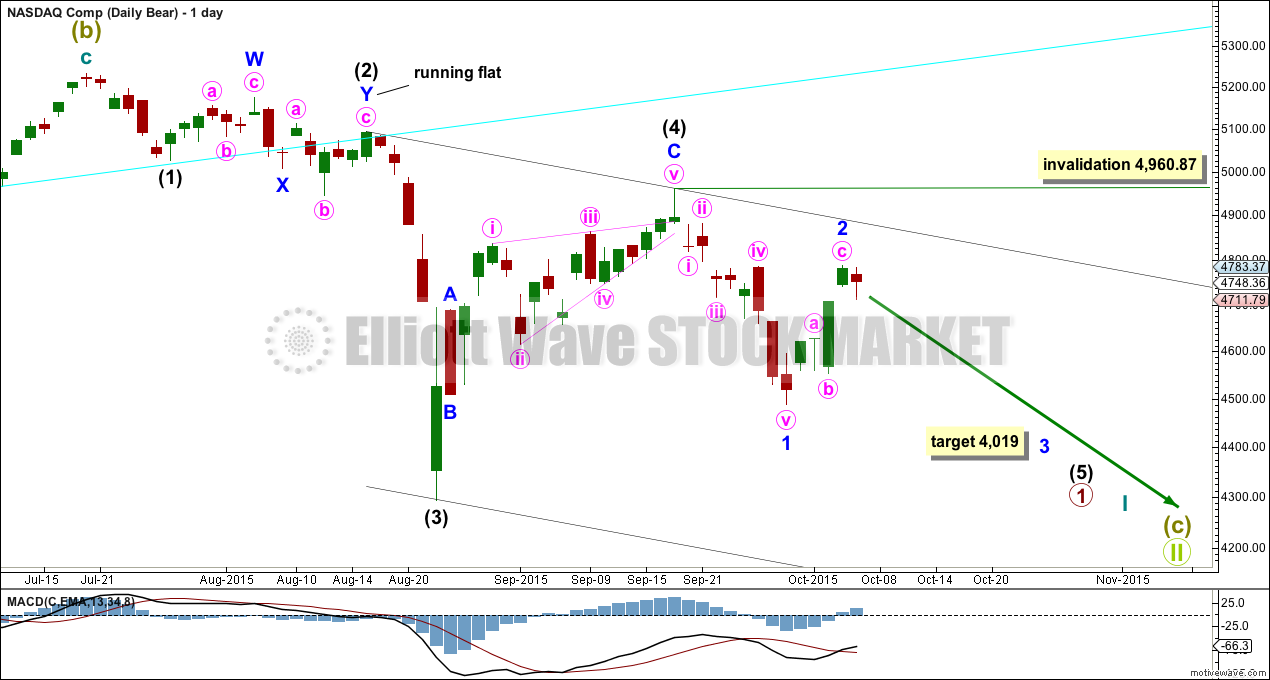
Click chart to enlarge.
A move down at Grand Super Cycle degree should begin with a clear five down at primary degree. So far only 1-2-3-4 may be complete. Intermediate wave (5) may be unfolding.
Within intermediate wave (5), minor wave 2 may not move beyond the start of minor wave 1 above 4,960.87.
At 4,019 minor wave 3 would reach 1.618 the length of minor wave 1.
This idea expects an extended fifth wave for intermediate wave (5).
TECHNICAL ANALYSIS
MONTHLY CHART

Click chart to enlarge.
A more conservatively drawn trend line from the end of March 2009 is drawn here (blue line). It was reasonably shallow, repeatedly tested, and is highly technically significant. It has been breached and provided resistance.
Since May 2010, overall, as price rose to all time highs volume declined. The bull market was not well supported by volume and is suspicious.
There was slight negative technical divergence with price and MACD at the all time high.
On Balance Volume has breached a trend line held since May 2012 (green line) which is bearish. If OBV breaches the longer held blue line that would be further and stronger bearish indication.
There is negative divergence between price and RSI going back to December 2013, as price made all time highs. This is a strong bearish indicator. This was also seen up to March 2000, and was followed by a 78% drop in market value to the low of 1,108 in October 2012. It does not mean that the market must make a similar fall at this time, but it is a strong bearish indicator.
DAILY CHART

Click chart to enlarge.
Since early September, the black ADX line has been overall moving lower indicating the market is no longer trending but consolidating. Price has been swinging between horizontal lines of support and resistance.
Upwards movement may find resistance at the sloping blue trend line, or at the 200 day Simple Moving Average, or at the upper horizontal red trend line. A range bound trading approach would expect the current upwards swing to only end when price finds resistance and Stochastics is overbought. Neither of these conditions are currently met.
While price has been moving sideways and consolidating, it is a downwards day which has strongest volume suggesting the breakout when it comes is more likely to be downwards than upwards.
While price remains below the 200 day SMA and the bull market trend line has been breached, it is reasonable to expect that Nasdaq remains in a bear market. Any bullish wave count at this stage would be counter to this technical analysis. Both Elliott wave counts are mid term bearish.
Hi,
New member and new to Elliot Wave. For Nasdaq, are you saying that the bullish trend is in tact?
Most certainly not. Both wave counts are bearish at cycle degree.