
Nasdaq has breached its bull market trend line by a close of more than 3% of market value.
I have two Elliott wave counts today. The first is bullish, still at super cycle degree. The second expects Nasdaq is in the early stages of a huge market crash.
To see detail of weekly charts which shows subdivisions of cycle wave III (bull) or cycle wave c (bear) see last analysis here.
New updates to this analysis are in bold.
BULL WAVE COUNT
MONTHLY CHART
Click chart to enlarge.
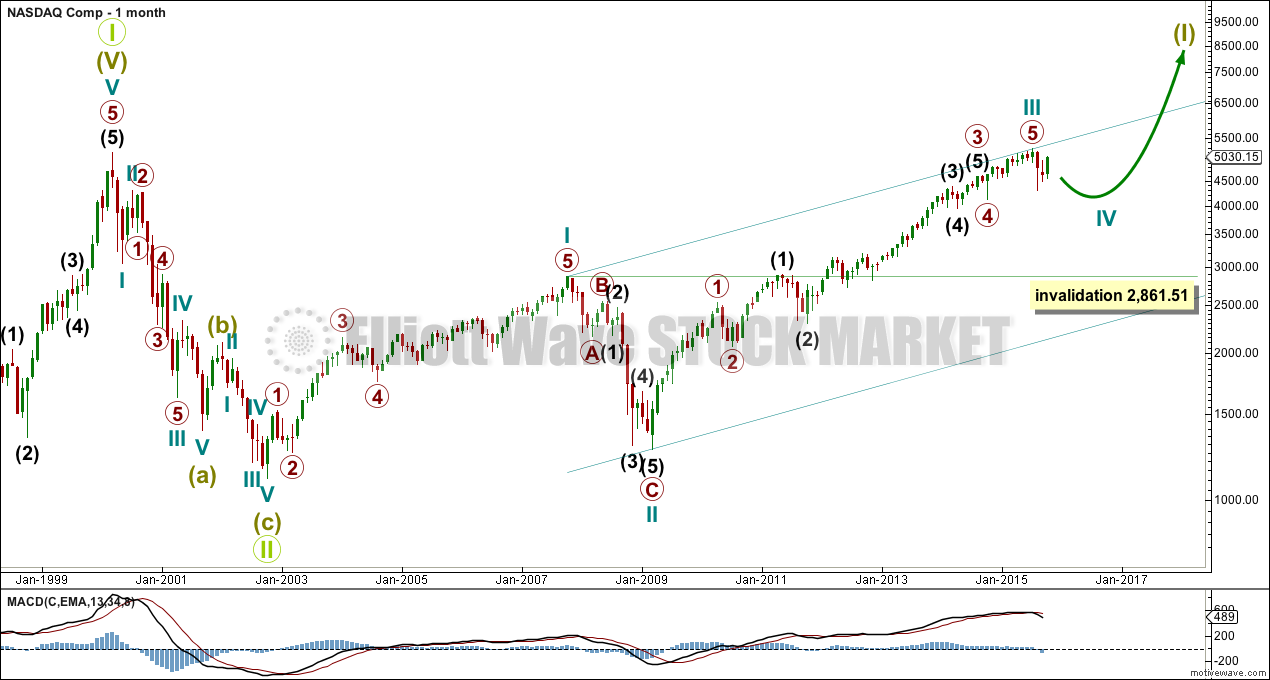
Grand Super Cycle wave II is seen here as over in just 31 months. This is possible, but it is more likely it would last longer than this.
This wave count sees Nasdaq in a Grand Super Cycle wave III upwards.
There is no Fibonacci ratios between cycle waves I and III.
Super Cycle wave (I) is an incomplete impulse. Within Super Cycle wave (I), cycle wave IV is underway.
Cycle wave II was a very deep 0.91 zigzag lasting 17 months. Cycle wave IV should exhibit alternation, so is most likely to be a flat, combination or triangle. These are more time consuming structures than zigzags, so cycle wave IV should last at least 18 months and may last a total Fibonacci 21 or more likely 34 months.
Cycle wave IV may not move into cycle wave I price territory below 2,861.51.
DAILY CHART
Click chart to enlarge.
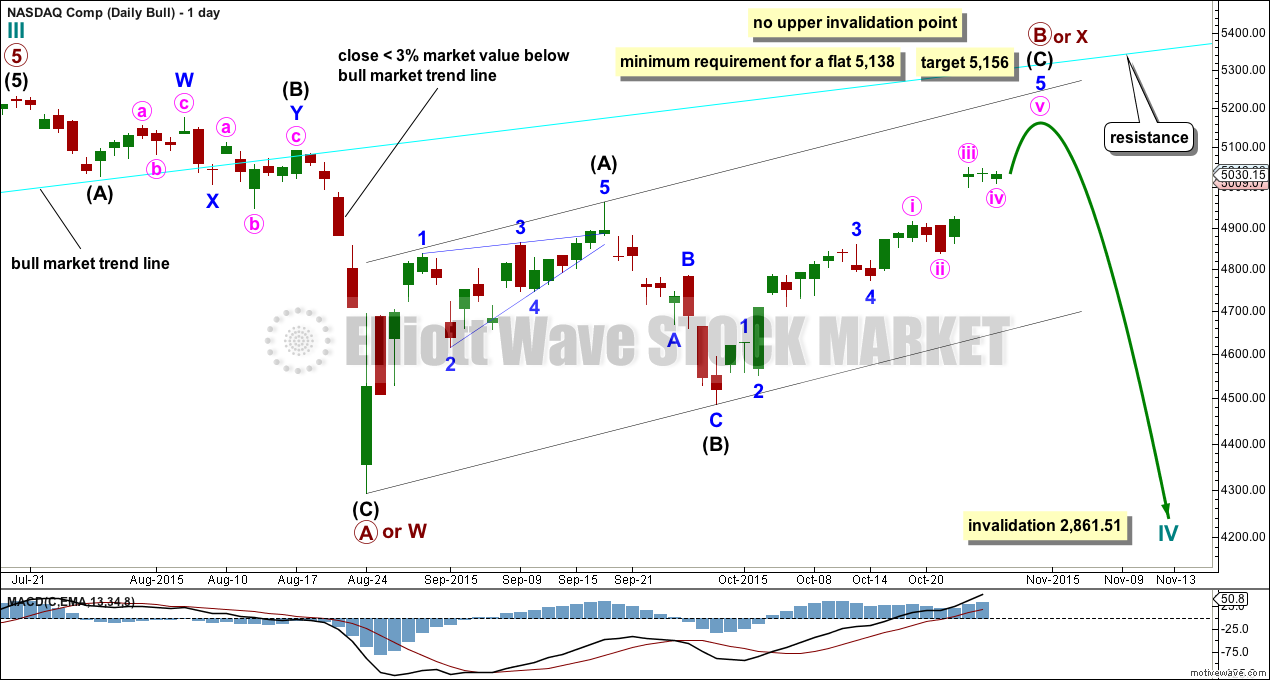
The bull market trend line was breached by a close more than 3% of value below it on 20th August.
There is a 5-3-5 complete thus far to the downside. This may be a three wave structure for a primary degree A or W wave for this more bullish wave count (more bullish than the very bearish wave count below). Cycle wave IV is most likely to be a flat, combination or triangle to exhibit alternation with the zigzag of cycle wave II.
If cycle wave IV is a flat correction, then primary wave A may be a complete three. Primary wave B must retrace a minimum 90% of primary wave A at 5,138. Primary wave B may make a new all time high above the start of primary wave A as in an expanded flat. Primary wave B must subdivide as a three.
If cycle wave IV is a combination, then the first structure is a completed zigzag which would be labelled primary wave W. The double should be joined by a three in the opposite correction labelled primary wave X. Primary wave X may be any corrective structure, has no minimum requirement, and may make a new high above the start of primary wave W.
If cycle wave IV is a triangle, then primary wave A would be a complete zigzag. Primary wave B must be a three wave structure and may make a new high above the start of primary wave A as in a running triangle.
If a zigzag is unfolding upwards for primary wave B or W, then at 5,156 intermediate wave (C) would reach equality in length with intermediate wave (A).
There is no upper invalidation point for any of these three most likely structures. At this stage, it is impossible to know which structure cycle wave IV may unfold as.
BEAR ELLIOTT WAVE COUNT
MONTHLY CHART
Click chart to enlarge.
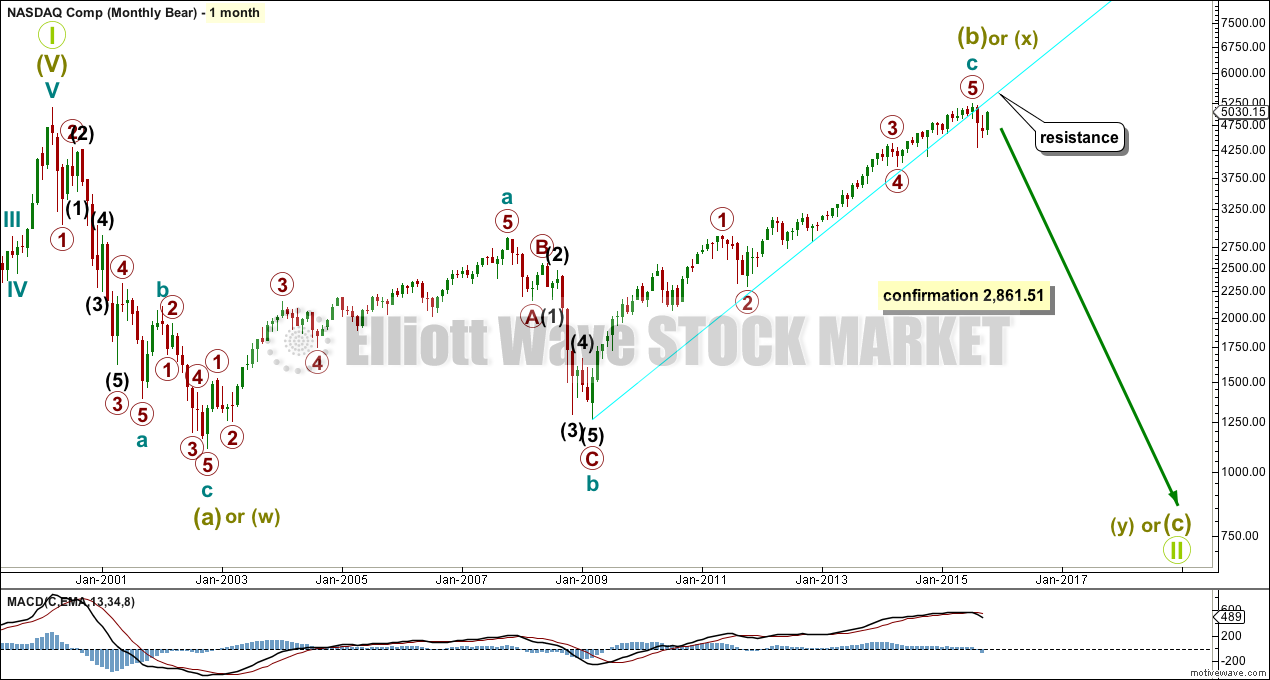
The bear wave count just moves everything from the all time high at 5,132.52 all down one degree. Grand Super Cycle wave II may be an incomplete flat, combination or double flat.
A new low below 2,861.51 would invalidate the bull wave count and confirm a huge market crash.
All subdivisions are seen in exactly the same way, only the degree of labelling is different.
If Grand Super Cycle wave II is a combination, then super cycle wave (y) would be a zigzag or triangle.
If Grand Super Cycle wave II is a double flat, then super cycle wave (y) would be a flat correction ending about the same level as super cycle wave (w) at 1,160.
If Grand Super Cycle wave II is a regular flat, then super cycle wave (c) would be a five wave structure to end below super cycle wave (a) at 1,160 to avoid a truncation.
DAILY CHART
Click chart to enlarge.
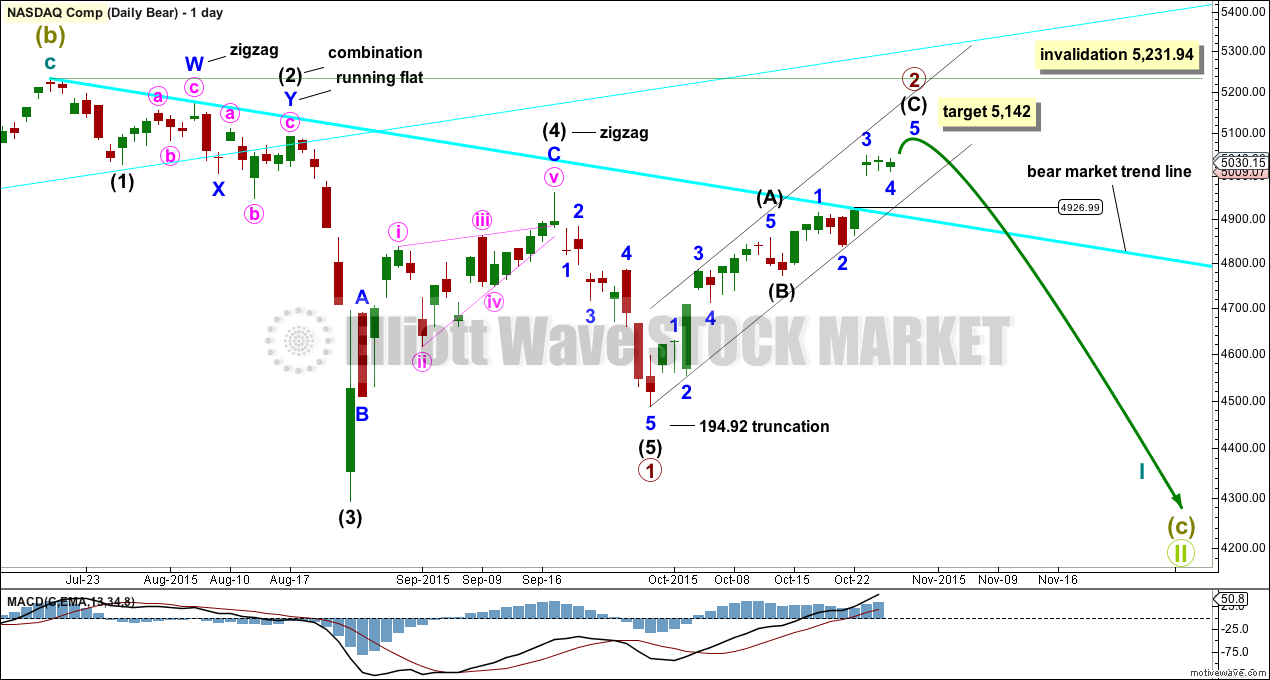
There may now be either a complete five down with a severely truncated fifth wave as labelled, or there may be a complete three down for a first wave of a leading diagonal. For both ideas the second wave may not move beyond the start of the first above 5,231.94.
The structure of the next wave down and then the depth of the following upwards correction would indicate if an impulse or a leading diagonal is unfolding. If the next wave down is a zigzag, then a leading diagonal would be unfolding. If the next wave down is an impulse, then it would be more likely a larger impulse would be unfolding. If the following correction moves above 4,292.14, then it would overlap back into a first wave of a leading diagonal, and a leading diagonal would be indicated. If it remains below 4,292.14, then an impulse would be indicated.
At 5,142 intermediate wave (C) would reach equality in length with intermediate wave (A).
TECHNICAL ANALYSIS
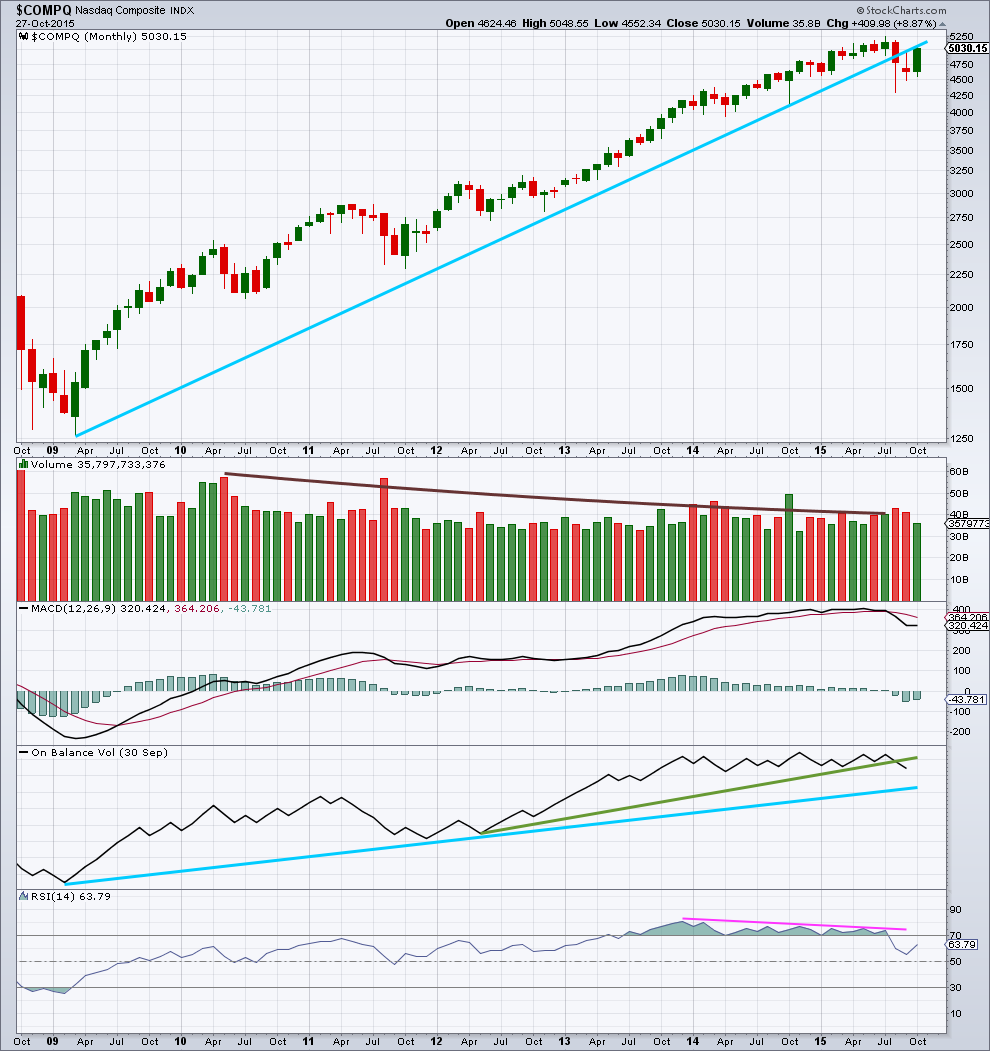
MONTHLY CHART
Click chart to enlarge. Chart courtesy of StockCharts.com.
A more conservatively drawn trend line from the end of March 2009 is drawn here (blue line). It was reasonably shallow, repeatedly tested, and is highly technically significant. It has been breached and provided resistance.
Since May 2010, overall, as price rose to all time highs volume declined. The bull market was not well supported by volume and is suspicious.
There was slight negative technical divergence with price and MACD at the all time high.
On Balance Volume has breached a trend line held since May 2012 (green line) which is bearish. If OBV breaches the longer held blue line that would be further and stronger bearish indication.
There is negative divergence between price and RSI going back to December 2013, as price made all time highs. This is a strong bearish indicator. This was also seen up to March 2000, and was followed by a 78% drop in market value to the low of 1,108 in October 2012. It does not mean that the market must make a similar fall at this time, but it is a strong bearish indicator.
DAILY CHART
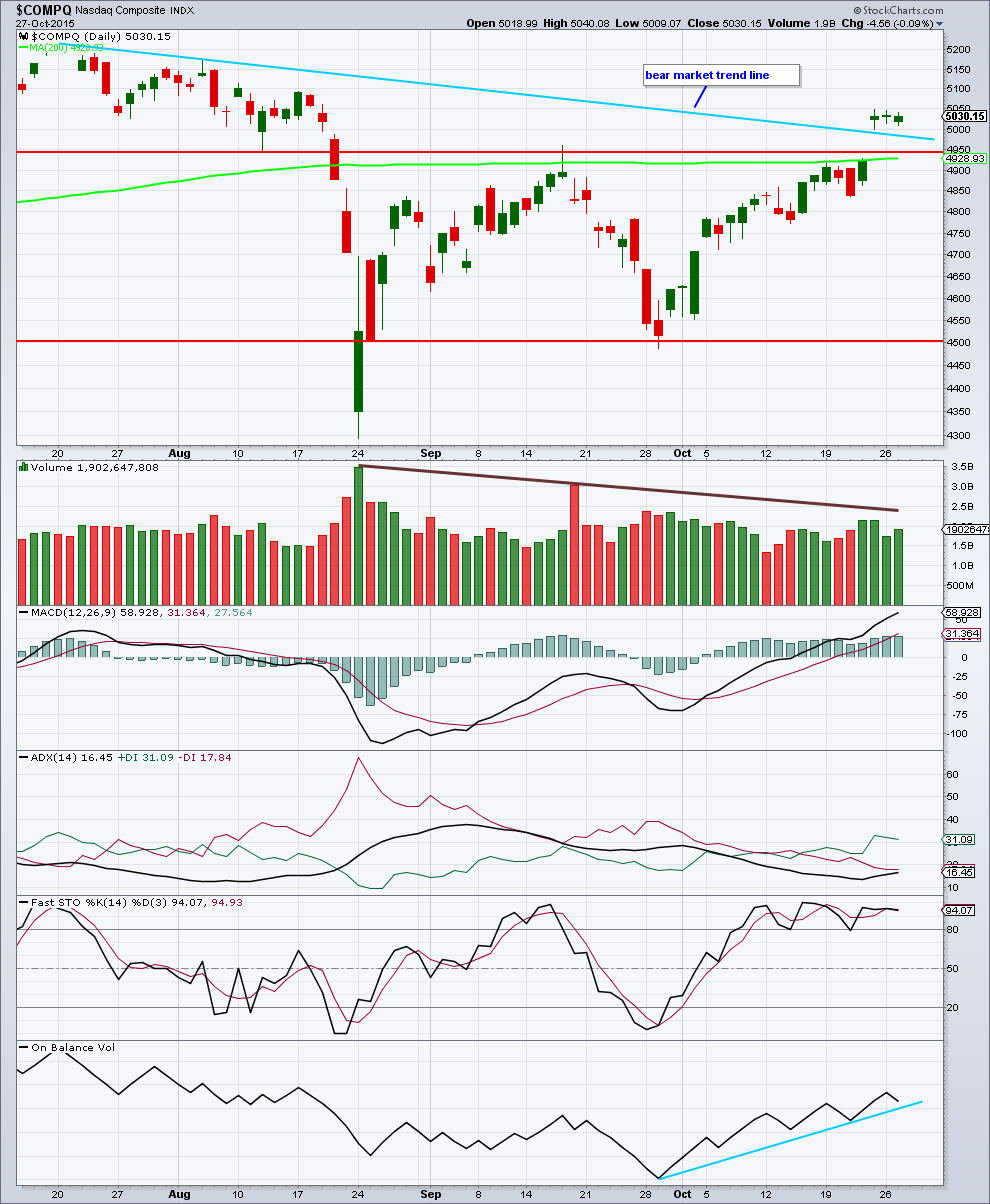
Click chart to enlarge. Chart courtesy of StockCharts.com.
The break above the upper horizontal trend line which previously provided resistance came with a breakaway gap and on an increase in upwards volume. This looks like Nasdaq has broken out of a consolidation zone to the upside.
MACD shows an increase in upwards momentum.
ADX is above 15 and rising, the +DX line is above the -DX line. This indicates potentially the start of a new upwards trend.
On Balance Volume remains above the short blue trend line.
So far all these indicators at the daily chart level are bullish. However, the picture at the monthly chart level remains very bearish.
When Nasdaq breached its long held bull market trend line on 20th August that indicated a market switch from bull to bear. For confidence in a switch back to a bull market the same approach should be used. The bear market trend line drawn here (and on the bear daily chart) is drawn using the approach outlined by Magee in “Technical Analysis of Stock Trends”. When that line is breached by a close of 3% or more of market value then a market change from bear to bull would be indicated. So far that has not happened.
Price needs to close at or above 5,075 to confirm a change back to a bull market. While that has not happened it should be assumed the trend remains the same, downwards.
Stochastics shows some divergence as price made new highs Stochastics failed to confirm. This is a weak bearish signal.
How about grand super cycle wave one finishes now in nasdaq, spx and djia ?
Would that be possible ?
Silly question by a fish who is watching waves always downsided 🙂
That would need a reanalysis of the end of the last upwards wave to the all time high.
There is a neat ending contracting diagonal there. All the subdivisions fit perfectly.
So the easiest way to see your idea of Grand Super Cycle I incomplete would be to see the bull alternate bull Elliott wave count as almost complete. The degree of labelling within cycle wave V upwards on that daily chart would all be moved up two degrees. There would be a primary degree first wave lasting only 8 days. Primary degree waves should last months. It looks all wrong.
There has been talk about the $TICK rising : On a monthly bases on a cumulative chart , it has always gone up. As an osculator it is down on the monthly
I’m not familiar with how to use this as a longer term indicator. And I’ve not come across this in any of the texts I have on technical analysis.
It would be much appreciated for myself and probably members too if you would be so kind as to provide a brief explanation of how to use this as a longer term indicator.
I’m assuming you’re looking at divergence between the cumulative $TICK and the oscillator as indicative of weakness?
ES as of 12:53 Euro time
John, what is ES? I don’t want to make any assumptions about it, and I can’t see the bottom of the chart (it’s cut off) where it seems to have a legend.
spx futures
With the exception of the T2118 everything looks weak.
A reminder that these breadth indicators are for all stocks trading on the $NYSE
SPX indicators , noting the HR stochastic looks ready to move up……