
Downwards movement was expected for the first Elliott wave count.
Summary: The first wave count should see strong downwards movement this week towards the target at 2,002. The second wave count expects upwards movement to continue, but this is not currently supported by volume. A new high above 2,114.24 would strongly favour the second wave count. A new low now below 2,079.30 would favour the first wave count.
Changes to last analysis are bold.
To see a weekly chart and how to draw trend lines click here.
FIRST ELLIOTT WAVE COUNT
Click chart to enlarge.
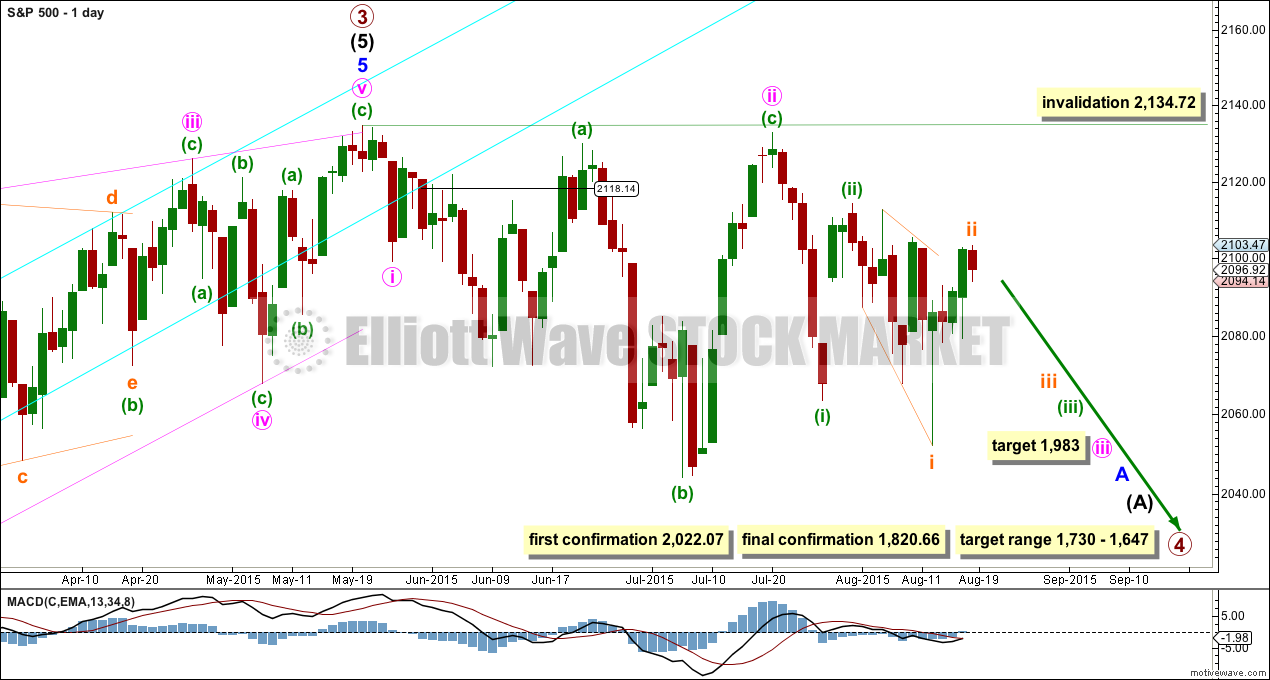
It is possible that the S&P has seen a primary degree (or for the bear count below a Super Cycle degree) trend change.
If primary wave 3 is over then primary wave 4 should begin.
Primary wave 2 was a relatively shallow 0.41 zigzag lasting 12 weeks. Primary wave 4 may be more shallow and is most likely to be a flat, combination or triangle. It may be longer lasting than primary wave 2 as these types of sideways corrective structures tend to be more time consuming than zigzags. Primary wave 4 is likely to end in the price territory of the fourth wave of one lesser degree between 1,730 – 1,647. It may last about 21 or maybe now even 34 weeks. So far it has just completed its twelfth week.
This wave count now has some confirmation at the daily chart level with a close more than 3% of market value below the long held bull market trend line.
Further confirmation would come with:
1. A new low below 2,044.02.
2. A new low below 2,022.07 to invalidate the second wave count.
3. A clear five down on the hourly chart.
4. A clear five down on the daily chart.
5. A new low below 1,820.66.
6. A break below the 50 week SMA on the weekly chart or the 200 day SMA on the daily chart.
As each condition is met the probability of a substantial trend change would increase.
At this stage, a trend change is looking somewhat likely so I’ll list points in its favour:
1. The long held bull market trend line, the strongest piece of technical analysis on ALL charts, has been breached now by a close more than 3% of market value.
2. There is quadruple negative divergence between price and MACD on the weekly chart.
3. There is double negative divergence between price and MACD on the daily chart.
4. There is persistent and strong negative divergence between price and RSI on the monthly chart. The last time this happened was October 2007 and we all know what happened after that…
5. A long held bull trend line on On Balance Volume going back to October 2014 has been breached, is no longer providing support, and is now providing resistance.
6. DJT has recently failed to confirm the continuation of a bull market. This does not indicate a bear market, but does indicate caution.
At 1,983 minute wave iii would reach 4.236 the length of minute wave i. This is the ratio I am using for this target because minute wave i was short and minute wave ii was deep.
Minute wave iii should show its subdivisions clearly on the daily chart so that when it is done it has a clear five wave impulse look to it. So far minuette wave (ii) shows up clearly. When it arrives minuette wave (iv) should also show up clearly. Minuette wave (iii) should show a strong increase in downwards momentum.
Click chart to enlarge.
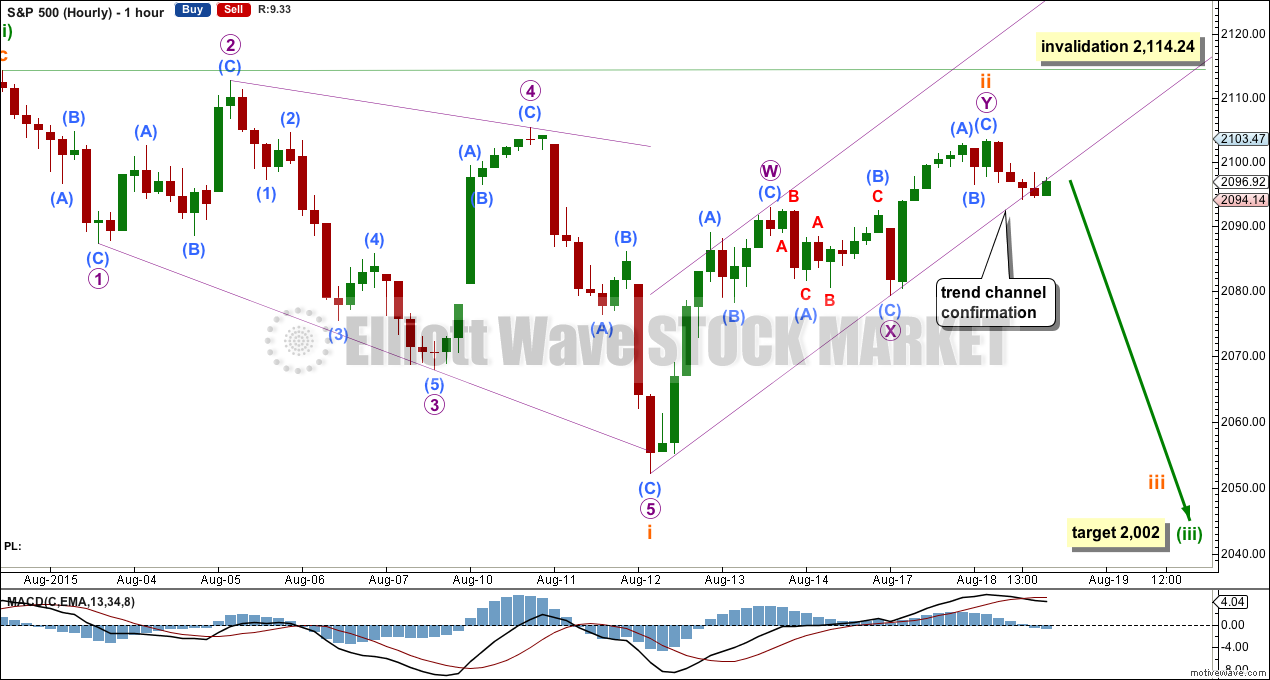
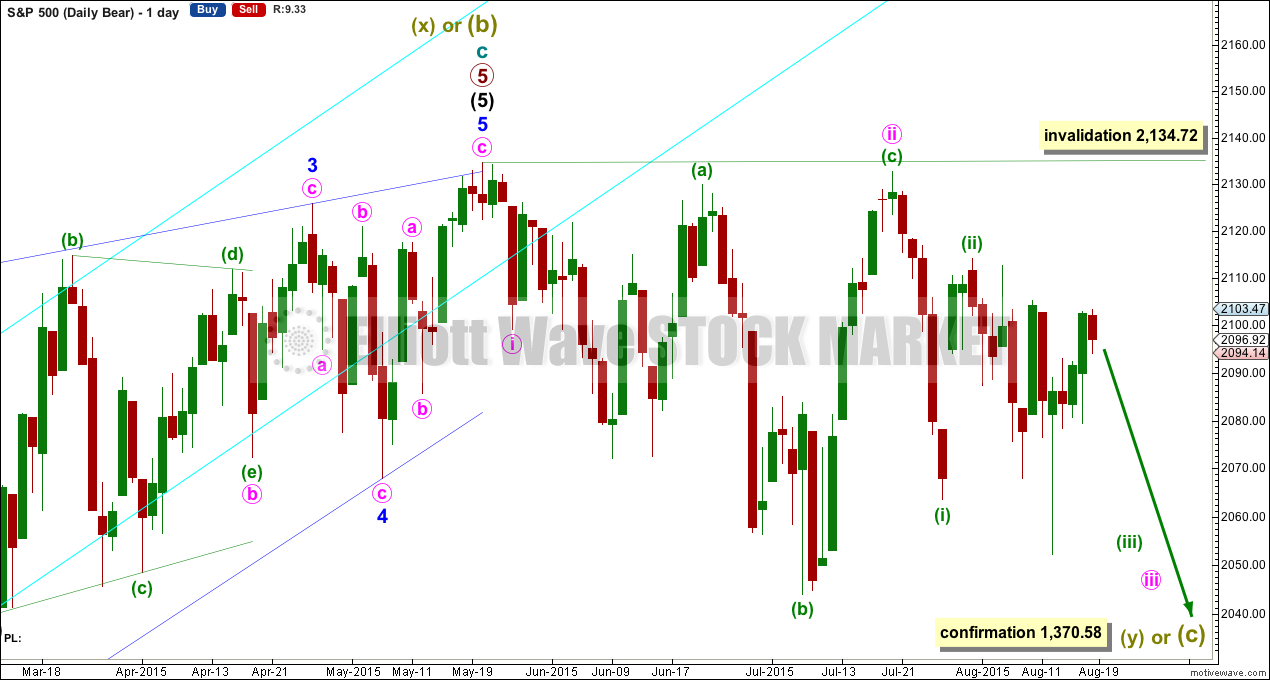
Minuette wave (ii) is very likely to be over. Downwards movement from the high at 2,114.24 now subdivides nicely as an expanding diagonal.
Leading diagonals require sub waves 2 and 4 to be zigzags. Sub waves 1, 3 and 5 are most commonly zigzags, but may also be impulses. If one of them is going to be an impulse, then it is usually the third wave. Here micro wave 3 fits best as an impulse, which fits for a leading diagonal. This slightly favours the first wave count over the second.
Following a leading diagonal in a first wave position, the second wave correction is usually very deep (very deep is usually more than 0.618).
Subminuette wave ii continued slightly higher during Tuesday, and now is 0.83 of subminuette wave i meeting the description of “very deep”. It subdivides best now as a double zigzag, and has a typical double zigzag look in that it has a sharp slope against the trend of the prior wave.
A best fit channel drawn about it is not properly breached yet. When the lower edge of this channel is clearly breached by at least one full hourly candlestick below the trend line and not touching it, and if that breach is with downwards (not sideways) movement, then it shall provide trend channel confirmation that subminuette wave ii is over and subminuette wave iii has arrived.
Subminuette wave iii would reach 1.618 the length of subminuette wave i close to the target for minuette wave (iii). I will leave the target calculated as is. When price gets down there, then I will look to see if the subdivisions suggest that the next correction would be subminuette wave iv or minuette wave (iv).
If subminuette wave ii moves higher, then it may not move beyond the start of subminuette wave i above 2,114.24.
At 2,002 minuette wave (iii) would reach 1.618 the length of minuette wave (i). Minuette wave (iii) should show an increase in downwards momentum beyond that seen for minuette wave (i).
SECOND ELLIOTT WAVE COUNT
Click chart to enlarge.
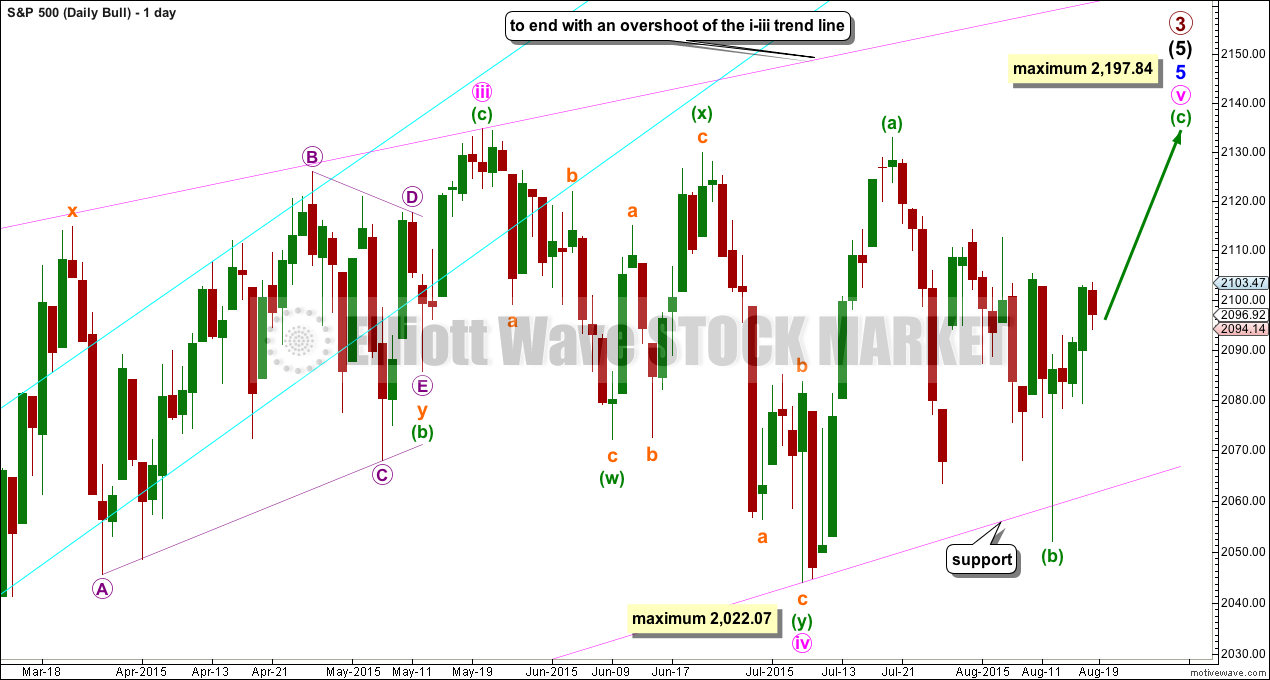
The ending contracting diagonal may still be incomplete. Ending diagonals require all sub waves to subdivide as zigzags, and the fourth wave should overlap first wave price territory. It is Elliott wave convention to always draw the diagonal trend lines to indicate a diagonal structure is expected.
My labelling here of minute wave iv within the diagonal as a double zigzag relies upon the interpretation of “double and triple zigzags take the place of zigzags” (“Elliott Wave Principle” by Frost and Prechter, 10th edition, page 91) to be true for zigzags within diagonals. This wave down may also be labelled as a single zigzag, but that does not have as neat a fit as a double zigzag.
The diagonal trend lines are not as clearly converging as they are for the first wave count. This reduces the probability of this wave count.
If it moves any lower, then minute wave iv may not be longer than equality in length with minute wave ii at 2,022.07. If it is over here, then minute wave v up also has a limit and may not be longer than equality with minute wave iii at 2,197.84.
The best way to see where and when upwards movement may end is the upper diagonal i-iii trend line. It is very likely to be overshot.
Click chart to enlarge.
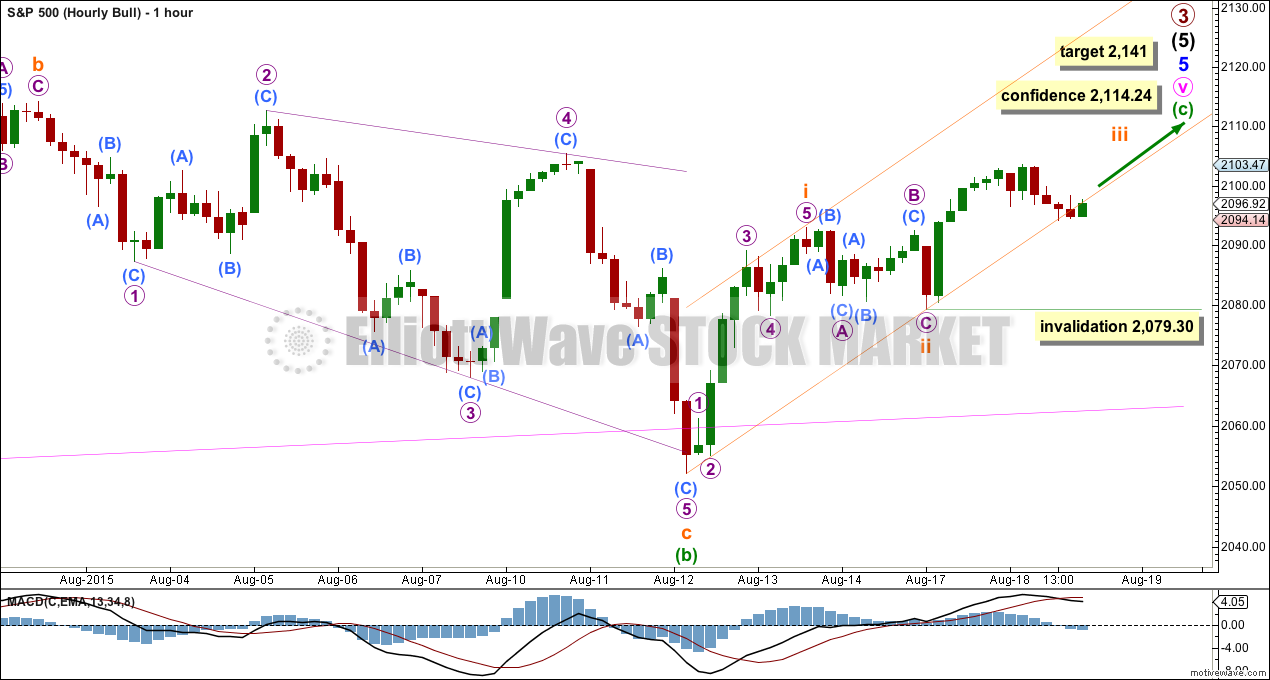
Minuette wave (b) subdivides well as a zigzag. Here the last big downwards movement is seen also as a diagonal, but it must be an ending diagonal not leading.
An ending diagonal requires all sub waves to be zigzags. This means that micro wave 3 must be seen as a zigzag (it fits better as an impulse). This favours the first wave count over this second wave count.
At 2,141 minuette wave (c) would reach equality in length with minuette wave (a). This would end the zigzag of minute wave v, the final zigzag up to end the entire structure for primary wave 3. The target may not be high enough though: it may not expect a big enough overshoot of the i-iii diagonal trend line seen on the daily chart.
Along the way up, a new high now above 2,114.24 would favour this second wave count over the first.
Upwards movement is not subdividing as well now as the beginning of an impulse as it does as a double zigzag. Subdivisions of this current upwards movement fit the first wave count better than this second wave count.
Within subminuette wave iii, no second wave correction may move beyond the start of its first wave below 2,079.30.
If this invalidation point is passed, then it may be that minuette wave (b) is continuing sideways, maybe unfolding as a triangle. That idea would remain valid only while price remains above 2,052.09, and would expect sideways movement in an ever decreasing range for several days yet.
BEAR ELLIOTT WAVE COUNT
Click chart to enlarge.
The subdivisions within cycle waves a-b-c are seen in absolutely exactly the same way as primary waves 1-2-3 for the main wave count.
In line with recent Grand Super Cycle wave analysis, I have moved the degree of labelling for the bear wave count all up one degree.
This bear wave count expects a Super Cycle wave (c) to unfold downwards for a few years, and if it is a C wave it may be devastating. It may end well below 666.79.
However, if this wave down is a Super Cycle wave (y), then it may be a time consuming repeat of the last big flat correction with two market crashes within it, equivalent to the DotCom crash and the recent Global Financial Crisis, and it may take another 8-9 years to unfold sideways.
Within the new bear market, no second wave correction may move beyond the start of its first wave above 2,134.72.
The second wave count above works in the same way for this bear wave count.
TECHNICAL ANALYSIS
Click chart to enlarge.
Note: It looks like I may begin to use StockCharts.com data for regular technical analysis. Today’s comments on volume refer to StockCharts.com data here.
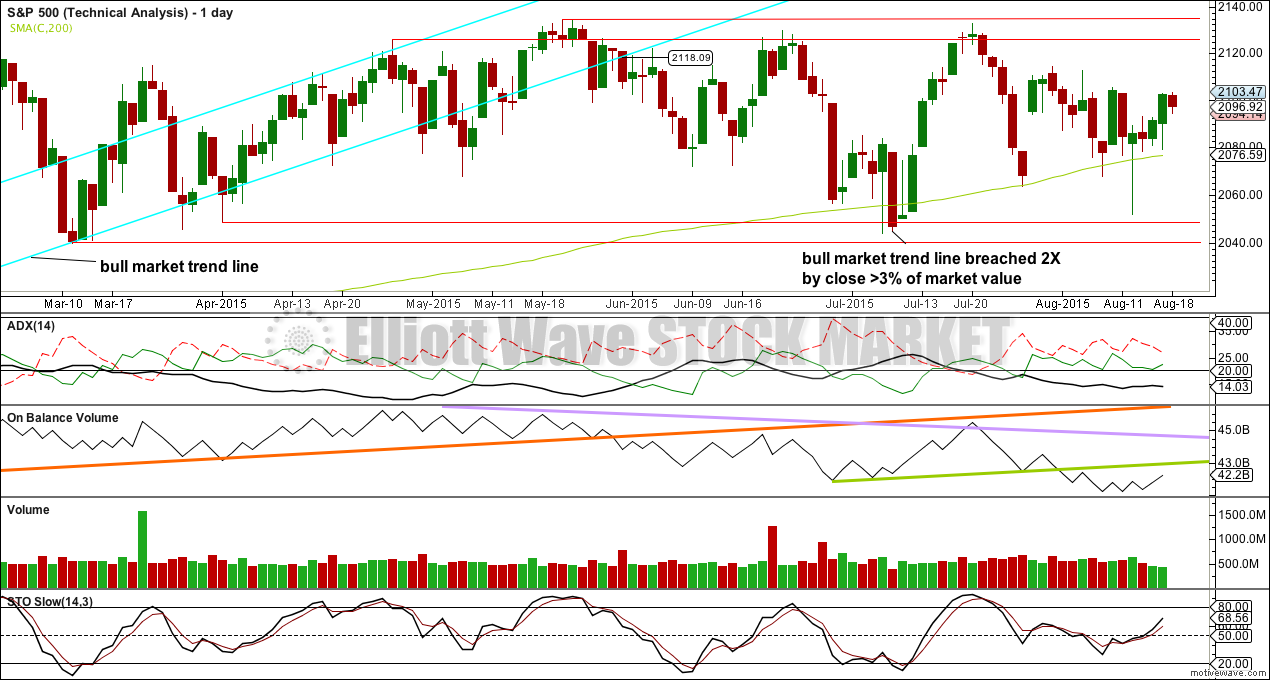
ADX is below 15, flat, and no clear trend is yet indicated. The market is still range bound.
A range bound trading system may be better used than a trend following system. This would still expect some more downwards movement, to not end until price finds support at the lower two red horizontal trend lines and Stochastics is oversold at the same time, or to end when price finds support at the 200 day SMA and Stochastics is oversold at the same time. The 200 day SMA has been overshot. Because Stochastics has not yet reached oversold, more downwards movement would still be expected from this approach until it is. But it looks now like price may not be able to get down to the lower support trend lines as it may be held up by the 200 day SMA.
Price may continue to find support about the 200 day SMA. On Balance Volume has now moved below its short green trend line which provided resistance. There is now room for the market to move up, and it may bounce up from here due to support at the SMA and continue until OBV provides resistance.
While the range bound trading approach would expect more downwards movement until Stochastics reaches oversold, price does not usually move up and down in a straight line; there are corrections along the way. This analysis would expect some upwards movement from here to be a counter movement to the downwards swing which is incomplete.
I would not expect upwards movement to end this short counter swing movement until OBV touches its short green trend line, using this approach.
The strongest piece of technical analysis on this chart is the bull market trend line. This trend line goes back to November 2011, is repeatedly tested and reasonably shallow, and is highly technically significant. The trend line has now been breached twice by closes more than 3% of market value below, indicating a market change from bull to bear. It is primarily for this reason that I slightly favour the first wave count.
Volume for the last rise in price declined. The rise in price was not supported by volume. Tuesday’s red candlestick comes with an increase in volume. Volume favours a downwards breakout from this consolidation.
A note on Dow Theory: for the bear wave count I would wait for Dow Theory to confirm a huge market crash. For that to be confirmed the following new lows are needed:
S&P500: 1,820.66
Nasdaq: 4,116.60
DJT: 7,700.49
DJIA: 15,855.12
At this time DJT is closest, but none of these indices have made new major swing lows yet.
This analysis is published about 10:23 p.m. EST.
Massive amounts of resources being expended to defend the S&P500 200 day SMA. Gap from this morning almost filled in what can only be described as sheer panic buying. If they don’t manage a positive close today with an attempt at one more high, we’re going down 200 points in short order…
….and it completes a red candlestick for the day, on rising volume.
overall it is looking reasonably bearish.