
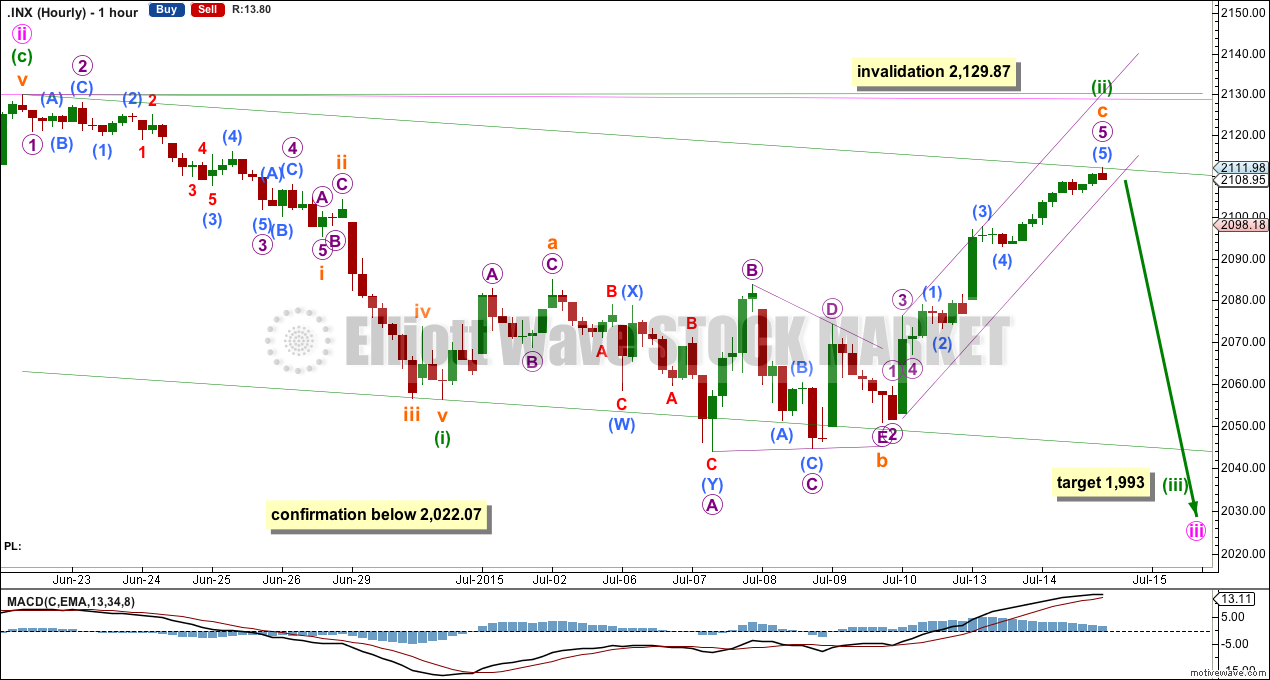
Downwards movement was expected, but to have confidence in that expectation a breach of a small channel on the hourly chart and a new low were required, but neither happened.
Price moved higher.
Summary: The channel on the hourly chart still needs to be breached to indicate the downwards trend has resumed. The target is now at 1,993.
Changes to last analysis are bold.
MAIN ELLIOTT WAVE COUNT
Click chart to enlarge.
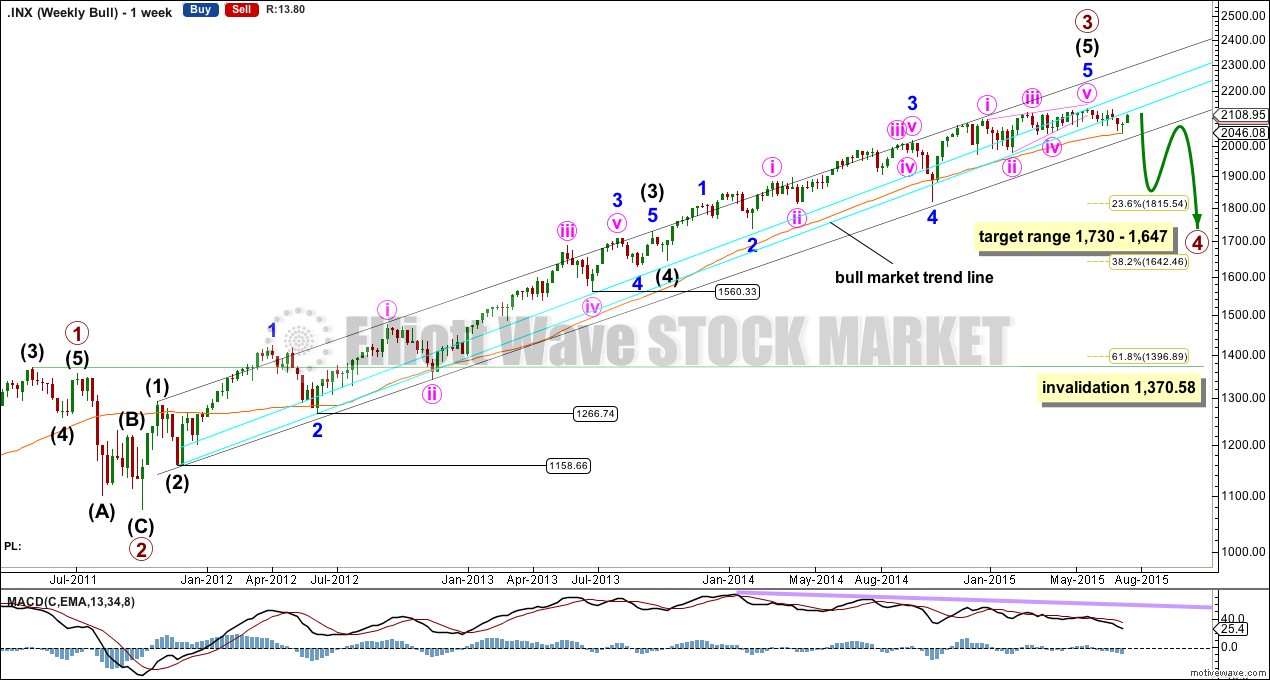
It’s time again to take a quick look at the weekly chart.
If primary wave 3 is over (as the bull market trend line suggests it is), then it was 55.96 points short of 1.618 the length of primary wave 1. This is a 5.3% variation (less than 10% may be considered acceptable).
Ratios within primary wave 3 are: intermediate wave (3) is just 0.76 longer than 2.618 the length of intermediate wave (1), and there is no Fibonacci ratio between intermediate wave (5) and either of (3) or (1).
Because intermediate wave (3) exhibits an almost perfect Fibonacci ratio to intermediate wave (1) and it subdivides perfectly as an impulse, I am confident that intermediate wave (4) begins there.
Primary wave 4 would be likely to end within the price territory of the fourth wave of one lesser degree: intermediate wave (4) has its price territory from 1,730 to 1,647.
Primary wave 4 would be likely to exhibit alternation to primary wave 2. Primary wave 2 was a 0.41 zigzag correction lasting 12 weeks, one short of a Fibonacci 13. Primary wave 4 may be more shallow than the 0.382 Fibonacci ratio, and may be a flat, combination or triangle, which are more time consuming structures than zigzags so it should be longer in duration than primary wave 2. Primary wave 4 may last a Fibonacci 21 weeks in total, 1.618 the duration of primary wave 2.
Primary wave 4 may not move into primary wave 1 price territory below 1,370.58. Invalidation of this main wave count would confirm the bear wave count at cycle degree.
There is quadruple negative technical divergence with price and MACD at the weekly chart level. This is very bearish.
Downwards movement is finding support at the 50 day SMA, and has done so for most of primary wave 3, and upwards movement is finding resistance at the bull market trend line. If price breaks above that trend line, then the alternate wave count would be favoured. If price breaks blow the 50 day SMA, then the main wave count would be further confirmed.
Click chart to enlarge.
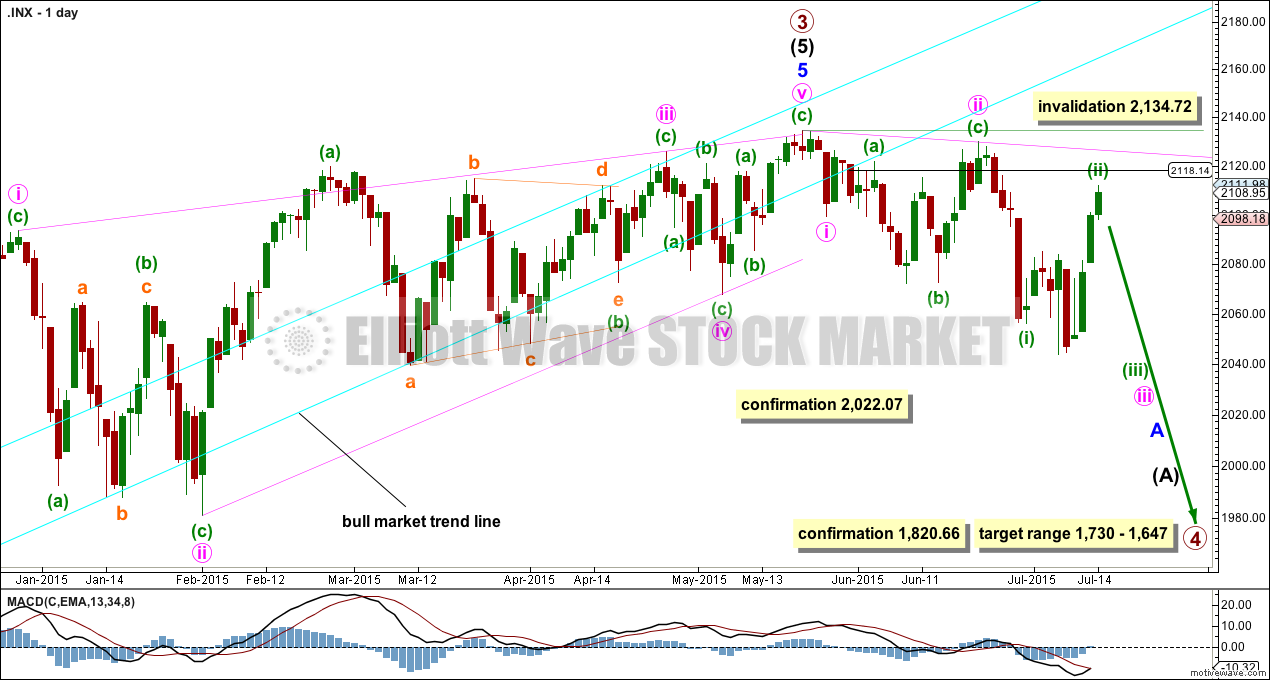
It is possible that the S&P has seen a primary degree (or for the bear count below a Super Cycle degree) trend change.
This wave count now has some confirmation at the daily chart level with a close more than 3% of market value below the long held bull market trend line.
Further confirmation would come with:
1. A new low below 2,022.07 to invalidate the alternate wave count.
2. A clear five down on the hourly chart.
3. A clear five down on the daily chart.
4. A new low below 1,820.66.
As each condition is met the probability of a substantial trend change would increase.
At this stage, a trend change is looking somewhat likely so I’ll list points in its favour:
1. ADX is above 20 and rising, and the -DX line is above the +DX line indicating a new downwards trend.
2. The long held bull market trend line, the strongest piece of technical analysis on ALL charts, has been breached now by a close more than 3% of market value.
3. There is quadruple negative divergence between price and MACD on the weekly chart.
4. There is double negative divergence between price and MACD on the daily chart.
5. There is persistent and strong negative divergence between price and RSI on the monthly chart. The last time this happened was October 2007 and we all know what happened after that…
6. A long held bull trend line on On Balance Volume going back to October 2014 has been breached and is no longer providing support (orange line added to OBV on the TA chart below).
7. DJT has recently failed to confirm the continuation of a bull market. This does not indicate a bear market, but does indicate caution.
Click chart to enlarge.
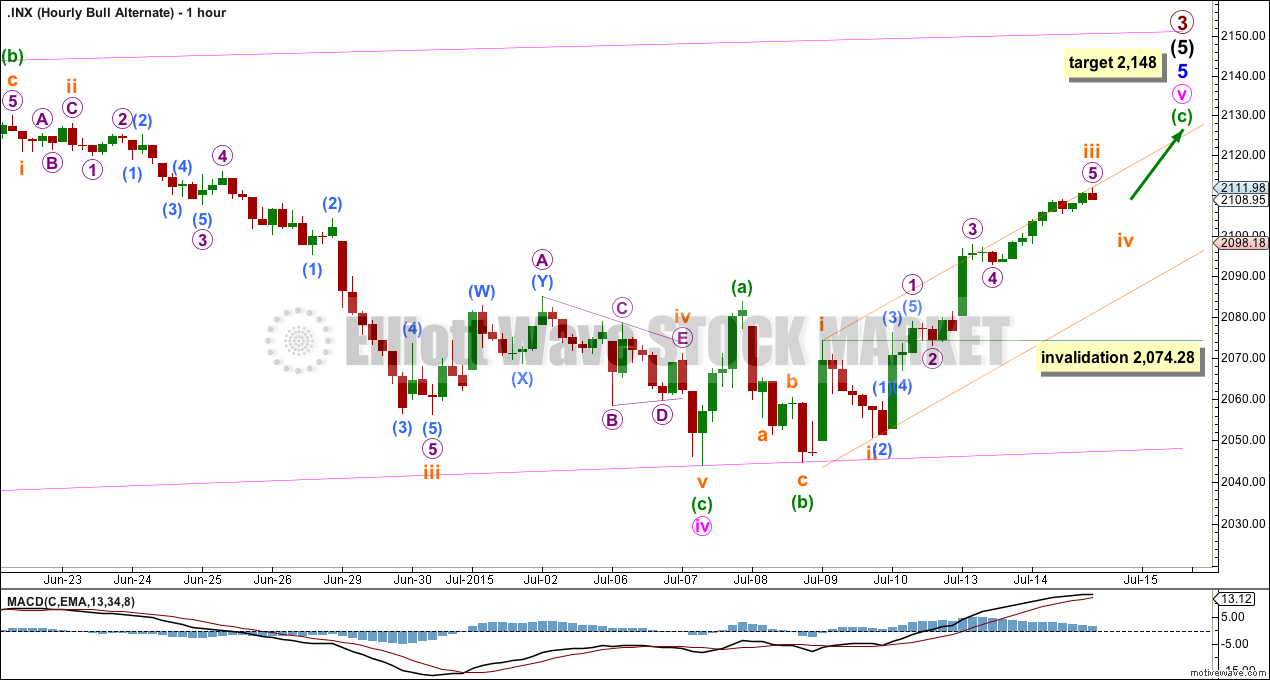
There was no breach of the small channel and no new low below 2,093 during Tuesday’s session. These things were required to confirm the resumption of the downward trend.
A breach of the small channel is still required to confirm that minuette wave (ii) is over. While price remains within the channel, then the possibility of further upward movement will remain. If price does continue higher, then it should find resistance at the upper pink trend line copied over from the daily chart.
At 1,993 minuette wave (iii) would reach 1.618 the length of minuette wave (i).
Minuette wave (ii) may not move beyond the start of minuette wave (i) above 2,129.87.
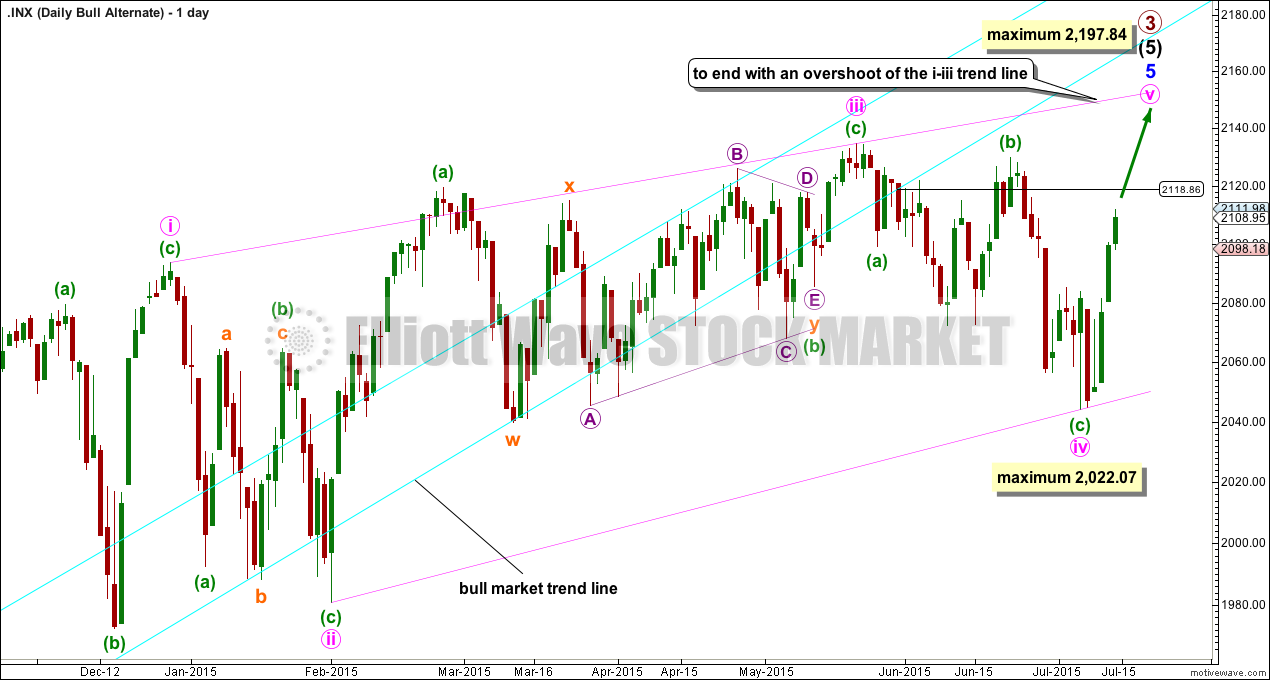
ALTERNATE ELLIOTT WAVE COUNT
Click chart to enlarge.
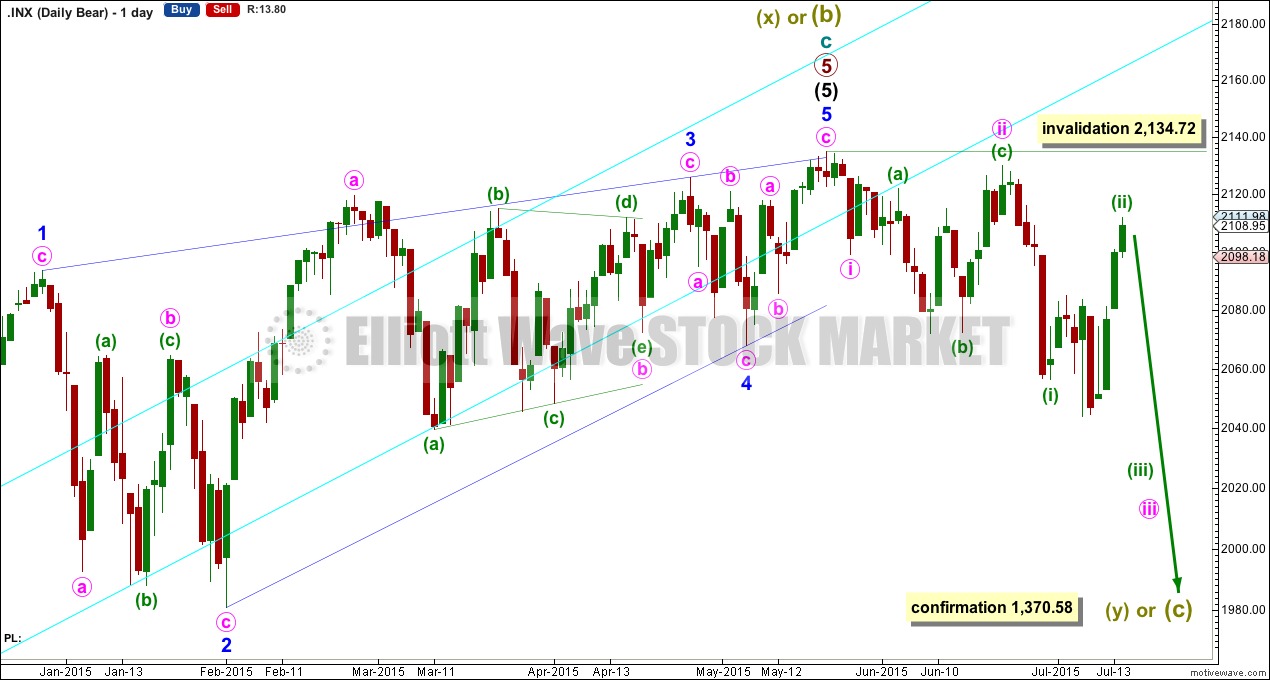
The ending contracting diagonal may still be incomplete. Ending diagonals require all sub waves to subdivide as zigzags, and the fourth wave should overlap first wave price territory. It is Elliott wave convention to always draw the diagonal trend lines to indicate a diagonal structure is expected.
The diagonal trend lines are no longer clearly contracting and minuette wave (c) within minute wave iv now looks like a three where it should be a five. This reduces the probability of this wave count.
If it moves any lower, then minute wave iv may not be longer than equality in length with minute wave ii at 2,022.07. If it is over here, then minute wave v up also has a limit and may not be longer than equality with minute wave iii at 2,197.84.
The best way to see where and when upwards movement may end is the upper diagonal i-iii trend line. It is very likely to be overshot. Upwards movement may find resistance at the long held bull market trend line.
Because the long held bull market trend line has now been breached by a close more than 3% of market value below it, this wave count is now an alternate and a bear market is indicated.
Click chart to enlarge.
Minute wave v must subdivide as a zigzag, and within it, minuette waves (a) and (b) are most likely now complete. Within minuette wave (c), subminuette waves i, ii and now iii may be complete. Subminuette wave iv may not move into subminuette wave i price territory below 2,074.28.
This alternate wave count requires more upwards movement, but along the way up subminuette wave iv should show up and it may complete one or two red candlesticks or doji at the daily chart level.
BEAR ELLIOTT WAVE COUNT
Click chart to enlarge.
The subdivisions within cycle waves a-b-c are seen in absolutely exactly the same way as primary waves 1-2-3 for the main wave count.
In line with recent Grand Super Cycle wave analysis, I have moved the degree of labelling for the bear wave count all up one degree.
This bear wave count expects a Super Cycle wave (c) to unfold downwards for a few years, and if it is a C wave it may be devastating. It may end well below 666.79.
However, if this wave down is a Super Cycle wave (y), then it may be a time consuming repeat of the last big flat correction with two market crashes within it, equivalent to the DotCom crash and the recent Global Financial Crisis, and it may take another 8-9 years to unfold sideways.
Within the new bear market, no second wave correction may move beyond the start of its first wave above 2,134.72.
TECHNICAL ANALYSIS
Click chart to enlarge.
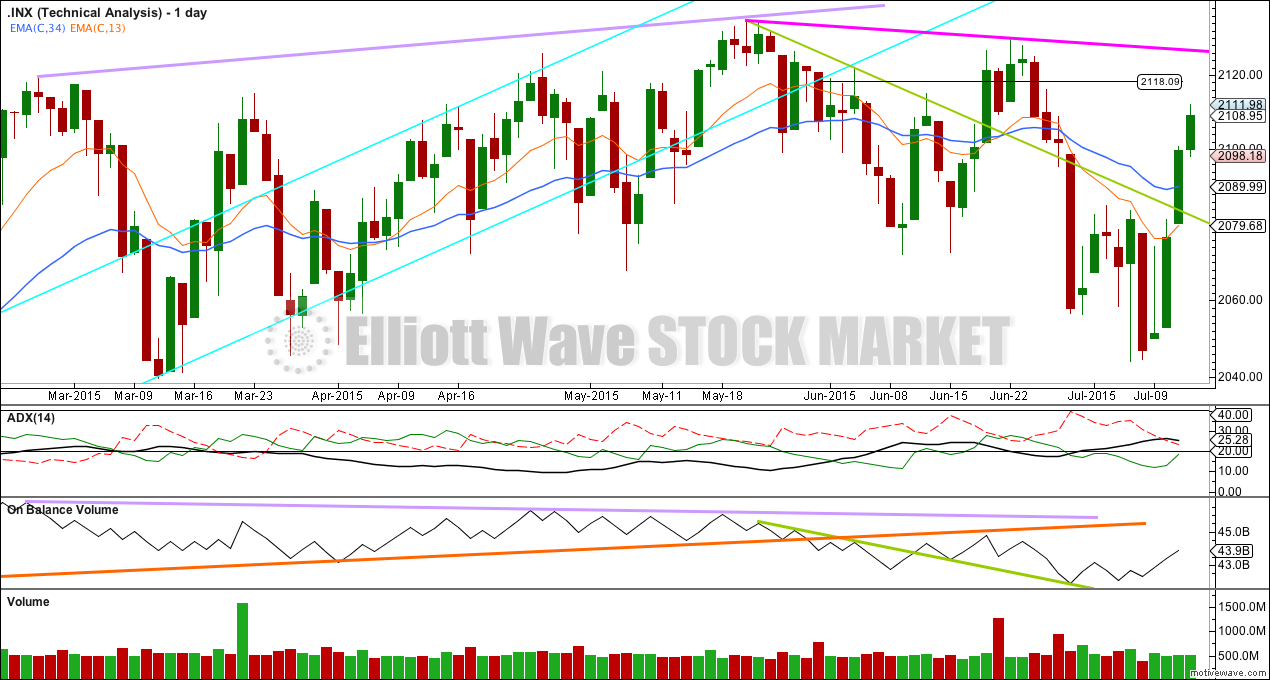
ADX is no longer completely clear. It remains above 20, but the ADX line is flattening off. Overall, a downwards trend is still indicated.
Volume is clearer. The last 10 days has seen overall declining volume. This rise in price is not supported by volume. Volume indicates that a correction against the trend may be unfolding.
On Balance Volume does agree with this price rise though. It is moving upwards with price.
At the last low, OBV showed some small bullish divergence and this current upwards movement may have now resolved that.
The shorter EMA is still below the longer EMA indicating a downward trend.
A note on Dow Theory: for the bear wave count I would wait for Dow Theory to confirm a huge market crash. For that to be confirmed the following new lows are needed:
S&P500: 1,820.66
Nasdaq: 4,116.60
DJT: 7,700.49
DJIA: 15,855.12
At this time DJT is closest, but none of these indices have made new major swing lows yet.
This analysis is published about 08:15 p.m. EST.