
Upwards movement was expected for Monday.
Summary: The first wave count expects upwards movement to end at 2,119 when price touches the upper edge of the channel on the hourly chart. The second wave count expects an upwards trend has resumed to new all time highs. A new high above 2,132.82 would strongly favour the second wave count.
Changes to last analysis are bold.
To see a weekly chart and how to draw trend lines click here.
Note regarding data for 28th July session: I am still unable to get the Google / Yahoo data feed to provide that candlestick; it remains MIA. For today’s analysis, I am relying on the candlestick on daily charts published here.
FIRST ELLIOTT WAVE COUNT
Click chart to enlarge.
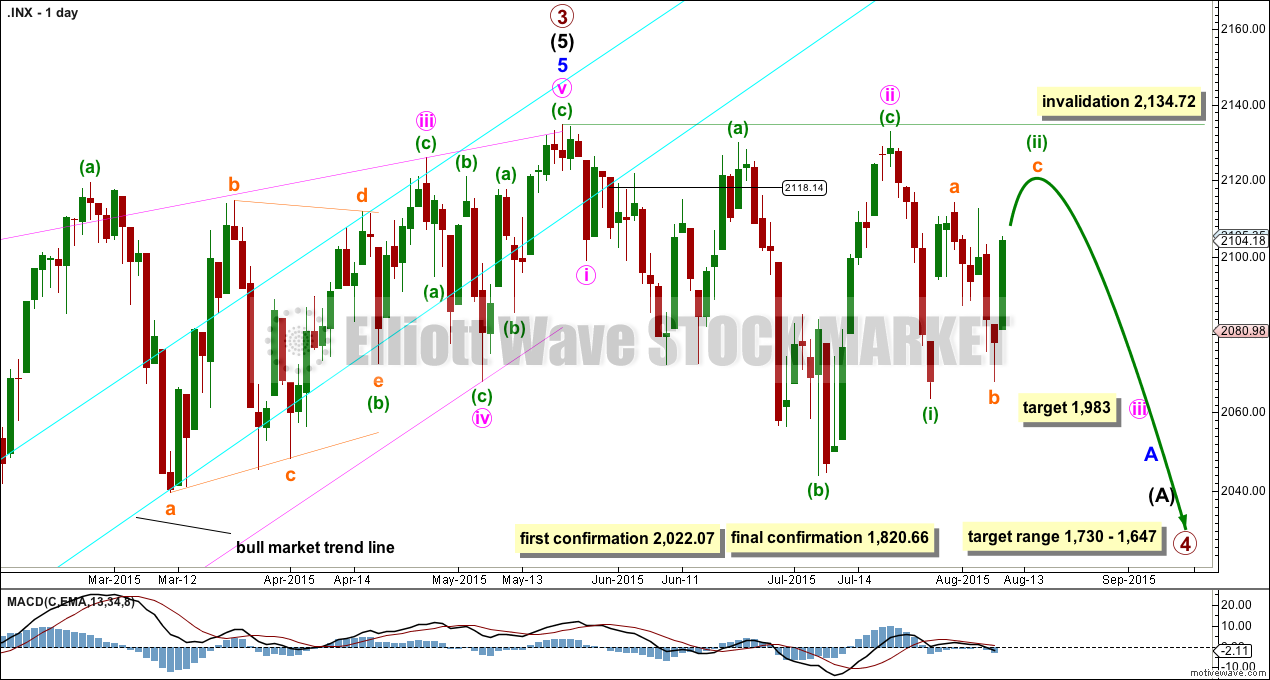
It is possible that the S&P has seen a primary degree (or for the bear count below a Super Cycle degree) trend change.
If primary wave 3 is over then primary wave 4 should begin.
Primary wave 2 was a relatively shallow 0.41 zigzag lasting 12 weeks. Primary wave 4 may be more shallow and is most likely to be a flat, combination or triangle. It may be longer lasting than primary wave 2 as these types of sideways corrective structures tend to be more time consuming than zigzags. Primary wave 4 is likely to end in the price territory of the fourth wave of one lesser degree between 1,730 – 1,647. It may last about 21 or maybe now even 34 weeks. So far it has completed its eleventh week.
This wave count now has some confirmation at the daily chart level with a close more than 3% of market value below the long held bull market trend line.
Further confirmation would come with:
1. A new low below 2,044.02.
2. A new low below 2,022.07 to invalidate the second wave count.
3. A clear five down on the hourly chart.
4. A clear five down on the daily chart.
5. A new low below 1,820.66.
6. A break below the 50 week SMA on the weekly chart or the 200 day SMA on the daily chart.
As each condition is met the probability of a substantial trend change would increase.
At this stage, a trend change is looking somewhat likely so I’ll list points in its favour:
1. The long held bull market trend line, the strongest piece of technical analysis on ALL charts, has been breached now by a close more than 3% of market value.
2. There is quadruple negative divergence between price and MACD on the weekly chart.
3. There is double negative divergence between price and MACD on the daily chart.
4. There is persistent and strong negative divergence between price and RSI on the monthly chart. The last time this happened was October 2007 and we all know what happened after that…
5. A long held bull trend line on On Balance Volume going back to October 2014 has been breached, is no longer providing support, and is now providing resistance.
6. DJT has recently failed to confirm the continuation of a bull market. This does not indicate a bear market, but does indicate caution.
At 1,983 minute wave iii would reach 4.236 the length of minute wave i. This is the ratio I am using for this target because minute wave i was short and minute wave ii was deep.
Minute wave iii should show its subdivisions clearly on the daily chart so that when it is done it has a clear five wave impulse look to it. So far minuette wave (ii) shows up clearly. When it arrives minuette wave (iv) should also show up clearly. Minuette wave (iii) should show a strong increase in downwards momentum.
Click chart to enlarge.
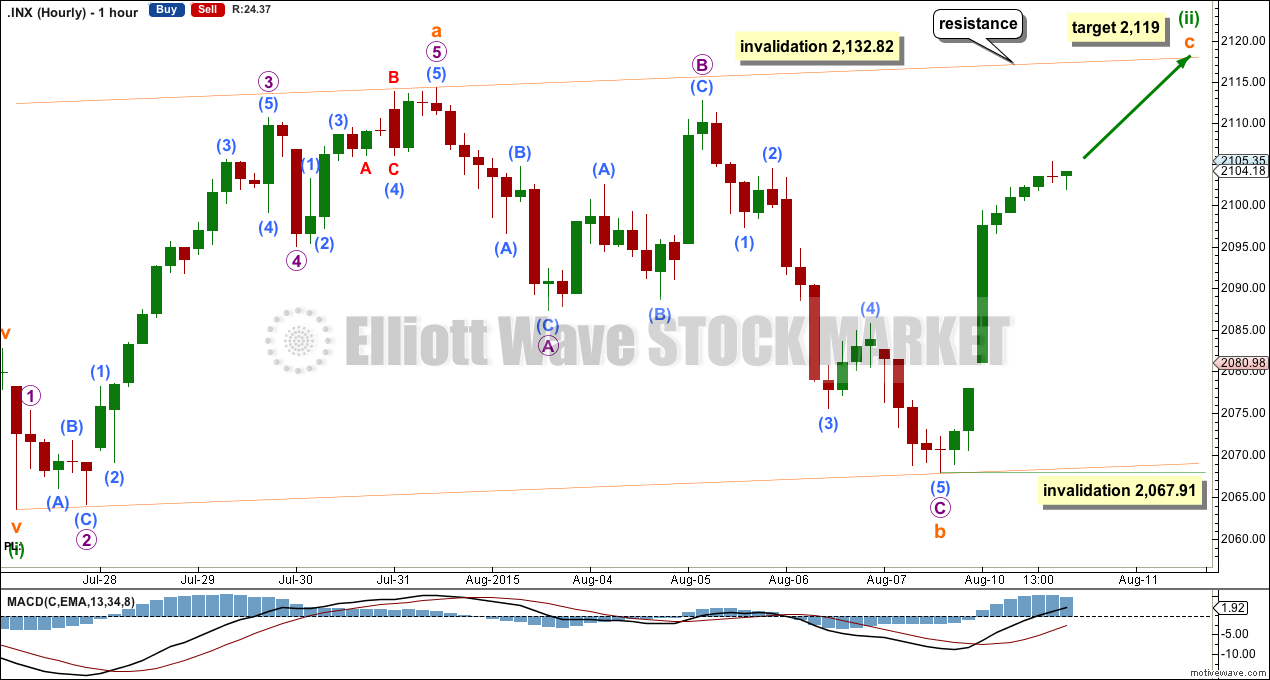
At 2,119 subminuette wave c would reach equality in length with subminuette wave a. Subminuette wave c may end when price touches the upper parallel channel drawn about this zigzag. The channel looks correct: it was touched twice at the lower edge and twice at the upper edge.
Subminuette wave c must subdivide as a five wave structure. If it continues for three more days, then minuette wave (ii) may take a total Fibonacci thirteen days to complete.
Subminuette wave c is very likely to make a new high above the end of subminuette wave a at 2,114.24 to avoid a truncation.
Minuette wave (ii) may not move beyond the start of minuette wave (i) above 2,132.82.
If price breaks above 2,132.82 this week, then at the daily chart level this first wave count would expect that minute wave ii is continuing sideways. The final invalidation point would be at 2,134.72.
Within subminuette wave c, it is possible that only the first wave completed on Monday, but that would see a very long extended first wave. It is also possible that the first, second and third waves within an impulse are complete. A final fifth wave up may take its time, maybe to last three days.
If a second wave correction is yet to unfold on the way up, then it may not move beyond the start of the first wave at 2,067.91.
SECOND ELLIOTT WAVE COUNT
Click chart to enlarge.
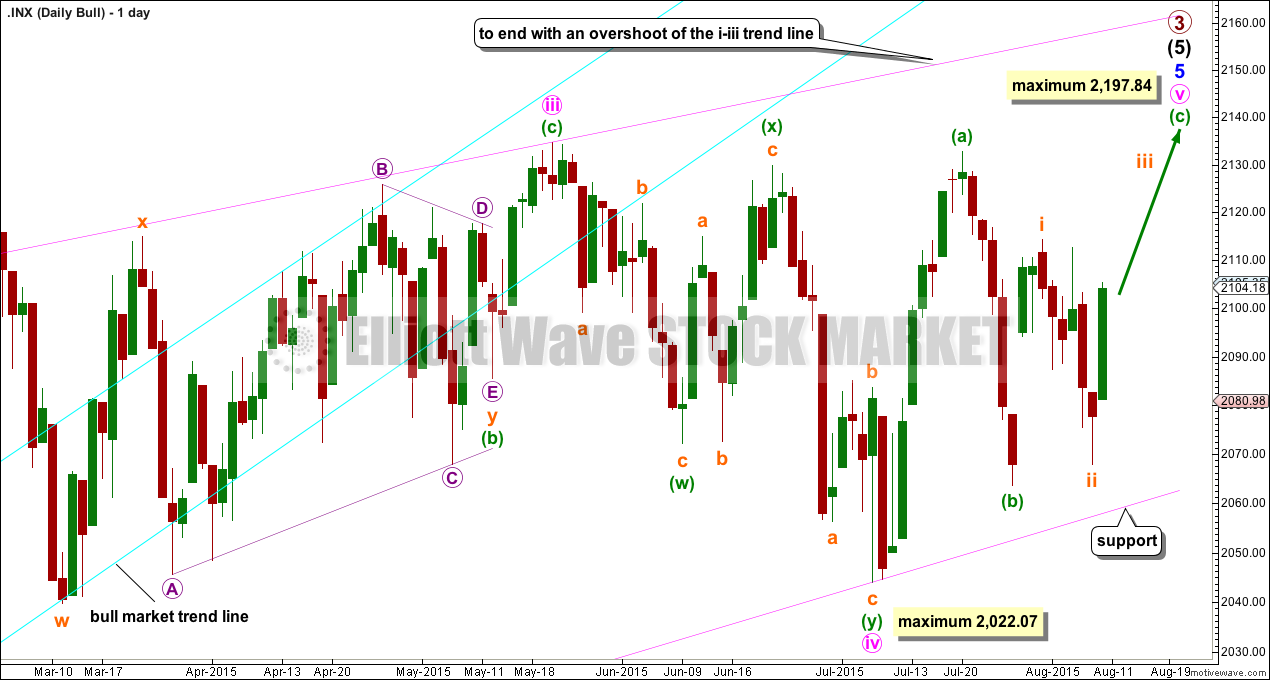
The ending contracting diagonal may still be incomplete. Ending diagonals require all sub waves to subdivide as zigzags, and the fourth wave should overlap first wave price territory. It is Elliott wave convention to always draw the diagonal trend lines to indicate a diagonal structure is expected.
My labelling here of minute wave iv within the diagonal as a double zigzag relies upon the interpretation of “double and triple zigzags take the place of zigzags” (“Elliott Wave Principle” by Frost and Prechter, 10th edition, page 91) to be true for zigzags within diagonals. This wave down may also be labelled as a single zigzag, but that does not have as neat a fit as a double zigzag.
The diagonal trend lines are not as clearly converging as they are for the first wave count. This reduces the probability of this wave count.
If it moves any lower, then minute wave iv may not be longer than equality in length with minute wave ii at 2,022.07. If it is over here, then minute wave v up also has a limit and may not be longer than equality with minute wave iii at 2,197.84.
The best way to see where and when upwards movement may end is the upper diagonal i-iii trend line. It is very likely to be overshot.
Click chart to enlarge.
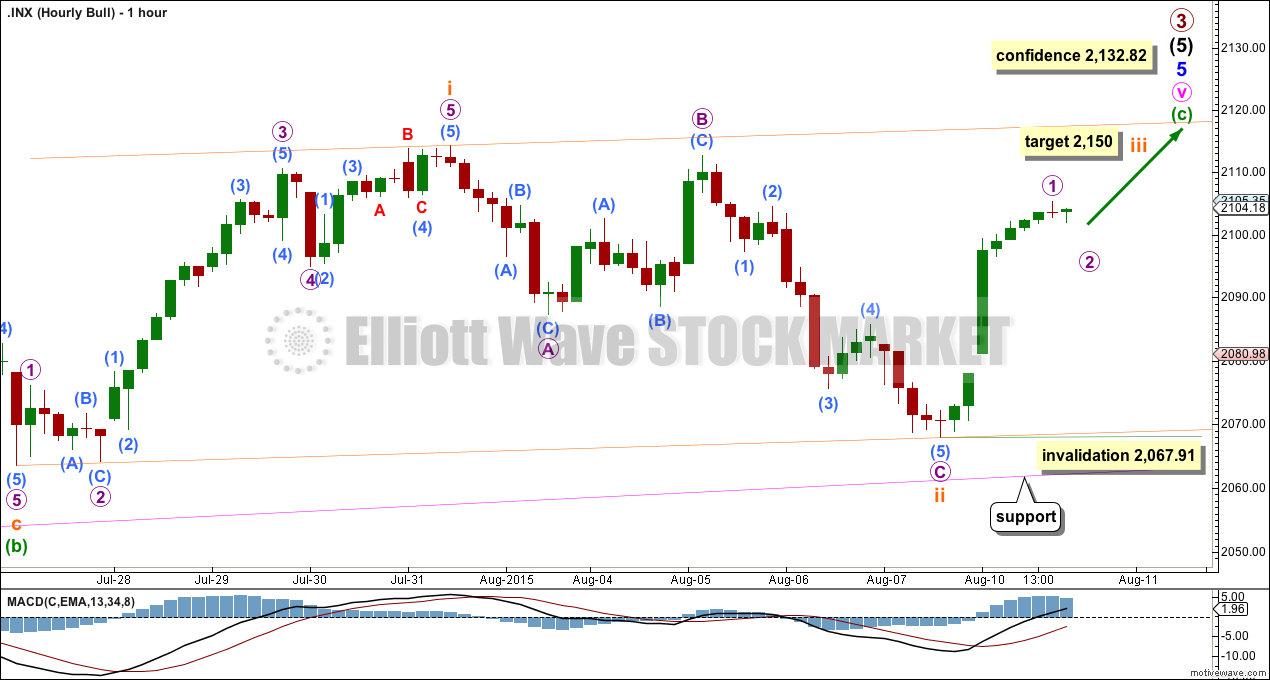
A-B-C of a zigzag and 1-2-3 of an impulse both subdivide 5-3-5. There is no divergence in the short term between these two wave counts.
Subminuette wave iii must move price beyond the end of subminuette wave i above 2,114.24. After that a new high above 2,132.82 would invalidate the first wave count at the hourly chart level and confirm this second wave count.
At 2,150 subminuette wave iii would reach 1.618 the length of subminuette wave i. Subminuette wave iii may only subdivide as an impulse, and should show an increase in momentum beyond that seen for subminuette wave i.
Within subminuette wave iii, only micro wave 1 may have completed on Monday. Micro wave 2 may not move beyond the start of micro wave 1 below 2,067.91.
BEAR ELLIOTT WAVE COUNT
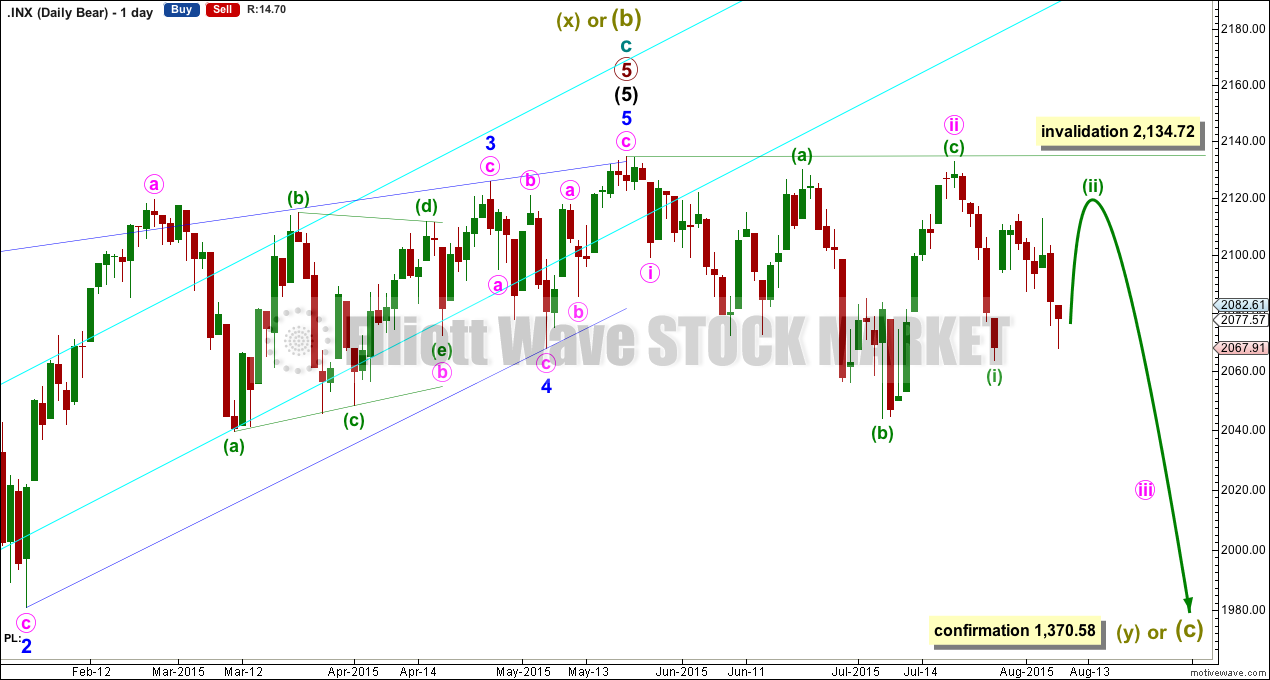
Click chart to enlarge.
The subdivisions within cycle waves a-b-c are seen in absolutely exactly the same way as primary waves 1-2-3 for the main wave count.
In line with recent Grand Super Cycle wave analysis, I have moved the degree of labelling for the bear wave count all up one degree.
This bear wave count expects a Super Cycle wave (c) to unfold downwards for a few years, and if it is a C wave it may be devastating. It may end well below 666.79.
However, if this wave down is a Super Cycle wave (y), then it may be a time consuming repeat of the last big flat correction with two market crashes within it, equivalent to the DotCom crash and the recent Global Financial Crisis, and it may take another 8-9 years to unfold sideways.
Within the new bear market, no second wave correction may move beyond the start of its first wave above 2,134.72.
The second wave count above works in the same way for this bear wave count.
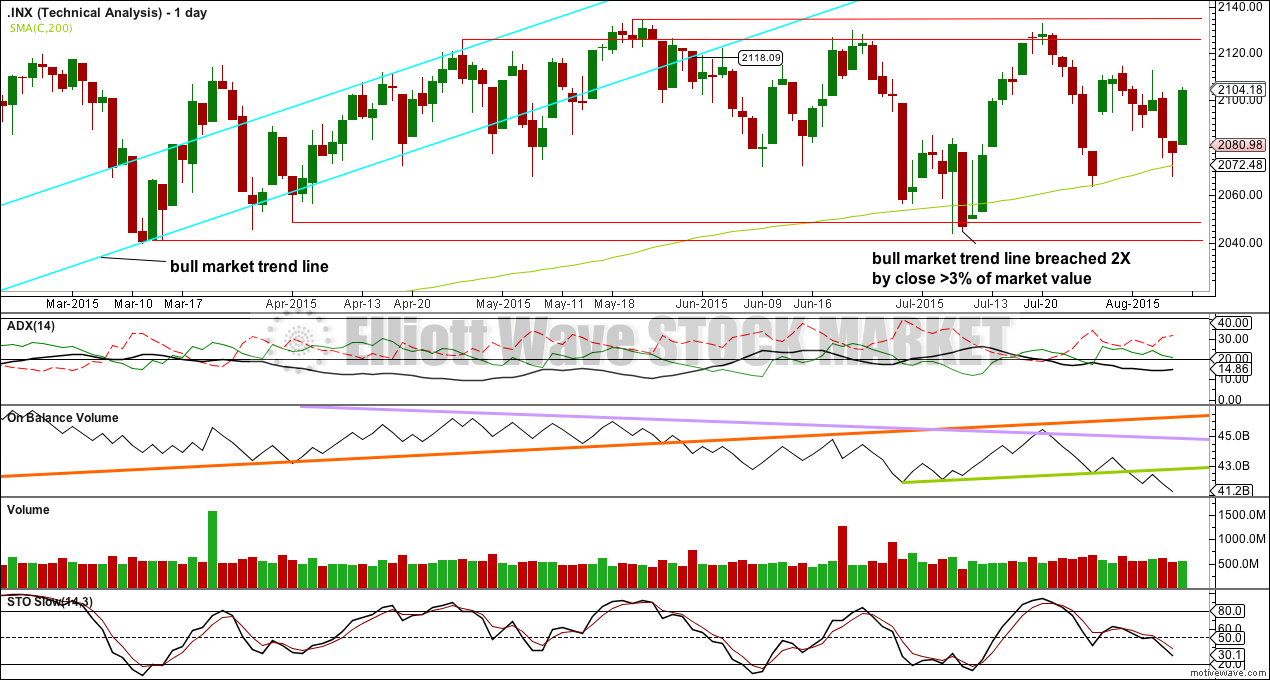
TECHNICAL ANALYSIS
Click chart to enlarge.
ADX is below 15, almost flat, and no clear trend is yet indicated. The market is still range bound.
A range bound trading system may be better used than a trend following system. This would still expect some more downwards movement, to not end until price finds support at the lower two red horizontal trend lines and Stochastics is oversold at the same time, or to end when price finds support at the 200 day DMA and Stochastics is oversold at the same time. The 200 day SMA has been slightly overshot. Because Stochastics has not yet reached oversold, more downwards movement would still be expected from this approach until it is. But it looks now like price may not be able to get down to the lower support trend lines as it may be held up by the 200 day SMA.
Price may continue to find support about the 200 day SMA. On Balance Volume has now moved below its short green trend line which provided resistance. There is now room for the market to move up, and it may bounce up from here due to support at the SMA and continue until OBV provides resistance.
While the range bound trading approach would expect more downwards movement until Stochastics reaches oversold, price does not usually move up and down in a straight line; there are corrections along the way. This analysis would expect some upwards movement from here to be a counter movement to the downwards swing which is incomplete.
I would not expect upwards movement to end this short counter swing movement until OBV touches its short green trend line, using this approach.
A note on Dow Theory: for the bear wave count I would wait for Dow Theory to confirm a huge market crash. For that to be confirmed the following new lows are needed:
S&P500: 1,820.66
Nasdaq: 4,116.60
DJT: 7,700.49
DJIA: 15,855.12
At this time DJT is closest, but none of these indices have made new major swing lows yet.
This analysis is published about 08:11 p.m. EST.
It would appear the perpetually elusive third wave down is finally here. Hope no one got ensnared by yesterday’s bull trap.
Could it not just be a deep micro 2 second wave correction verne ?
It seems to have just about closed the gap in the chart at just below the 0.618 re-trace level.
It certainly could as Lara’s invalidation point not yet breached. If it is, I would expect much of the decline today to be re-traced by market’s close and a monster third wave up starting tomorrow. UVXY is the canary in the coal mine and will turn negative at day’s end if that is what’s happening.
World markets are also tanking though so this could be the start of something big.
Late action looking like some sort of triangle. We will probably see a thrust before final move down and a corrective bounce. If this is a third wave down the party is just getting started as nothing really convincing about today’s down move in my opinion
VIX not acting like just prior to a third wave up. Love the miners!