
A little upwards movement was expected, but did not happen.
Summary: For the short term, both wave counts expect downwards movement to 2,070 – 2,069 to be followed by upwards movement to at least above 2,114.24. How high the next wave goes may tell which wave count is correct. Regular technical analysis, specifically support from the 200 day SMA, favours the second wave count.
Changes to last analysis are bold.
To see a weekly chart and how to draw trend lines click here.
Note regarding data for 28th July session: I am still unable to get the Google / Yahoo data feed to provide that candlestick; it remains MIA. For today’s analysis, I am relying on the candlestick on daily charts published here.
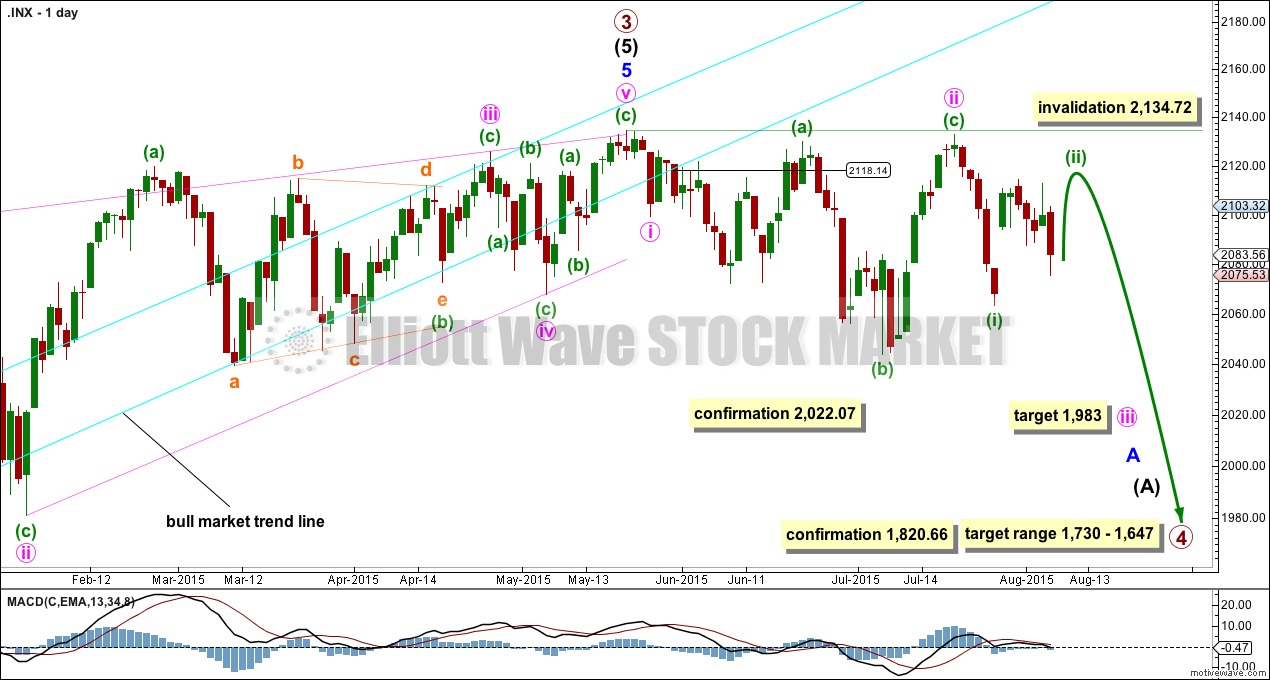
FIRST ELLIOTT WAVE COUNT
Click chart to enlarge.
It is possible that the S&P has seen a primary degree (or for the bear count below a Super Cycle degree) trend change.
If primary wave 3 is over then primary wave 4 should begin.
Primary wave 2 was a relatively shallow 0.41 zigzag lasting 12 weeks. Primary wave 4 may be more shallow and is most likely to be a flat, combination or triangle. It may be longer lasting than primary wave 2 as these types of sideways corrective structures tend to be more time consuming than zigzags. Primary wave 4 is likely to end in the price territory of the fourth wave of one lesser degree between 1,730 – 1,647. It may last about 13 or maybe even 21 weeks. So far it has completed its tenth week.
This wave count now has some confirmation at the daily chart level with a close more than 3% of market value below the long held bull market trend line.
Further confirmation would come with:
1. A new low below 2,044.02.
2. A new low below 2,022.07 to invalidate the second wave count.
3. A clear five down on the hourly chart.
4. A clear five down on the daily chart.
5. A new low below 1,820.66.
6. A break below the 50 week SMA on the weekly chart or the 200 day SMA on the daily chart.
As each condition is met the probability of a substantial trend change would increase.
At this stage, a trend change is looking somewhat likely so I’ll list points in its favour:
1. The long held bull market trend line, the strongest piece of technical analysis on ALL charts, has been breached now by a close more than 3% of market value.
2. There is quadruple negative divergence between price and MACD on the weekly chart.
3. There is double negative divergence between price and MACD on the daily chart.
4. There is persistent and strong negative divergence between price and RSI on the monthly chart. The last time this happened was October 2007 and we all know what happened after that…
5. A long held bull trend line on On Balance Volume going back to October 2014 has been breached, is no longer providing support, and is now providing resistance.
6. DJT has recently failed to confirm the continuation of a bull market. This does not indicate a bear market, but does indicate caution.
At 1,983 minute wave iii would reach 4.236 the length of minute wave i. This is the ratio I am using for this target because minute wave i was short and minute wave ii was deep.
Minute wave iii should show its subdivisions clearly on the daily chart so that when it is done it has a clear five wave impulse look to it. So far minuette wave (ii) shows up clearly. When it arrives minuette wave (iv) should also show up clearly. Minuette wave (iii) should show a strong increase in downwards momentum.
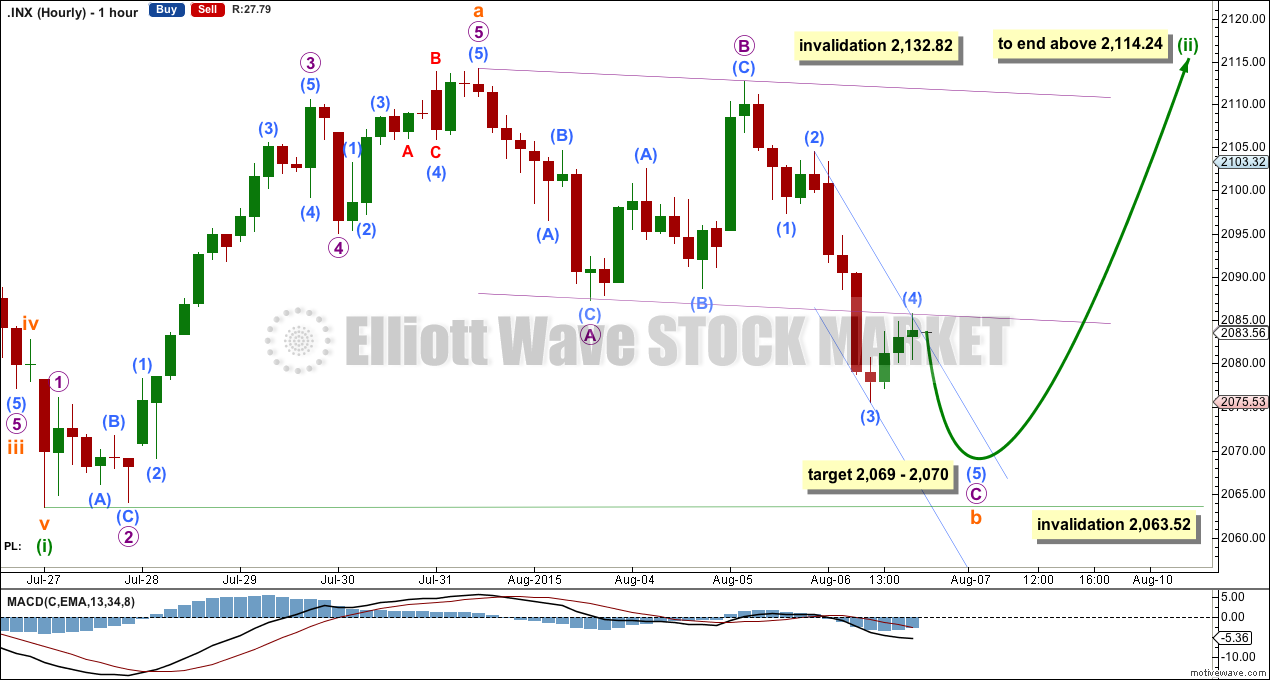
Click chart to enlarge.
At the hourly chart level, the structure looks a little clearer for the short term. Subminuette wave b looks like a flat correction.
Although it could also subdivide as a double zigzag and be complete at today’s low, that would include a very deep X wave. X waves within double zigzags are commonly shallow, so a flat correction is more likely.
At 2,069 micro wave C would reach 1.618 the length of micro wave A. At 2,070 submicro wave (5) would reach equality in length with submicro wave (1). This target should be met on Friday.
Subminuette wave b may not move beyond the start of subminuette wave a below 2,063.52.
Thereafter, a five wave structure upwards should unfold for subminuette wave c. Subminuette wave c is likely to move at least slightly above the end of subminuette wave a at 2,114.24 to avoid a truncation. It is most likely to reach equality with subminuette wave a, and be about 51 points in length.
Minuette wave (ii) may not move beyond the start of minuette wave (i) above 2,132.82.
SECOND ELLIOTT WAVE COUNT
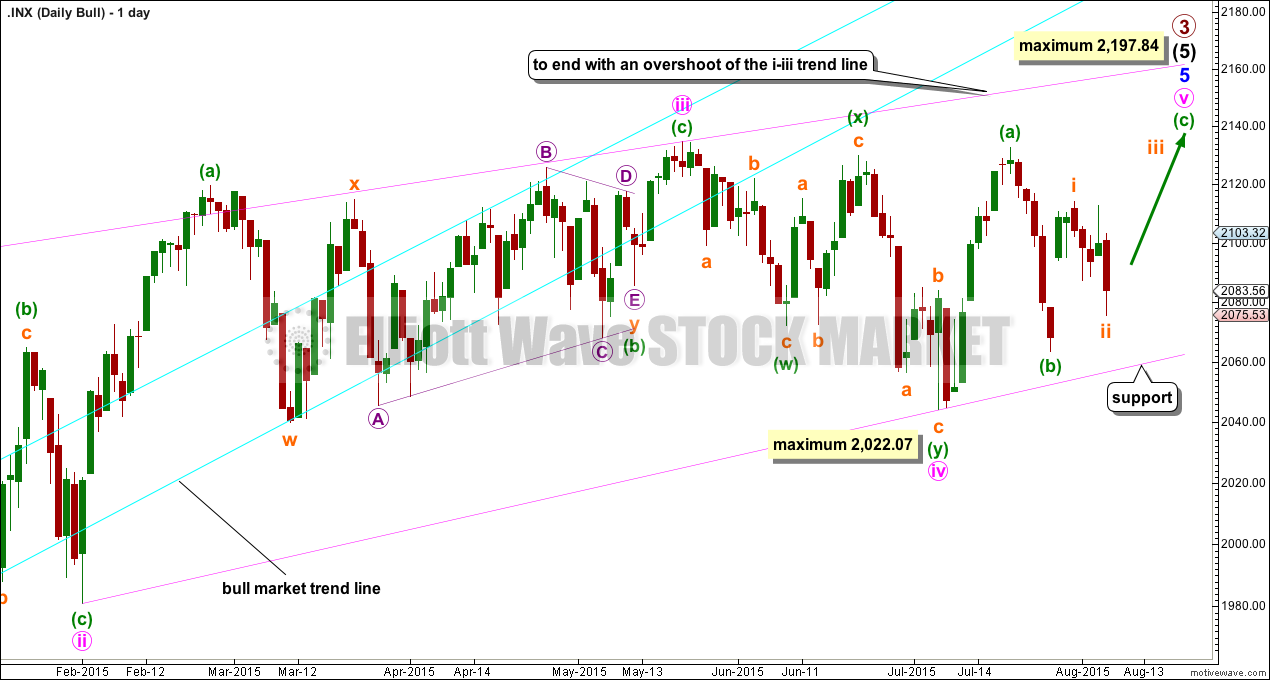
Click chart to enlarge.
The ending contracting diagonal may still be incomplete. Ending diagonals require all sub waves to subdivide as zigzags, and the fourth wave should overlap first wave price territory. It is Elliott wave convention to always draw the diagonal trend lines to indicate a diagonal structure is expected.
My labelling here of minute wave iv within the diagonal as a double zigzag relies upon the interpretation of “double and triple zigzags take the place of zigzags” (“Elliott Wave Principle” by Frost and Prechter, 10th edition, page 91) to be true for zigzags within diagonals. This wave down may also be labelled as a single zigzag, but that does not have as neat a fit as a double zigzag.
The diagonal trend lines are no longer clearly converging. This reduces the probability of this wave count.
If it moves any lower, then minute wave iv may not be longer than equality in length with minute wave ii at 2,022.07. If it is over here, then minute wave v up also has a limit and may not be longer than equality with minute wave iii at 2,197.84.
The best way to see where and when upwards movement may end is the upper diagonal i-iii trend line. It is very likely to be overshot.
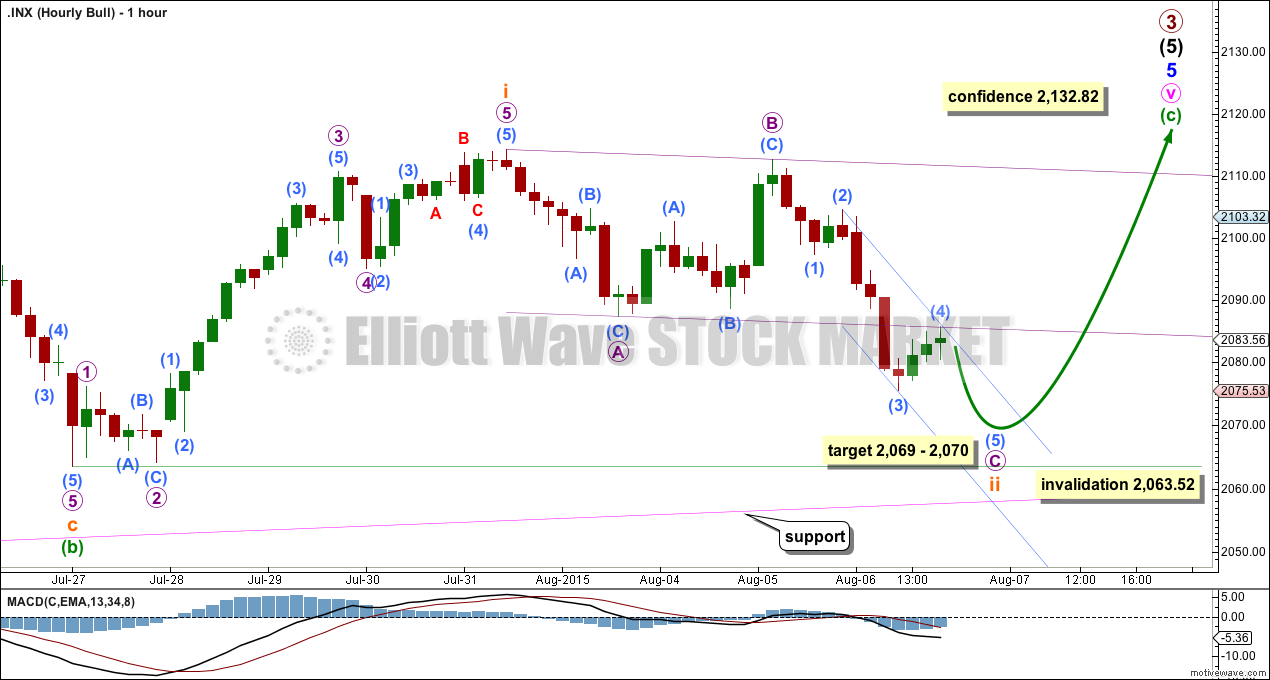
Click chart to enlarge.
A-B-C of a zigzag and 1-2-3 of an impulse both subdivide 5-3-5. There is no divergence in the short term between these two wave counts.
When subminuette wave ii is over, then subminuette wave iii must move price beyond the end of subminuette wave i above 2,114.24. After that a new high above 2,132.82 would invalidate the first wave count at the hourly chart level and confirm this second wave count.
BEAR ELLIOTT WAVE COUNT
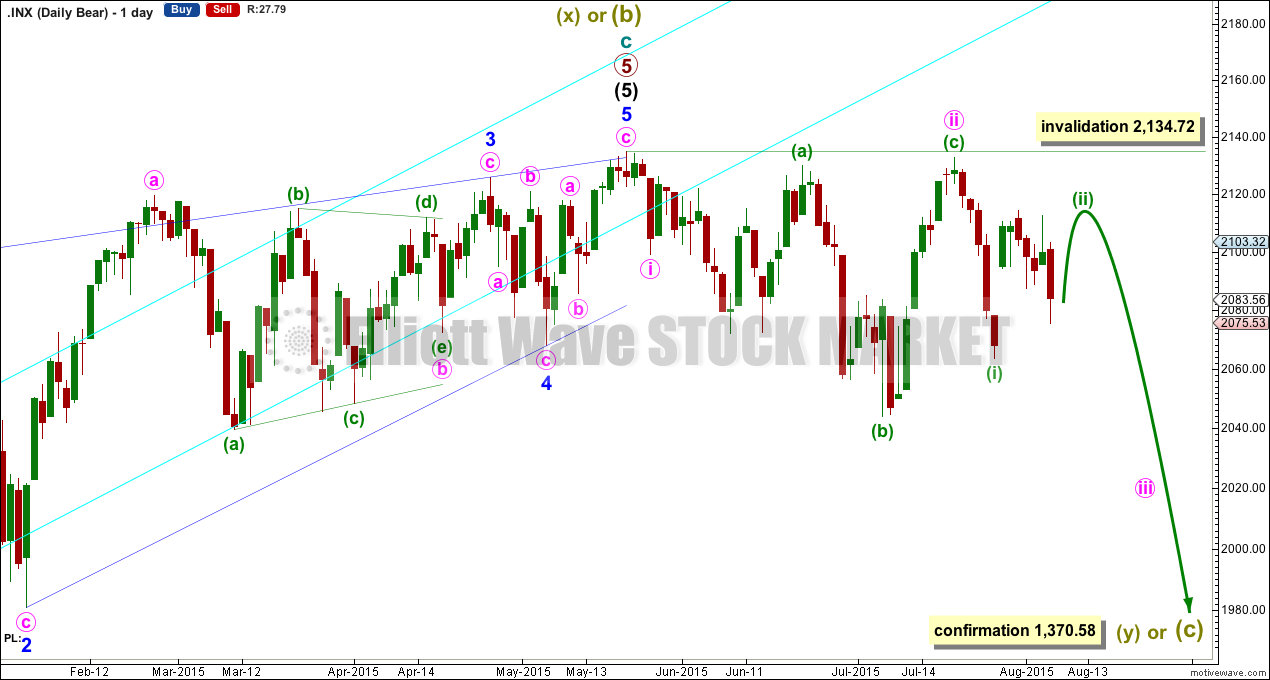
Click chart to enlarge.
The subdivisions within cycle waves a-b-c are seen in absolutely exactly the same way as primary waves 1-2-3 for the main wave count.
In line with recent Grand Super Cycle wave analysis, I have moved the degree of labelling for the bear wave count all up one degree.
This bear wave count expects a Super Cycle wave (c) to unfold downwards for a few years, and if it is a C wave it may be devastating. It may end well below 666.79.
However, if this wave down is a Super Cycle wave (y), then it may be a time consuming repeat of the last big flat correction with two market crashes within it, equivalent to the DotCom crash and the recent Global Financial Crisis, and it may take another 8-9 years to unfold sideways.
Within the new bear market, no second wave correction may move beyond the start of its first wave above 2,134.72.
The second wave count above works in the same way for this bear wave count.
TECHNICAL ANALYSIS
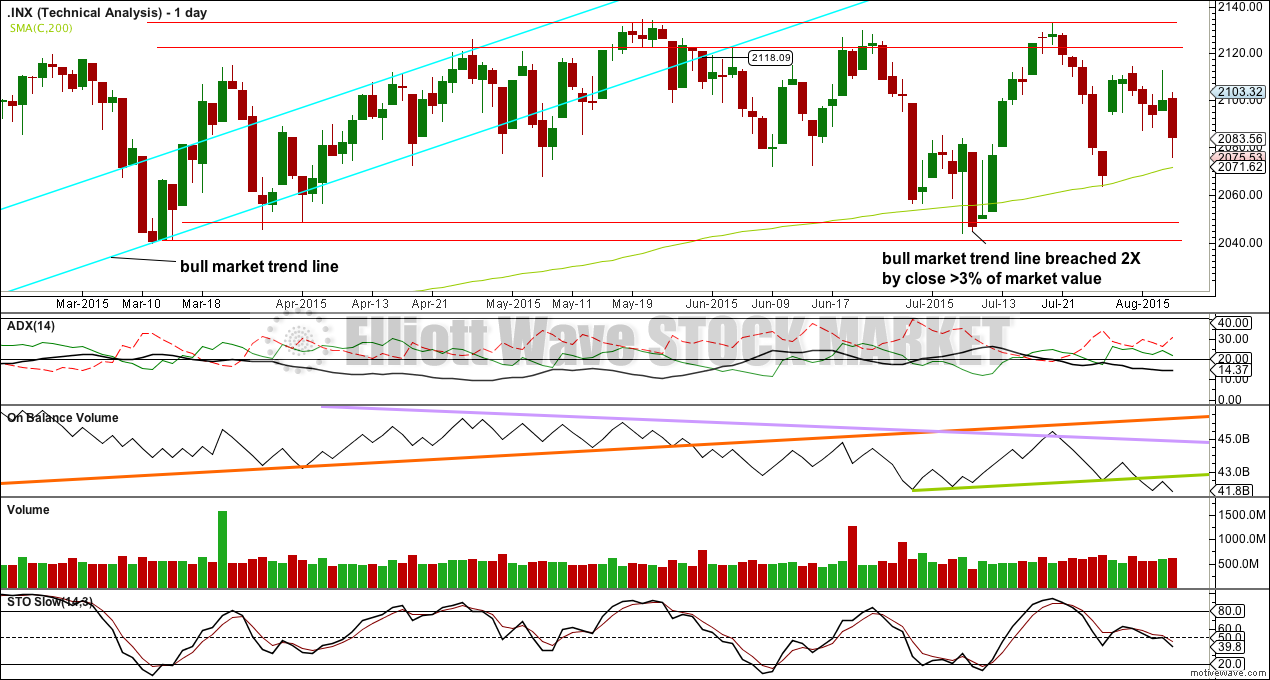
Click chart to enlarge.
ADX is below 20 and flat to declining. ADX indicates there is no clear trend and the market is consolidating.
A range bound trading system may be better used than a trend following system. This would still expect some more downwards movement, to not end until price finds support at the lower two red horizontal trend lines and Stochastics is oversold at the same time, or to end when price finds support at the 200 day DMA and Stochastics is oversold at the same time. The 200 day SMA has almost been reached; it may be overshot. Because Stochastics has not yet reached oversold, more downwards movement would still be expected from this approach until it is. But it looks now like price may not be able to get down to the lower support trend lines as it may be held up by the 200 day SMA.
Price may find some support at the 200 day SMA while On Balance Volume is finding resistance at its short green trend line. These two indicators are pushing in opposite directions, so one of them will have to give. The 200 day SMA has been held for longer, and is more technically significant. This favours the second wave count. A breach of the short green trend line on OBV would indicate the second wave count is more likely.
A breach of the 200 day SMA would favour the first wave count.
A note on Dow Theory: for the bear wave count I would wait for Dow Theory to confirm a huge market crash. For that to be confirmed the following new lows are needed:
S&P500: 1,820.66
Nasdaq: 4,116.60
DJT: 7,700.49
DJIA: 15,855.12
At this time DJT is closest, but none of these indices have made new major swing lows yet.
This analysis is published about 09:54 p.m. EST.
First wave count should show a hammer at end of today’s action. If we are about to see a third wave up, I would expect to see a bullish engulfing candlestick today for the second wave count. Either way, hedging my long position UVXY going into week-end by selling calls…
Did anybody buy at the 52 week lows?
We do have a hammer, and it does come at the end of a small downswing. But I wouldn’t go so far as to say that favours the second wave count over the first.
Actually I was thinking the opposite, that it might favor the first count. I expected for a third wave up we would see more bullishness at the end of the move down. I guess we will have to wait and see what develops next week I expect the futures for Monday will be uber bullish whatever the correct count.
Have a terrific weekend everybody!
You’re right, sorry. I didn’t read your comment carefully enough.