
A sideways day which did not manage to make a new high fits both Elliott wave counts.
Summary: A new low now below 2,063.52 would be earliest price confirmation that upwards movement is over, and downwards momentum may then be expected to build. A new high above 2,132.82 would indicate this upwards movement should make new all time highs, and the target for it to end is at 2,152. In the short term both wave counts expect a little more upwards movement tomorrow to either 2,115 or 2,117 – 2,121, to then be followed by some downwards movement. How low the next wave goes, how it subdivides, and how strong it is may tell us which wave count is correct before price confirmation.
Changes to last analysis are bold.
To see a weekly chart and how to draw trend lines click here.
Note regarding data for Tuesday’s session: I am still unable to get the Google / Yahoo data feed to provide a candlestick for Tuesday. For today’s analysis, I am relying on the candlestick on Tuesday’s chart for Tuesday’s candlestick.
FIRST ELLIOTT WAVE COUNT
Click chart to enlarge.
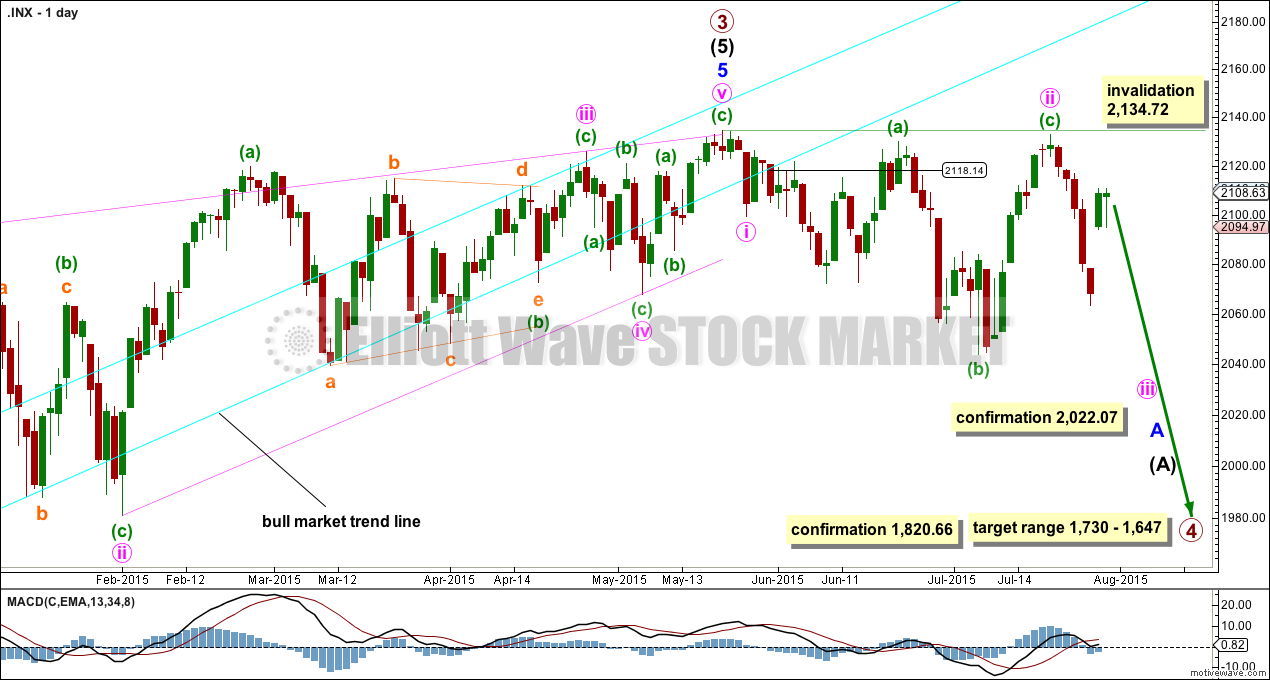
It is possible that the S&P has seen a primary degree (or for the bear count below a Super Cycle degree) trend change.
This wave count now has some confirmation at the daily chart level with a close more than 3% of market value below the long held bull market trend line.
Further confirmation would come with:
1. A new low below 2,044.02.
2. A new low below 2,022.07 to invalidate the alternate wave count.
3. A clear five down on the hourly chart.
4. A clear five down on the daily chart.
5. A new low below 1,820.66.
6. A break below the 50 week SMA on the weekly chart or the 200 day SMA on the daily chart.
As each condition is met the probability of a substantial trend change would increase.
At this stage, a trend change is looking somewhat likely so I’ll list points in its favour:
1. The long held bull market trend line, the strongest piece of technical analysis on ALL charts, has been breached now by a close more than 3% of market value.
2. There is quadruple negative divergence between price and MACD on the weekly chart.
3. There is double negative divergence between price and MACD on the daily chart.
4. There is persistent and strong negative divergence between price and RSI on the monthly chart. The last time this happened was October 2007 and we all know what happened after that…
5. A long held bull trend line on On Balance Volume going back to October 2014 has been breached, is no longer providing support, and is now providing resistance.
6. DJT has recently failed to confirm the continuation of a bull market. This does not indicate a bear market, but does indicate caution.
Primary wave 4 would be likely to end within the price territory of the fourth wave of one lesser degree: intermediate wave (4) has its price territory from 1,730 to 1,647.
Primary wave 4 would be likely to exhibit alternation to primary wave 2. Primary wave 2 was a 0.41 zigzag correction lasting 12 weeks, one short of a Fibonacci 13. Primary wave 4 may be more shallow than the 0.382 Fibonacci ratio, and may be a flat, combination or triangle, which are more time consuming structures than zigzags so it should be longer in duration than primary wave 2. Primary wave 4 may last a Fibonacci 21 weeks in total, 1.618 the duration of primary wave 2.
Click chart to enlarge.
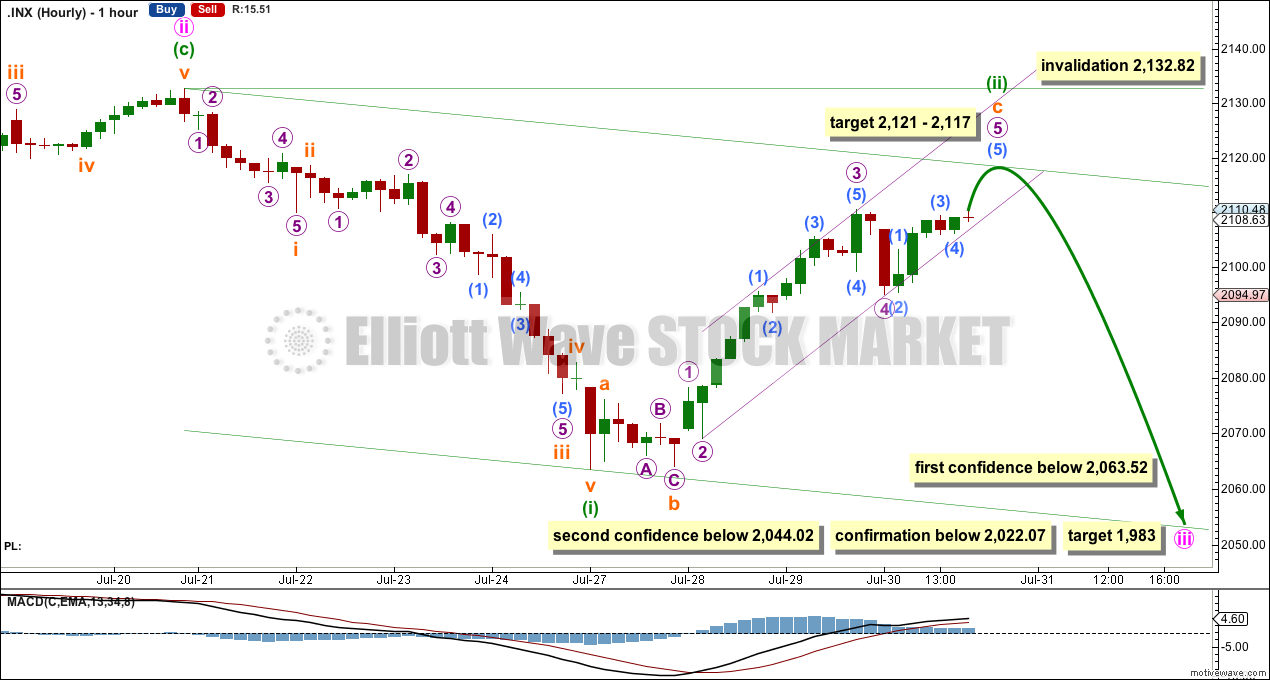
Minuette wave (ii) will most likely end a little higher tomorrow,. The last piece of downwards movement labelled micro wave 4 fits best on the five minute chart as a three, and upwards movement to end Thursday’s session looks like a five.
At 2,121 micro wave 5 would reach 0.618 the length of micro wave 3. At 2,117 subminuette wave c would reach 4.236 the length of subminuette wave i. This gives a 4 point target zone calculated at two wave degrees, so it has a reasonable probability.
A clear breach of the upwards sloping violet channel about minuette wave (ii) would provide trend channel confirmation that minuette wave (ii) is over and minuette wave (iii) downwards should then have begun. At that stage, redraw the base channel (green) as shown and use the upper edge as a guide to where price should find resistance along the way down.
A new low below 2,063.52 is now required for earliest price confirmation that minuette wave (iii) is underway. We may have some clarity before price passes that point, if the downwards movement subdivides as a five, not a three, and shows an increase in downwards momentum.
Minuette wave (iii) may only subdivide as a five wave impulse, and should show an increase in downwards momentum beyond that seen for minuette wave (i).
Minuette wave (ii) may not move beyond the start of minuette wave (i) above 2,132.82.
SECOND ELLIOTT WAVE COUNT
Click chart to enlarge.
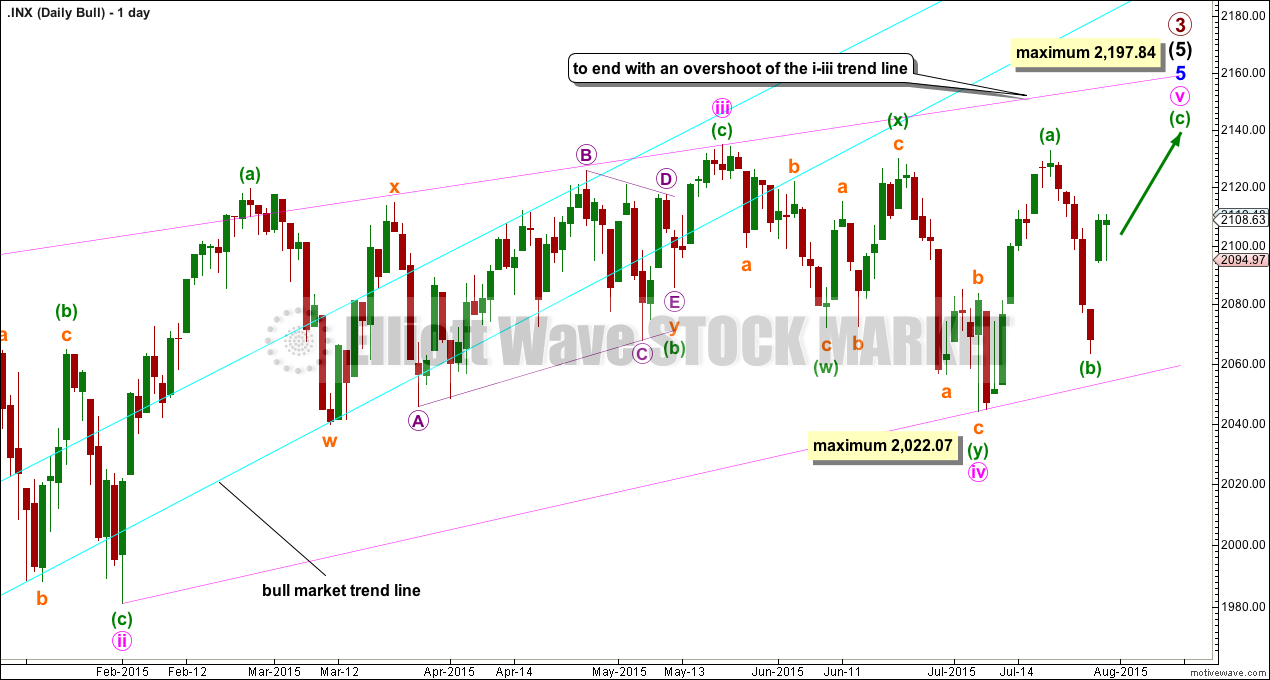
The ending contracting diagonal may still be incomplete. Ending diagonals require all sub waves to subdivide as zigzags, and the fourth wave should overlap first wave price territory. It is Elliott wave convention to always draw the diagonal trend lines to indicate a diagonal structure is expected.
My labelling here of minute wave iv within the diagonal as a double zigzag relies upon the interpretation of “double and triple zigzags take the place of zigzags” (“Elliott Wave Principle” by Frost and Prechter, 10th edition, page 91) to be true for zigzags within diagonals. This wave down may also be labelled as a single zigzag, but that does not have as neat a fit as a double zigzag.
The diagonal trend lines are no longer clearly converging. This reduces the probability of this wave count.
If it moves any lower, then minute wave iv may not be longer than equality in length with minute wave ii at 2,022.07. If it is over here, then minute wave v up also has a limit and may not be longer than equality with minute wave iii at 2,197.84.
The best way to see where and when upwards movement may end is the upper diagonal i-iii trend line. It is very likely to be overshot. Upwards movement may find resistance at the long held bull market trend line.
Click chart to enlarge.
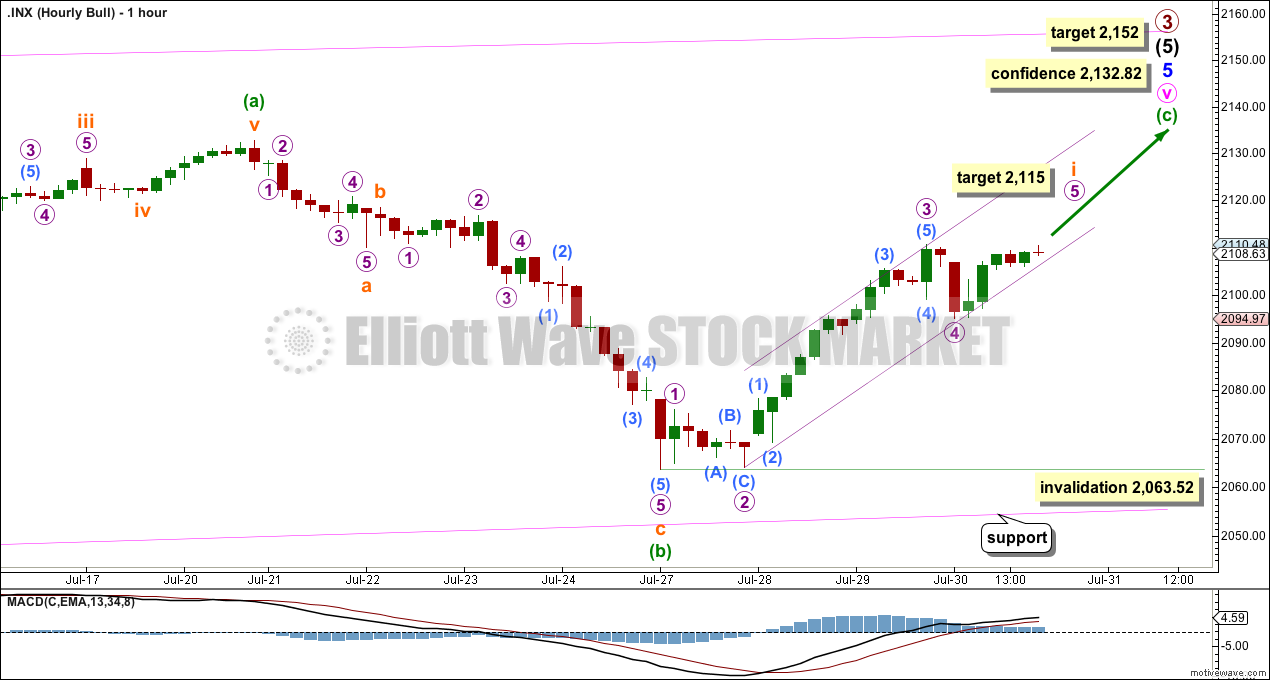
This second wave count sees the downwards movement as a three (the first wave count sees it as a five). Sometimes waves are ambiguous and not possible to tell with certainty which structure they are.
Minuette wave (c) upwards may only subdivide as an ending diagonal or an impulse. It is highly unusual for an ending diagonal to complete an ending diagonal, so an impulse for minuette wave (c) is much more likely.
I am moving the degree of labelling within minuette wave (c) all down one degree today. The S&P 500 does not often exhibit extended fifth waves, the extension is almost always within the third wave, and so I do not think that subminuette waves iii and iv are yet over. It looks now more likely that subminuette wave i only is coming to an end.
Within subminuette wave i, there is no Fibonacci ratio between micro waves 1 and 3. This means it is more likely that micro wave 5 will exhibit a Fibonacci ratio to either of micro waves 1 or 3. If it were to reach equality in length with micro wave 1, then it would be truncated. The next likely ratio would be 1.618 the length of micro wave 1 at 2,115.
When subminuette wave i is a complete five wave impulse and the lower edge of the trend channel is breached, then draw a Fibonacci retracement along its length. Look for the 0.382 and more likely 0.618 Fibonacci ratios as targets for subminuette wave ii down.
Subminuette wave ii must subdivide as a corrective structure, a three. It is most likely to be a deep correction.
How the next wave down unfolds (its structure and momentum) should give us clues as to which wave count is most likely correct.
BEAR ELLIOTT WAVE COUNT
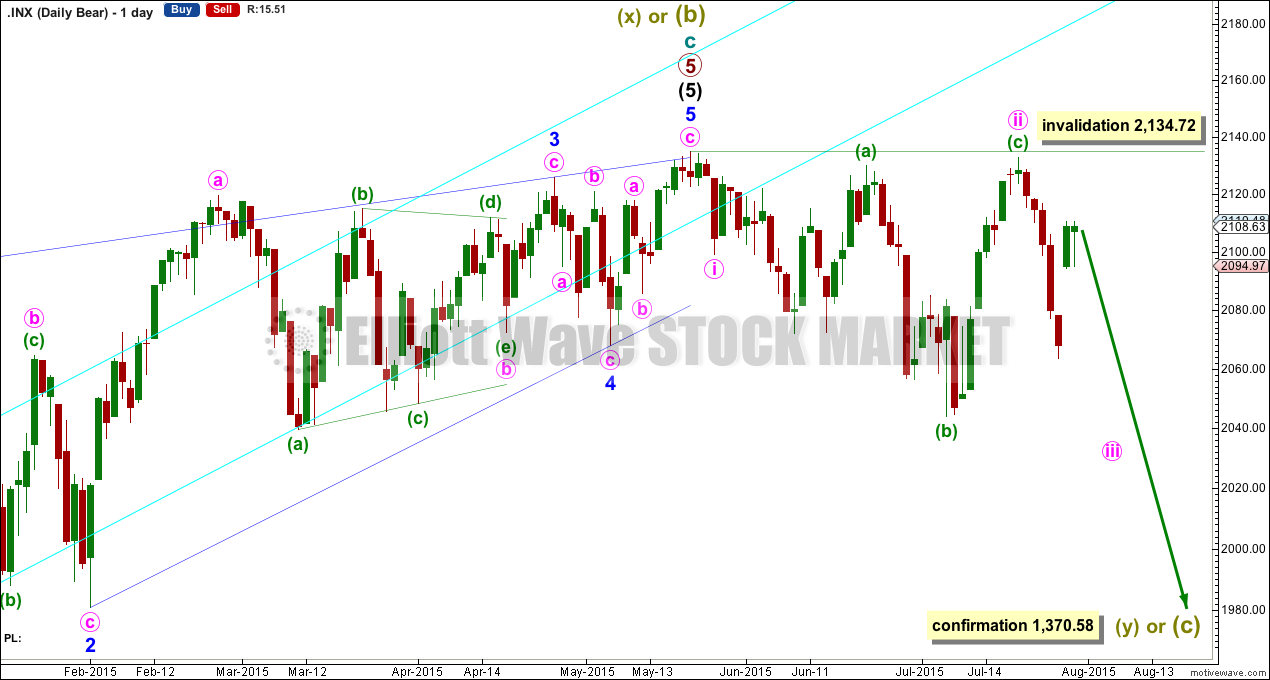
Click chart to enlarge.
The subdivisions within cycle waves a-b-c are seen in absolutely exactly the same way as primary waves 1-2-3 for the main wave count.
In line with recent Grand Super Cycle wave analysis, I have moved the degree of labelling for the bear wave count all up one degree.
This bear wave count expects a Super Cycle wave (c) to unfold downwards for a few years, and if it is a C wave it may be devastating. It may end well below 666.79.
However, if this wave down is a Super Cycle wave (y), then it may be a time consuming repeat of the last big flat correction with two market crashes within it, equivalent to the DotCom crash and the recent Global Financial Crisis, and it may take another 8-9 years to unfold sideways.
Within the new bear market, no second wave correction may move beyond the start of its first wave above 2,134.72.
The second wave count above works in the same way for this bear wave count.
TECHNICAL ANALYSIS
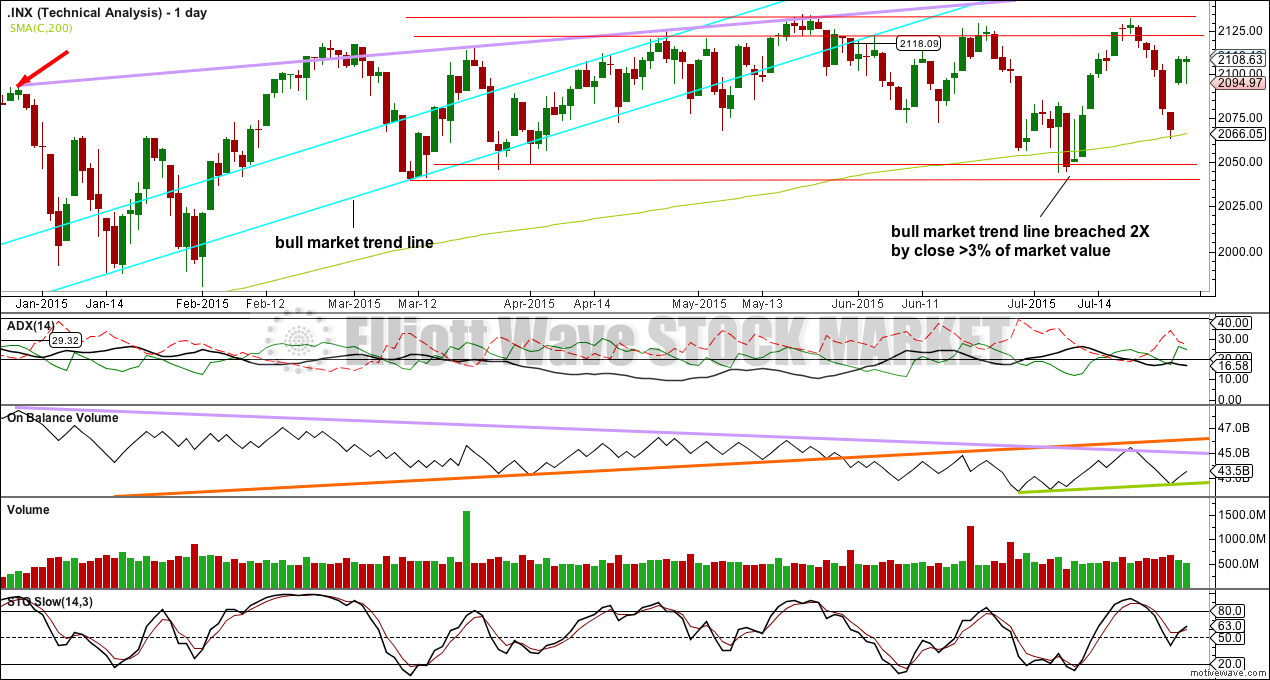
Click chart to enlarge.
ADX is again no longer clearly turning up, but instead turning slightly down. Again ADX indicates there is no clear trend and the market is consolidating. Recently rises in price are accompanied by ADX indicating no trend, and the last two falls in price were accompanied by ADX indicating the early stages of a trend (which was down) at least at the end. Overall it does look like a downwards trend may be developing, and there is at least no indication from ADX that an upwards trend may be still in place.
A range bound trading system may be better used again than a trend following system. This would still expect some more downwards movement, to not end until price finds support at the lower two red horizontal trend lines and Stochastics is oversold at the same time.
As both Elliott wave counts are also expecting some downwards movement to begin very shortly, this regular technical analysis is in agreement.
As price turns down to reach support, if On Balance Volume breaks below its short held green trend line, that would be another reasonably bearish indicator.
Along the way down, price may again find support about the 200 day SMA (green). If price breaks clearly below that line, then it would be a very bearish indicator; a bounce at least or an end to downwards movement should initially be expected there. If Stochastics reaches oversold while price finds support at the 200 day SMA, then it may be where downwards movement ends, but only as long as ADX continues to indicate no clear trend.
The last two days have seen green candlesticks with declining volume. Again volume is not supporting this rise in price. This has happened recently and was followed by new all time highs (red arrow) so it may not be reliable. It is also possible that the unusual volume profiles seen recently for the S&P 500 are a warning of something very big to the downside to come, a canary in the mine indicating the very bearish Elliott wave count could be correct.
A note on Dow Theory: for the bear wave count I would wait for Dow Theory to confirm a huge market crash. For that to be confirmed the following new lows are needed:
S&P500: 1,820.66
Nasdaq: 4,116.60
DJT: 7,700.49
DJIA: 15,855.12
At this time DJT is closest, but none of these indices have made new major swing lows yet.
This analysis is published about 09:46 p.m. EST.
It is interesting how often new VIX lows are seen on second wave retracements prior to a third wave down. In the present case, we have a another interesting trigger in the form of a Puerto Rico bond payment due tomorrow and which in all likelihood will not be made. Monday morning ought to be interesting.