
Yesterday’s Elliott wave analysis allowed for the possibility for upwards movement to continue.
Summary: A new low below 2,076.11 would be earliest price confirmation that upwards movement is over, and downwards momentum may then be expected to build. A new high above 2,132.82 would indicate this upwards movement should make new all time highs, and the target for it to end is at 2,152.
Changes to last analysis are bold.
To see a weekly chart and how to draw trend lines click here.
Note regarding data for Tuesday and Wednesday’s sessions: I am unable to get the Google / Yahoo data feed to provide a candlestick for Tuesday, nor data for ADX, OBV or RSI for Wednesday’s session. These will turn up tomorrow. For today’s analysis, I am relying on the volume bar for Wednesday and yesterday’s chart for Tuesday’s candlestick.
FIRST ELLIOTT WAVE COUNT
Click chart to enlarge.
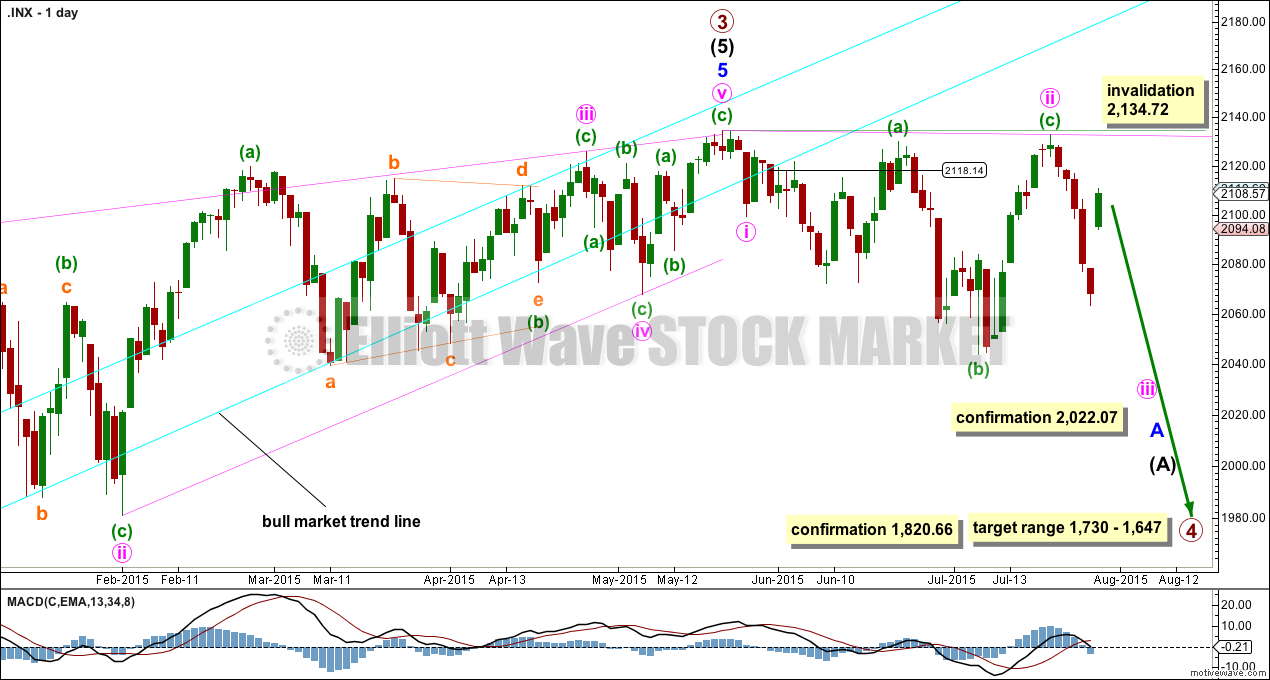
It is possible that the S&P has seen a primary degree (or for the bear count below a Super Cycle degree) trend change.
This wave count now has some confirmation at the daily chart level with a close more than 3% of market value below the long held bull market trend line.
Further confirmation would come with:
1. A new low below 2,044.02.
2. A new low below 2,022.07 to invalidate the alternate wave count.
3. A clear five down on the hourly chart.
4. A clear five down on the daily chart.
5. A new low below 1,820.66.
6. A break below the 50 week SMA on the weekly chart or the 200 day SMA on the daily chart.
As each condition is met the probability of a substantial trend change would increase.
At this stage, a trend change is looking somewhat likely so I’ll list points in its favour:
1. The long held bull market trend line, the strongest piece of technical analysis on ALL charts, has been breached now by a close more than 3% of market value.
2. There is quadruple negative divergence between price and MACD on the weekly chart.
3. There is double negative divergence between price and MACD on the daily chart.
4. There is persistent and strong negative divergence between price and RSI on the monthly chart. The last time this happened was October 2007 and we all know what happened after that…
5. A long held bull trend line on On Balance Volume going back to October 2014 has been breached, is no longer providing support, and is now providing resistance.
6. DJT has recently failed to confirm the continuation of a bull market. This does not indicate a bear market, but does indicate caution.
Primary wave 4 would be likely to end within the price territory of the fourth wave of one lesser degree: intermediate wave (4) has its price territory from 1,730 to 1,647.
Primary wave 4 would be likely to exhibit alternation to primary wave 2. Primary wave 2 was a 0.41 zigzag correction lasting 12 weeks, one short of a Fibonacci 13. Primary wave 4 may be more shallow than the 0.382 Fibonacci ratio, and may be a flat, combination or triangle, which are more time consuming structures than zigzags so it should be longer in duration than primary wave 2. Primary wave 4 may last a Fibonacci 21 weeks in total, 1.618 the duration of primary wave 2.
Click chart to enlarge.
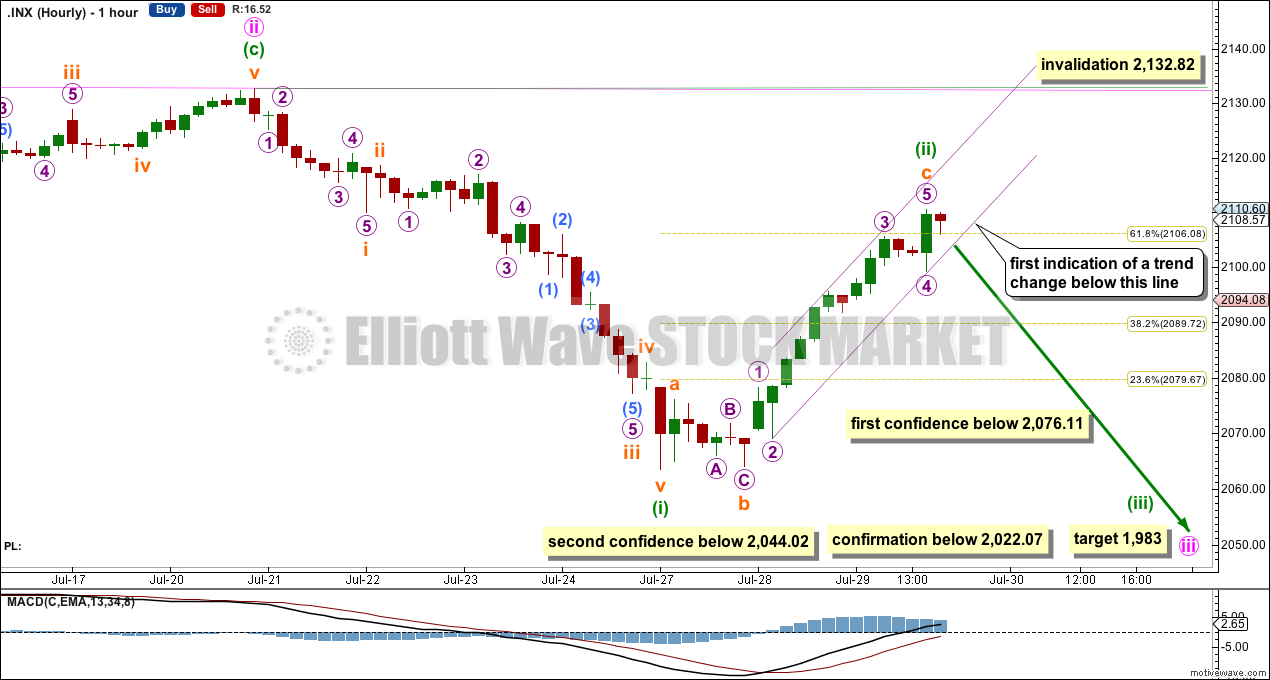
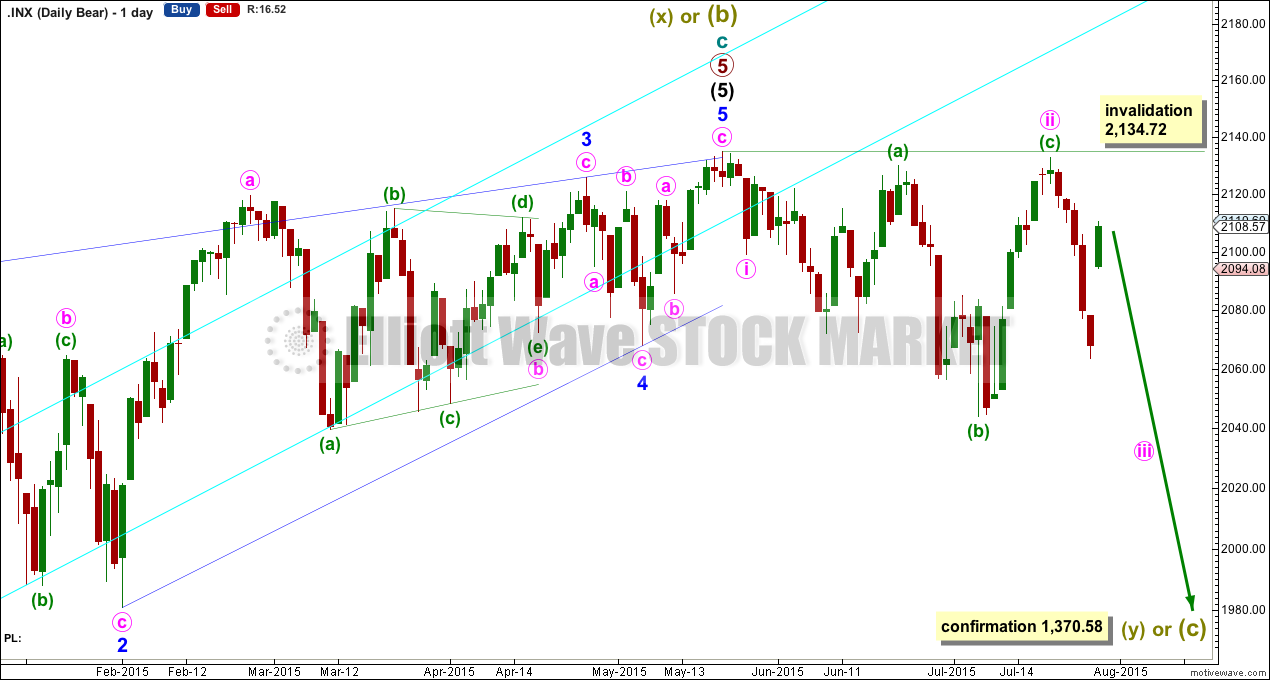
Minuette wave (ii) has continued higher. There is now no Fibonacci ratio between subminuette waves a and c.
Ratios within subminuette wave c are: micro wave 3 is 0.58 points short of 2.618 the length of micro wave 1, and micro wave 5 has no Fibonacci ratio to either of micro waves 1 or 3.
Minuette wave (ii) is now deeper than the 0.618 Fibonacci ratio of minuette wave (i). If it continues any higher (which is less likely now), then it should find resistance at the upper pink trend line connecting the start of minute wave i (at the all time high) to the end of minute wave ii.
Minuette wave (ii) may not move beyond the start of minuette wave (i) above 2,132.82.
This zigzag for minuette wave (ii) does not fit well into a parallel channel. A channel about subminuette wave c may be used as first indication that it may be over. When this upwards sloping violet channel is clearly breached by downwards movement then minuette wave (iii) may have begun. A new low below 2,076.11 would provide confidence, and at that stage I would calculate a target for minuette wave (iii). I am not prepared to do that while there is no confirmation that it has begun.
SECOND ELLIOTT WAVE COUNT
Click chart to enlarge.
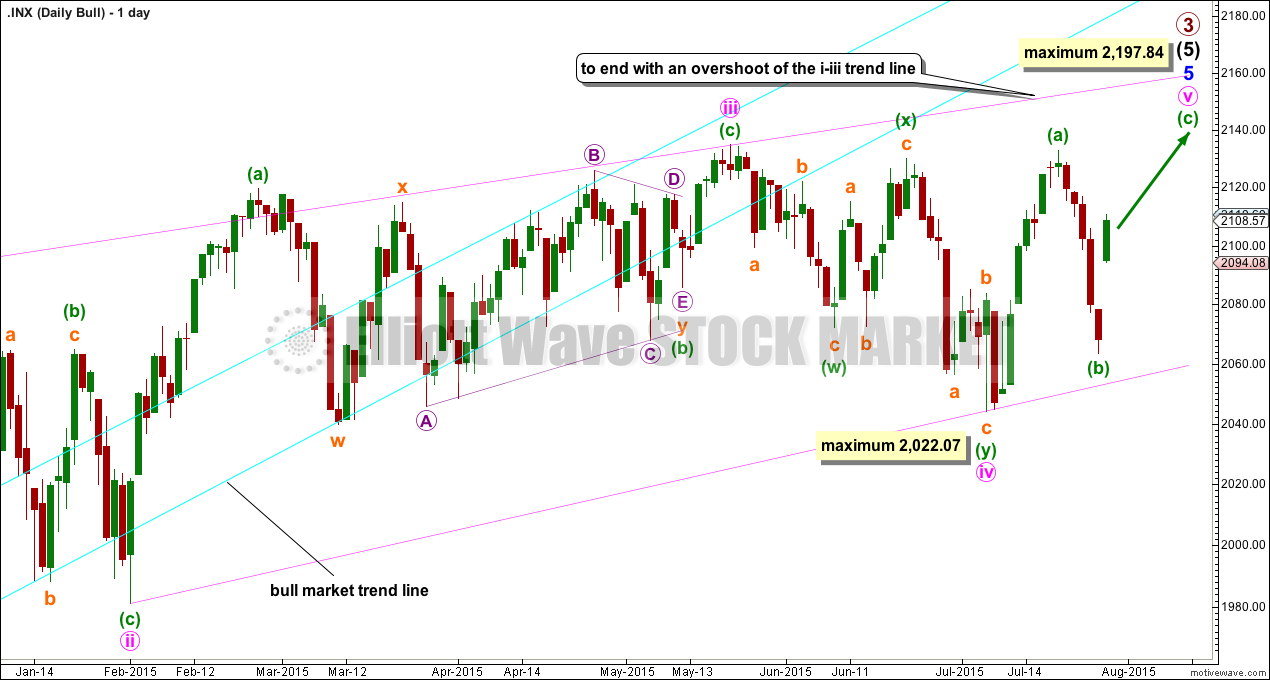
The ending contracting diagonal may still be incomplete. Ending diagonals require all sub waves to subdivide as zigzags, and the fourth wave should overlap first wave price territory. It is Elliott wave convention to always draw the diagonal trend lines to indicate a diagonal structure is expected.
My labelling here of minute wave iv within the diagonal as a double zigzag relies upon the interpretation of “double and triple zigzags take the place of zigzags” (“Elliott Wave Principle” by Frost and Prechter, 10th edition, page 91) to be true for zigzags within diagonals. This wave down may also be labelled as a single zigzag, but that does not have as neat a fit as a double zigzag.
The diagonal trend lines are no longer clearly converging. This reduces the probability of this wave count.
If it moves any lower, then minute wave iv may not be longer than equality in length with minute wave ii at 2,022.07. If it is over here, then minute wave v up also has a limit and may not be longer than equality with minute wave iii at 2,197.84.
The best way to see where and when upwards movement may end is the upper diagonal i-iii trend line. It is very likely to be overshot. Upwards movement may find resistance at the long held bull market trend line.
Click chart to enlarge.
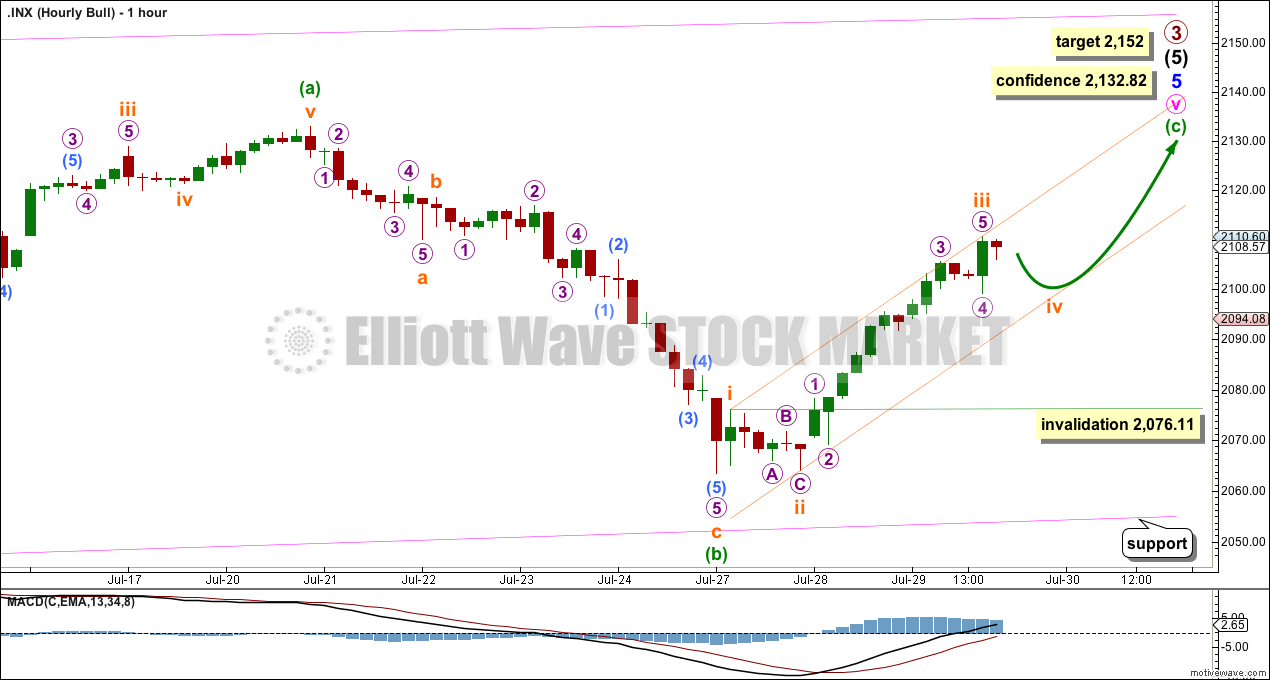
This second wave count sees the downwards movement as a three where the first wave count sees it as a five. Sometimes waves are ambiguous and it is not possible to tell with certainty which they are.
Minuette wave (c) upwards may only subdivide as an ending diagonal or an impulse. It is highly unusual for an ending diagonal to complete an ending diagonal, so an impulse for minuette wave (c) is much more likely. Within minuette wave (c), subminuette wave iv may not move into subminuette wave i price territory below 2,076.11.
If this wave count is invalidated with a new low below 2,076.11, then it may be possible that minuette wave (b) is continuing sideways as a triangle or lower as a double zigzag. The lower pink ii-iv diagonal trend line should provide strong support. If price breaks below that line, then the first wave count would be strongly favoured.
Only a new high above 2,132.82 would provide confidence for this second wave count. At that stage, the target for upwards movement to end is at 2,152 where minuette wave (c) would reach equality in length with minuette wave (a).
Draw the channel about minuette wave (c) using Elliott’s first technique. Draw the first trend line from the ends of subminuette waves i to iii then place a parallel copy on the end of subminuette wave ii. Subminuette wave iv may find support at the lower edge of that channel.
BEAR ELLIOTT WAVE COUNT
Click chart to enlarge.
The subdivisions within cycle waves a-b-c are seen in absolutely exactly the same way as primary waves 1-2-3 for the main wave count.
In line with recent Grand Super Cycle wave analysis, I have moved the degree of labelling for the bear wave count all up one degree.
This bear wave count expects a Super Cycle wave (c) to unfold downwards for a few years, and if it is a C wave it may be devastating. It may end well below 666.79.
However, if this wave down is a Super Cycle wave (y), then it may be a time consuming repeat of the last big flat correction with two market crashes within it, equivalent to the DotCom crash and the recent Global Financial Crisis, and it may take another 8-9 years to unfold sideways.
Within the new bear market, no second wave correction may move beyond the start of its first wave above 2,134.72.
The second wave count above works in the same way for this bear wave count.
TECHNICAL ANALYSIS
Click chart to enlarge.
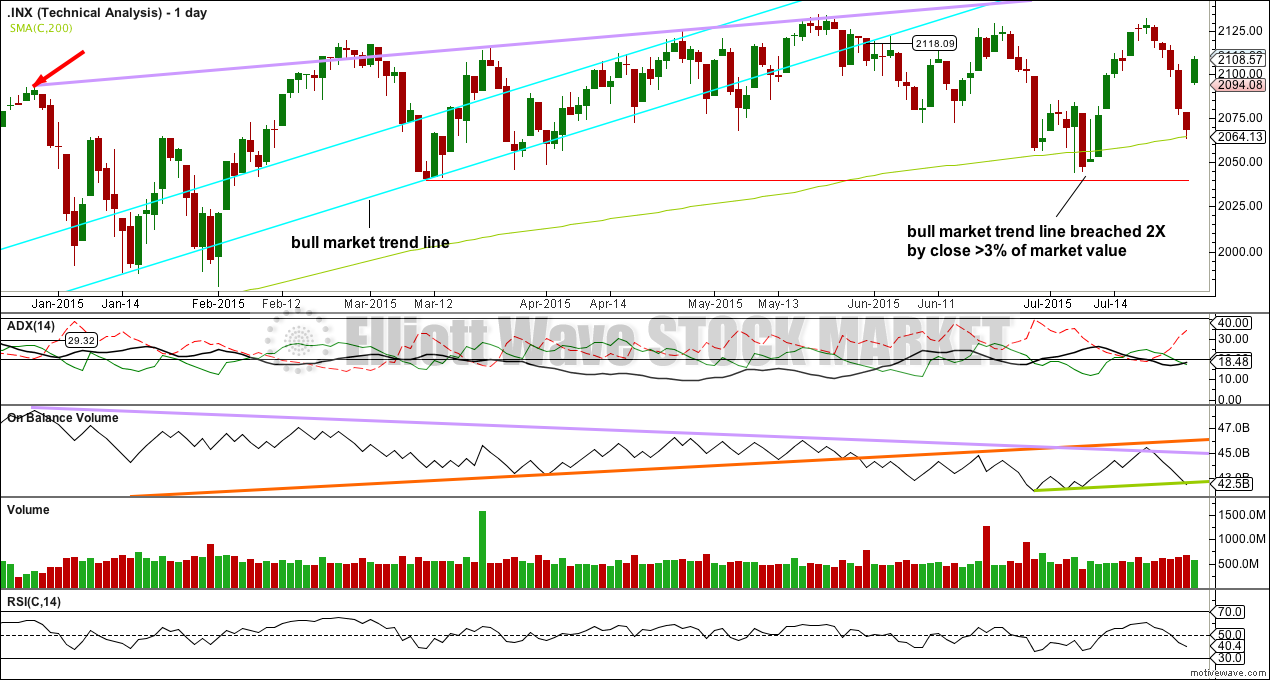
ADX is beginning to slightly turn up, and now indicates the early stages of a trend may be beginning. Waiting a little for clarity may be a good idea, or a trend following system may now be used. The trend would be down.
The risk here is that the first correction to unfold may move price substantially higher, up to but not above 2,132.82.
Downwards movement did find support at the 200 day SMA. A conservative approach to this potential new trend would be to wait for some confirmation; a break below the 200 day SMA and the lower red line of support would provide confidence in a downwards trend.
As price falls volume is rising. This fall in price is supported by volume. However, this has happened before recently for the S&P 500 and was followed by a swing up to new all time highs. The red arrow shows a prior all time high which came on declining volume, and was followed by five down days all on increasing volume. This is exactly the opposite of a normal volume profile. It was followed soon after by new all time highs. At this time volume may not be a reliable indicator. Wednesday’s upwards day comes on declining volume, but again I will not give too much weight to this because it has happened before, right before new all time highs were seen. Normally it would suggest this rise in price is not supported by volume.
On Balance Volume may be a better indicator. It showed where upwards movement recently ended: price turned when OBV touched its long held orange trend line.
If OBV breaks below its shorter green trend line, then that would be more bearish indication.
RSI is comfortably above 30. There is plenty of room for this market to fall.
A note on Dow Theory: for the bear wave count I would wait for Dow Theory to confirm a huge market crash. For that to be confirmed the following new lows are needed:
S&P500: 1,820.66
Nasdaq: 4,116.60
DJT: 7,700.49
DJIA: 15,855.12
At this time DJT is closest, but none of these indices have made new major swing lows yet.
This analysis is published about 08:45 p.m. EST.
DOW facing stiff resistance at 200 SMA. Keeping an eye on Transports to see if 50 day SMA can be maintained. A failure of both may mean a third and not a fourth. Hopefully we will know which by day’s end.