
The target for a small third wave at 2,135 was not met although price did move higher. The Elliott wave count remains the same.
Summary: Upwards movement should continue next week. The target may now be calculated at two wave degrees giving a small range of 2,135 – 2,137. This target may now be met next week.
Click charts to enlarge.
To see a weekly chart and how to draw trend lines go here.
Bull Wave Count
The bull wave count sees primary 1-2-3 within an impulse for a cycle degree wave V.
The bear wave count sees primary A-B-C zigzag for a cycle degree B wave.
The subdivisions for this upwards movement for both bull and bear wave counts are 5-3-5. The wave counts don’t diverge and won’t for months yet.
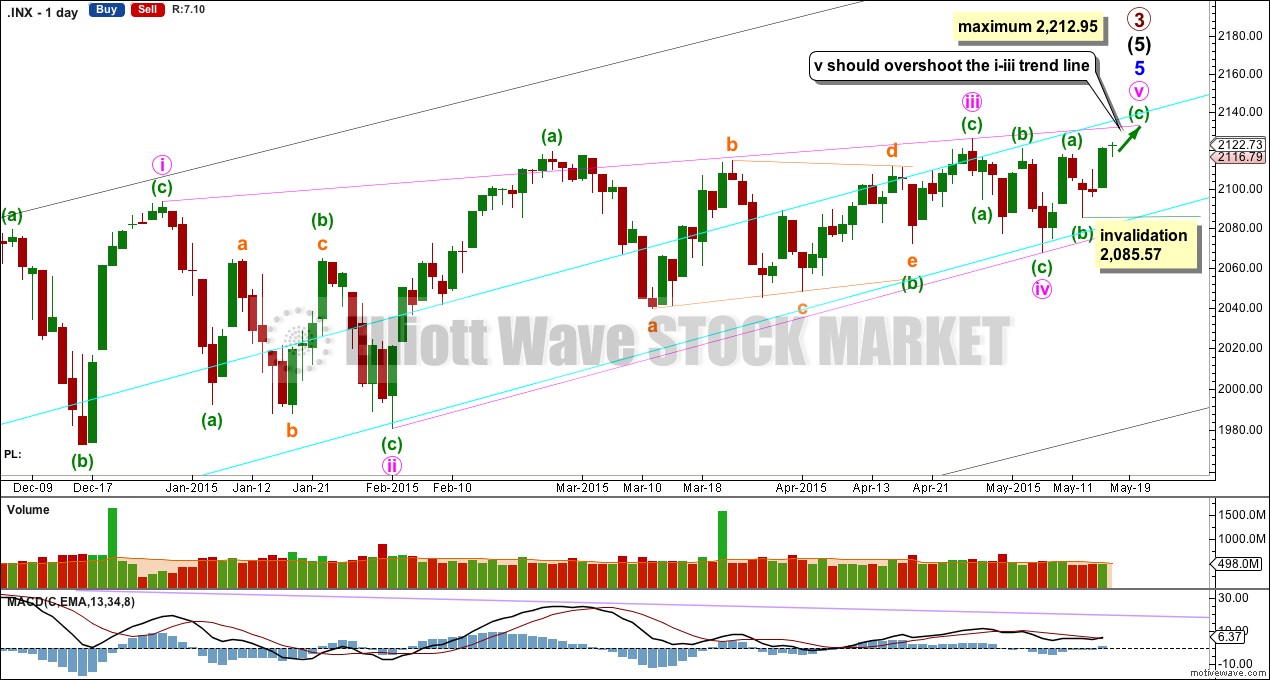
Minor wave 5 is an ending contracting diagonal, detailed on the daily chart below (the beginning is now off to the left of the chart, and can be seen on weekly charts).
All this choppy overlapping movement with declining momentum fits for a diagonal. An ending diagonal requires all sub waves to be zigzags, and the fourth wave must overlap back into first wave price territory. Elliott wave convention is to always draw the trend lines about a diagonal to indicate the structure is a diagonal.
The diagonal for minor wave 5 would be contracting: minute wave iii is shorter than minute wave i.
Minute wave iv is extremely likely to be over at the lower aqua blue trend line. If minute wave v begins here then it has a limit. It may not be longer than equality with minute wave iii at 2,212.95.
Within minute wave v, minuette wave (b) may not move beyond the start of minuette wave (a) below 2,067.93.
Within impulses, the S&P often exhibits a Fibonacci ratio between two of its three actionary waves and rarely between all three. Within primary wave 3, there is already a close Fibonacci ratio between intermediate waves (1) and (3), and within intermediate wave (5) there is already a reasonable Fibonacci ratio between minor waves 3 and 1. It is unlikely that either minor wave 5 or intermediate wave (5) will exhibit a Fibonacci ratio. This means a target for primary wave 3 calculated at intermediate or minor degree would not have a good probability.
The target at 2,190 from the weekly chart looks to be too high. I would not expect such a large overshoot of the diagonal trend line.
Actionary waves within diagonals don’t normally exhibit Fibonacci ratios to each other. So the target cannot be reliably calculated at minute degree.
A better way to see where minute wave v is likely to end is the i-iii trend line. It is very common for the fifth wave of a contracting diagonal to overshoot the i-iii trend line. Only when this line is overshot would I consider and end to primary wave 3.
Hourly Wave Count
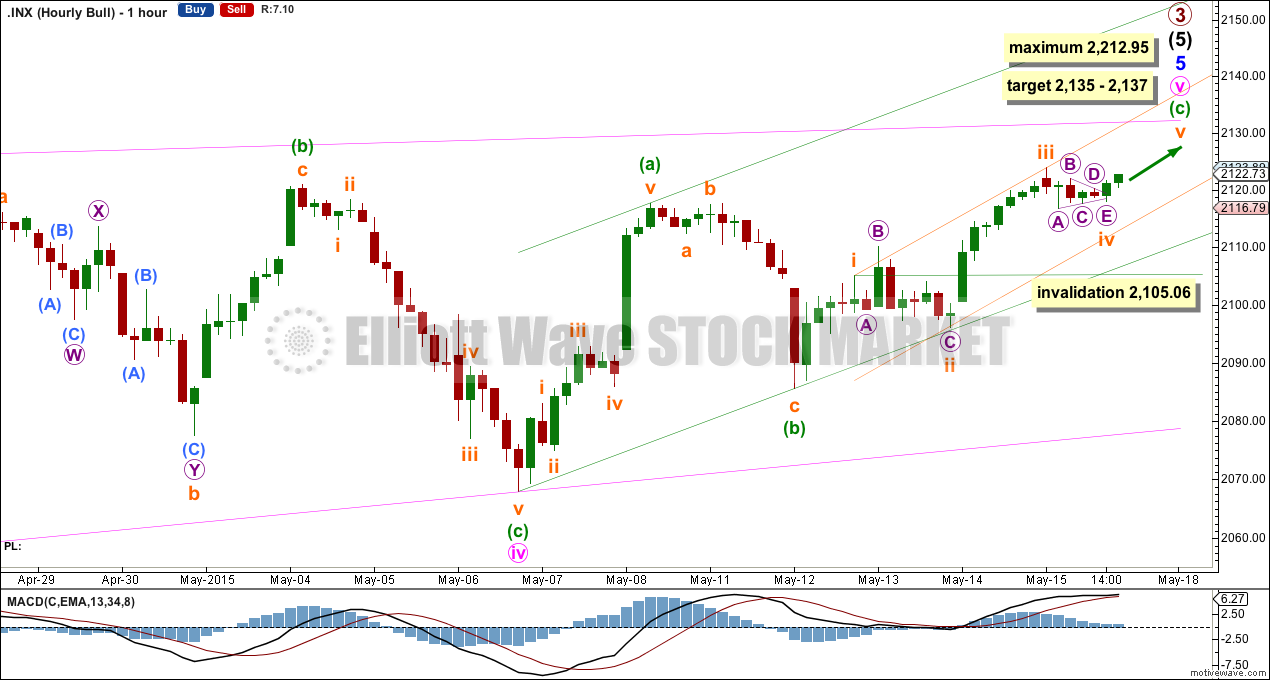
Subminuette wave iii did not reach the target, does not exhibit a Fibonacci ratio to subminuette wave i, but it is longer in length than subminuette wave i. It is very likely that subminuette wave v will exhibit a Fibonacci ratio to either of subminuette waves i or iii. The most likely relationship for a fifth wave is equality in length with the first wave at 2,137. At 2,135 minuette wave (c) would reach equality in length with minuette wave (a).
If the target is wrong it may be too low. The pink i-iii trend line is likely to be substantially overshot before upwards movement comes to an end.
Draw a corrective channel about this final zigzag up: draw the first trend line from the start of minuette wave (a) to the end of minuette wave (b) then place a parallel copy on the end of minuett wave (a). Along the way up downwards corrections should find support at the lower trend line. Minuette wave (c) may end either midway within the channel or about the upper edge. The first indication that upward movement is over would be a clear breach of this wider green channel.
Draw another channel about minuette wave (c): draw the first trend line from the ends of subminuette waves i to iii, then place a parallel copy on the end of subminuette wave ii. Subminuette wave iv is contained within this channel. Subminuette wave v may end at the upper edge.
If subminuette wave iv continues further it may not move into subminuette wave i price territory below 2,105.06.
Bear Wave Count
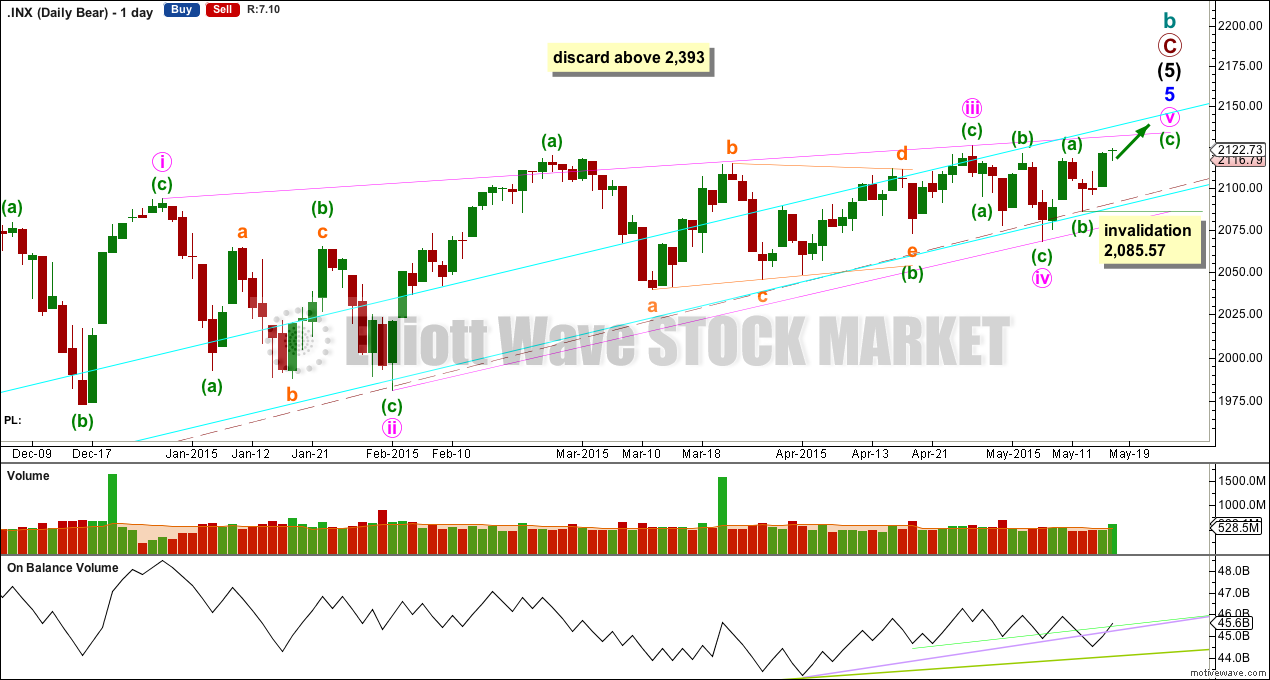
The subdivisions within primary waves A-B-C are seen in absolutely exactly the same way as primary waves 1-2-3 for the bull wave count.
To see the difference at the monthly chart level between the bull and bear ideas look at the last historical analysis here.
At cycle degree wave b is over the maximum common length of 138% the length of cycle wave a, at 167% the length of cycle wave a. At 2,393 cycle wave b would be twice the length of cycle wave a and at that point this bear wave count should be discarded.
While we have no confirmation of this wave count we should assume the trend remains the same, upwards. This wave count requires confirmation before I have confidence in it. Full and final confirmation that the market is crashing would only come with a new low below 1,370.58. However, structure and momentum should tell us long before that point which wave count is correct, bull or bear.
On Balance Volume should continue to find support at the trend lines drawn. When the longer held green trend line is broken by OBV a trend change would be supported.
Technical Analysis
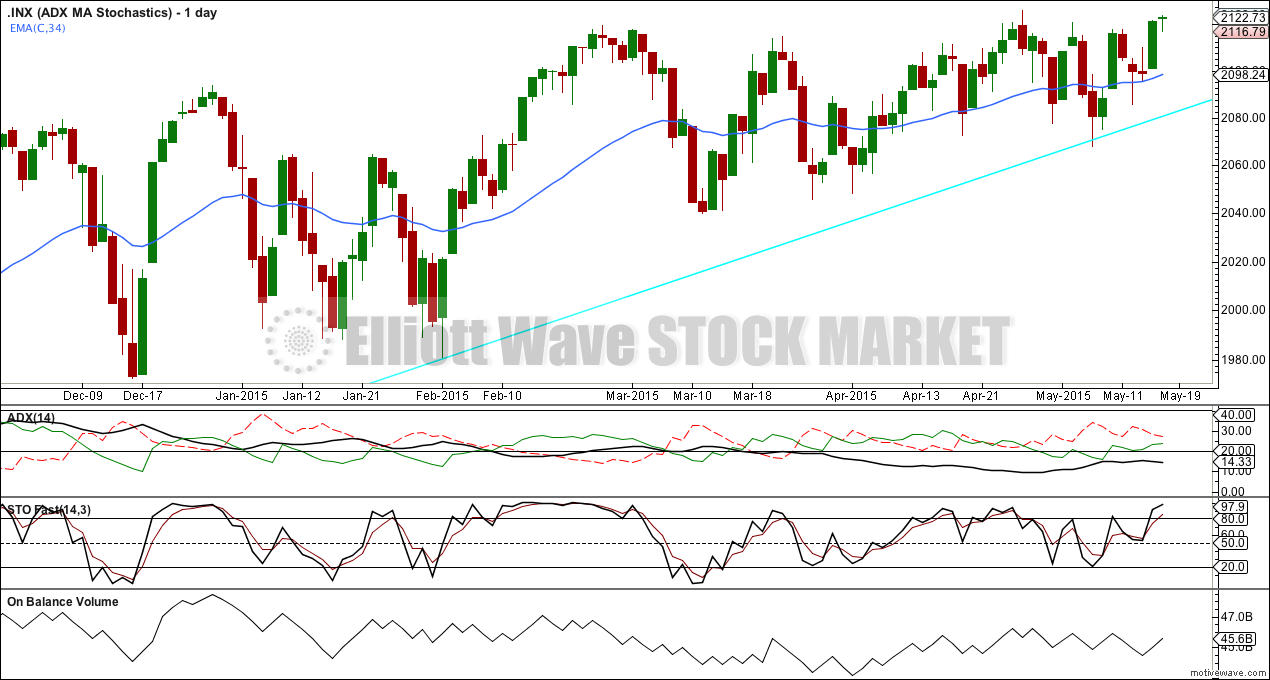
At any one time a market will be doing only one of two things: trending or trading (moving sideways). Therefore, different TA approaches must be used for these two market scenarios.
ADX can be used to indicate if a market is trending or trading. At the end of this week ADX is flat and below 15 indicating low volatility, very short swings and no trend. The situation is not as clear as the day before. ADX indicates downwards direction is stronger than upwards, but price is above the 34 day EMA and on balance volume moving up agrees with price moving up.
Volume for Friday was slightly higher for an up day (volume is shown on the daily bull chart). This supports an upwards trend.
On balance, with price above both the 34 day EMA and the long held bull trend line, it can be assumed that it is most likely the trend at this stage is up.
This analysis is published about 02:07 a.m. EST.
While the waves will ultimately take on Elliott wave patterns, it has to be absolutely clear to any objective observer that this market is seeing desperate attempts to keep it aloft by injection of liquidity at critical junctures (just look at the pathetic volume). I would not be at all surprised to see the charade continue into the Fall. It will all probably come to a screeching halt sometime in the fall when global forces coalesce to overwhelm the market manipulators. Rising interest rates will be the trigger…the S&P 500 break from the triple top actually suggests a top around 2300…
Hi Lara. The last time we reached Minute 1 at 2093.55, which we thought was the end of the Primary 3 wave, minor 5 was extended. Now that we are approaching 2135/2137 as the end of minor 5, would it be second time unlucky? What I mean is that the minute waves are moved down by one degree again so that minute 1 becomes 2135/2137, and there will be another long wait for the correction which never seems to arrive. What do you feel is the probability of this happening?
When this contracting diagonal structure is complete then I will make this wave count an alternate pending confirmation. The main wave count will assume the S&P remains in a bull market until proven otherwise. The main wave count will be exactly as you suggest; the diagonal will be labelled as a leading contracting diagonal for a first wave within minor wave 5.
Yes, it’s been a long wait. The only thing we can say for sure is a correction will come. They always do.
I’m going to use that aqua blue trend line to do this for me; when that line is breached by a close of 3% or more of market value then, and ONLY then, will I have a wave count which says there’s been a primary or cycle degree trend change.
I’m going to approach this market in this way precisely because I have been wrong a few times to date in expecting a big correction.
Thanks Lara. That’s what I thought might happen. Market sentiment is still quite bullish at the moment so much so that the probability of a large correction diminishes. This is especially so because the US dollar is still correcting from its parabolic rise, effectively devaluing the dollar and making assets denominated in the dollar cheaper. Having said that, the market has been known to turn around when investors least expects it to. If that occurs, the drop will gather momentum quite quickly as investors will start bailing out, since the prolonged rise in the S&P may be perceived to be a “bubble”. And we know what happens when bubbles break.
I would expect the market to be almost exclusively bullish, high 90%, at the high.
Only when all the bears have lost heart will it be ready to turn.
EW is very contrarian.