
Upwards movement was expected for Monday, but this is not what happened. Some downwards movement was expected, but for later this week and not for Monday. The Elliott wave count remains the same.
Summary: Downward movement for Monday is showing on the daily chart as a red candlestick so this is most likely minuette wave (b) of the final fifth wave zigzag. It is not possible today to tell if minuette wave (b) is over or not, so it may continue now for up to three more days. Only a clear five up on the 5 or 15 minute chart would confirm it is over.
Click charts to enlarge.
To see a weekly chart and how to draw trend lines go here.
Bull Wave Count
The bull wave count sees primary 1-2-3 within an impulse for a cycle degree wave V.
The bear wave count sees primary A-B-C zigzag for a cycle degree B wave.
The subdivisions for this upwards movement for both bull and bear wave counts are 5-3-5. The wave counts don’t diverge and won’t for months yet.
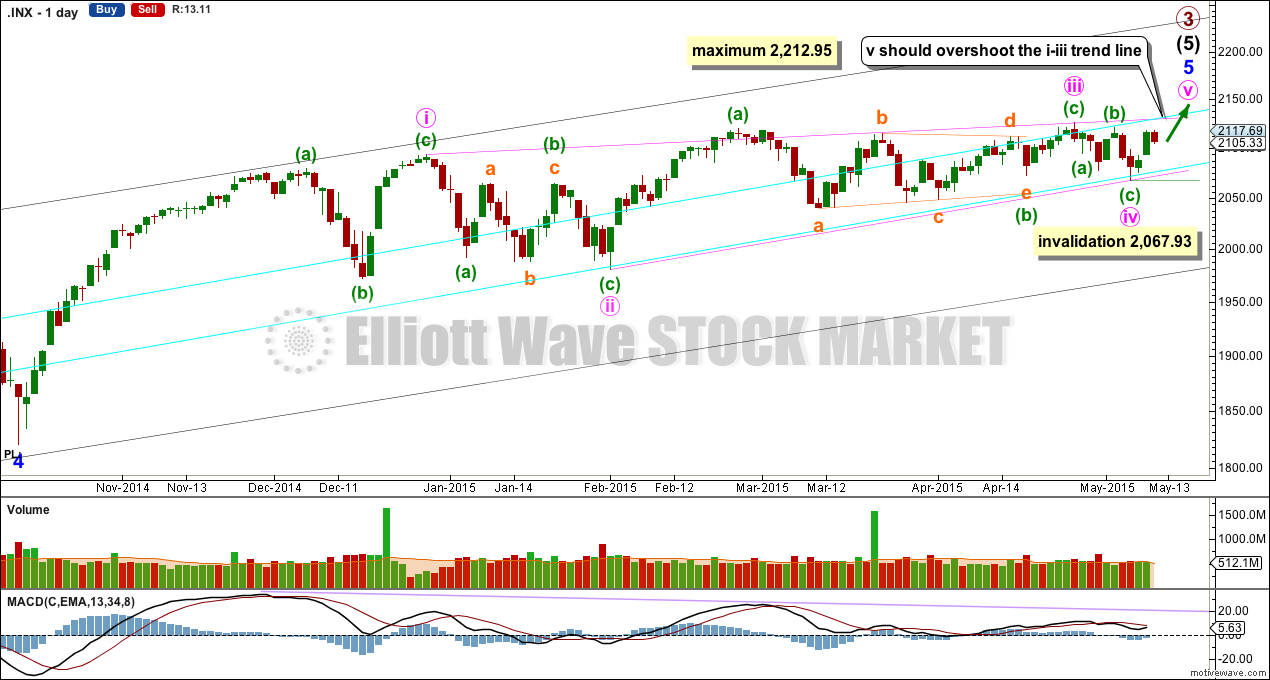
Minor wave 5 is an ending contracting diagonal, detailed on the daily chart below.
All this choppy overlapping movement with declining momentum fits for a diagonal. An ending diagonal requires all sub waves to be zigzags, and the fourth wave must overlap back into first wave price territory. Elliott wave convention is to always draw the trend lines about a diagonal to indicate the structure is a diagonal.
The diagonal for minor wave 5 would be contracting: minute wave iii is shorter than minute wave i.
Minute wave iv is extremely likely to be over at the lower aqua blue trend line. If minute wave v begins here then it has a limit. It may not be longer than equality with minute wave iii at 2,212.95.
Within minute wave v, minuette wave (b) may not move beyond the start of minuette wave (a) below 2,067.93.
Within impulses, the S&P often exhibits a Fibonacci ratio between two of its three actionary waves and rarely between all three. Within primary wave 3, there is already a close Fibonacci ratio between intermediate waves (1) and (3), and within intermediate wave (5) there is already a reasonable Fibonacci ratio between minor waves 3 and 1. It is unlikely that either minor wave 5 or intermediate wave (5) will exhibit a Fibonacci ratio. This means a target for primary wave 3 calculated at intermediate or minor degree would not have a good probability.
The target at 2,190 from the weekly chart looks to be too high. I would not expect such a large overshoot of the diagonal trend line.
Actionary waves within diagonals don’t normally exhibit Fibonacci ratios to each other. So the target cannot be reliably calculated at minute degree.
A better way to see where minute wave v is likely to end is the i-iii trend line. It is very common for the fifth wave of a contracting diagonal to overshoot the i-iii trend line. Only when this line is overshot would I consider and end to primary wave 3.
First Hourly Wave Count
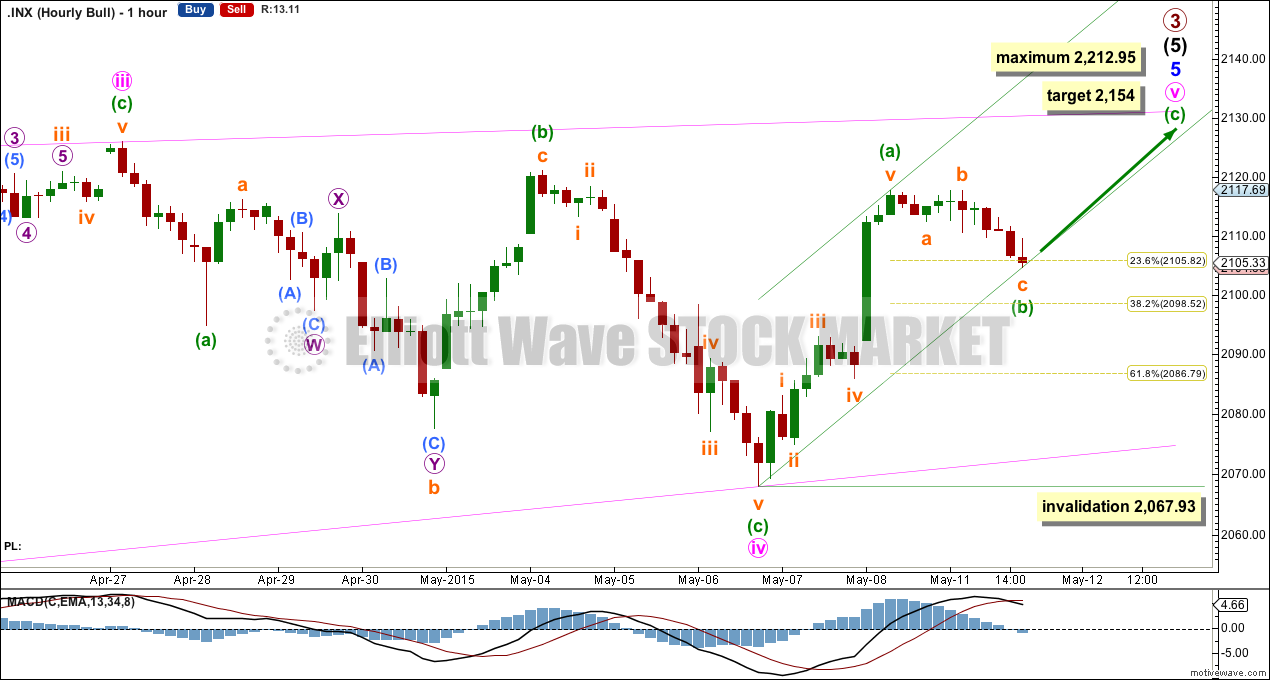
Because downwards movement for Monday is showing so clearly on the daily chart this is most likely minuette wave (b), and minuette wave (a) was over on Friday.
Ratios within minuette wave (a) are: there is no Fibonacci ratio between subminuette waves iii and i, and subminuette wave v is 2.76 points longer than 1.618 the length of subminuette wave iii.
Within minuette wave (b), subminuette wave c is 0.81 short of 2.618 the length of subminuette wave a. There is not enough upwards movement at the end of Monday’s session to confirm an end to subminuette wave c. If it continues lower it may not move beyond the start of minuette wave (a) below 2,067.93.
If it gets down to the lower pink ii-iv trend line of the diagonal it should find very strong support there; that trend line should not be breached while the diagonal is incomplete.
At 2,154 minuette wave (c) would reach equality in length with minuette wave (a). If minuette wave (b) continues lower this target must also move correspondingly lower.
Only when there is a clear five up (the first wave up within minuette wave (c) must be a five) would I have confidence that minuette wave (b) is over and minuette wave (c) up is underway.
It is very likely that minute wave v will move at least slightly above the end of minute wave iii at 2,125.92 to avoid a truncation.
Second Hourly Wave Count
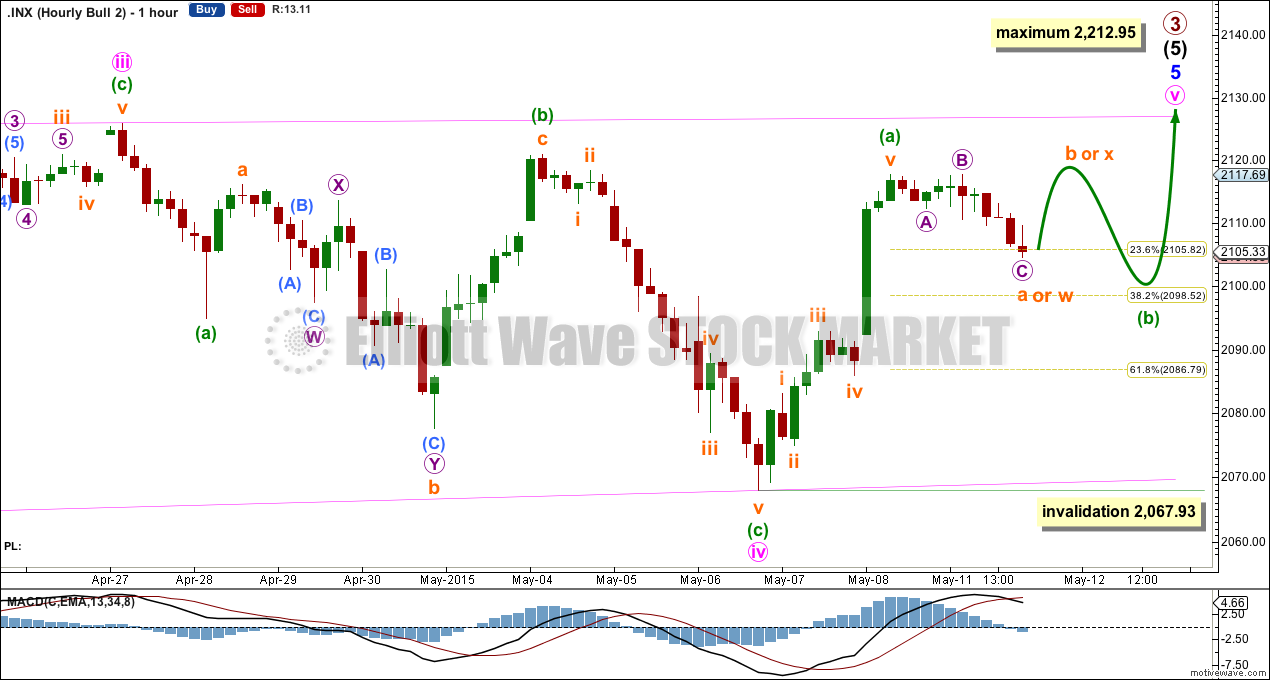
Minuette wave (b) may continue sideways and / or lower for another one to three days. This single zigzag may be only subminuette wave a of a larger flat correction, or it may be subminuette wave w as the first structure in a double zigzag or double combination.
If minuette wave (b) continues sideways as a flat correction it may end about the 0.382 Fibonacci ratio at 2,099.
If minuette wave (b) continues lower as a double zigzag it may end about the 0.618 Fibonacci ratio at 2,087.
Minuette wave (b) may not move beyond the start of minuette wave (a) below 2,067.93. It should find very strong support at the lower ii-iv pink trend line of the diagonal, if it gets down that low.
Bear Wave Count
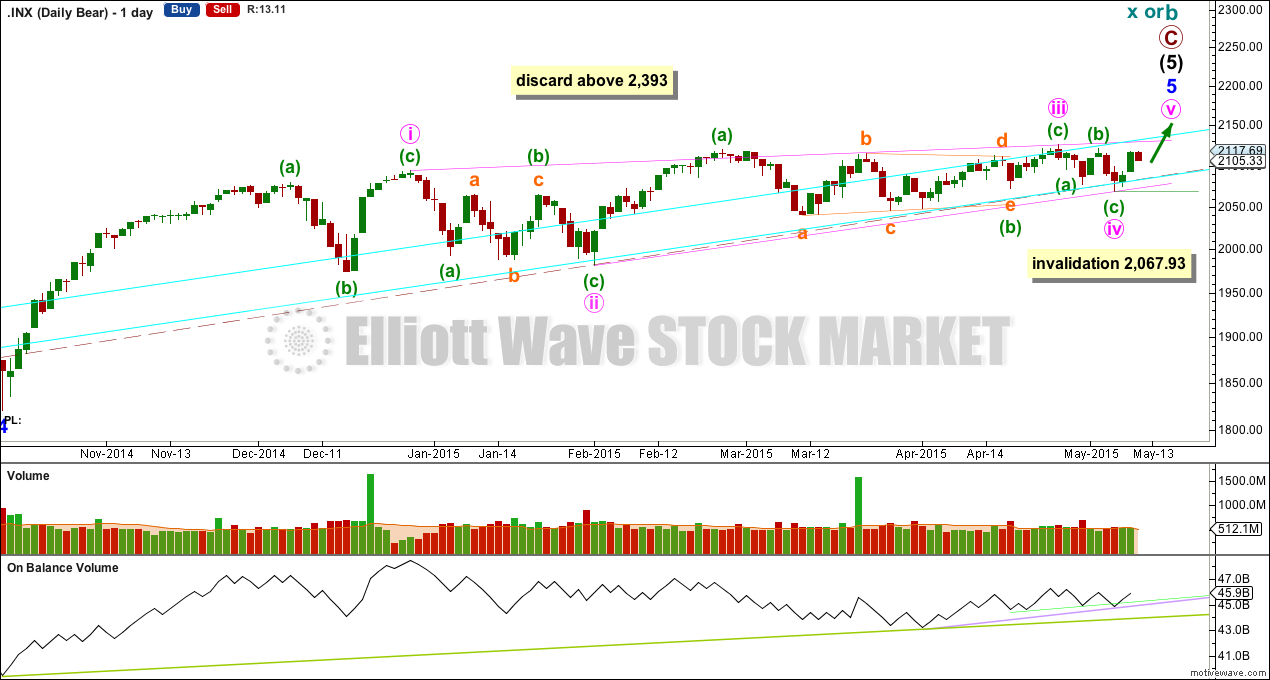
The subdivisions within primary waves A-B-C are seen in absolutely exactly the same way as primary waves 1-2-3 for the bull wave count.
To see the difference at the monthly chart level between the bull and bear ideas look at the last historical analysis here.
At cycle degree wave b is over the maximum common length of 138% the length of cycle wave a, at 167% the length of cycle wave a. At 2,393 cycle wave b would be twice the length of cycle wave a and at that point this bear wave count should be discarded.
While we have no confirmation of this wave count we should assume the trend remains the same, upwards. This wave count requires confirmation before I have confidence in it. Full and final confirmation that the market is crashing would only come with a new low below 1,370.58. However, structure and momentum should tell us long before that point which wave count is correct, bull or bear.
On Balance Volume should continue to find support at the trend lines drawn. When the longer held green trend line is broken by OBV a trend change would be supported.
This analysis is published about 06:40 p.m. EST.
May 7 gap at 2088 filled this morning.
Lara on the hourly chart where ‘b’ is marked, all sources I’ve looked at show a new high in the S&P 500 by .03 at that point. Therefore, it can’t be a zigzag. It doesn’t look like a regular flat and an expanded flat would’ve expected ‘b’ to move a little higher. I’m thinking subminuette iv ended today at 2104.58. If it lasts any longer or moves any deeper, it would not have right look.
I’m using the Google / Yahoo data feed.
I know different data feeds have slight differences. I need to consistently use the same data feed for the wave count. And I need to accept the data points given in the data I’m using.
I have minuette wave (a) ending at 2,117.66 and subminuette wave b ending at 2,117.56. My data feed has a 0.10 difference with b not moving beyond a, so it’s a zigzag.
I cannot do a wave count by taking all different data feeds into account. It just wouldn’t work.