
The main hourly Elliott wave count expected downwards movement which is what happened.
Summary: It is most likely downwards movement will continue for at least one more day, and maybe two. The target remains the same at 2,071, with a limit at 2,013.27. Downwards movement may end when price again touches the lower of the double aqua blue trend lines on the daily chart.
To see a weekly chart showing how to draw trend lines and the structure of primary wave 3 go here.
I am very pleased today to be able to inform members that I sat and passed the level II CMT exam yesterday.
Click charts to enlarge.
Bull Wave Count
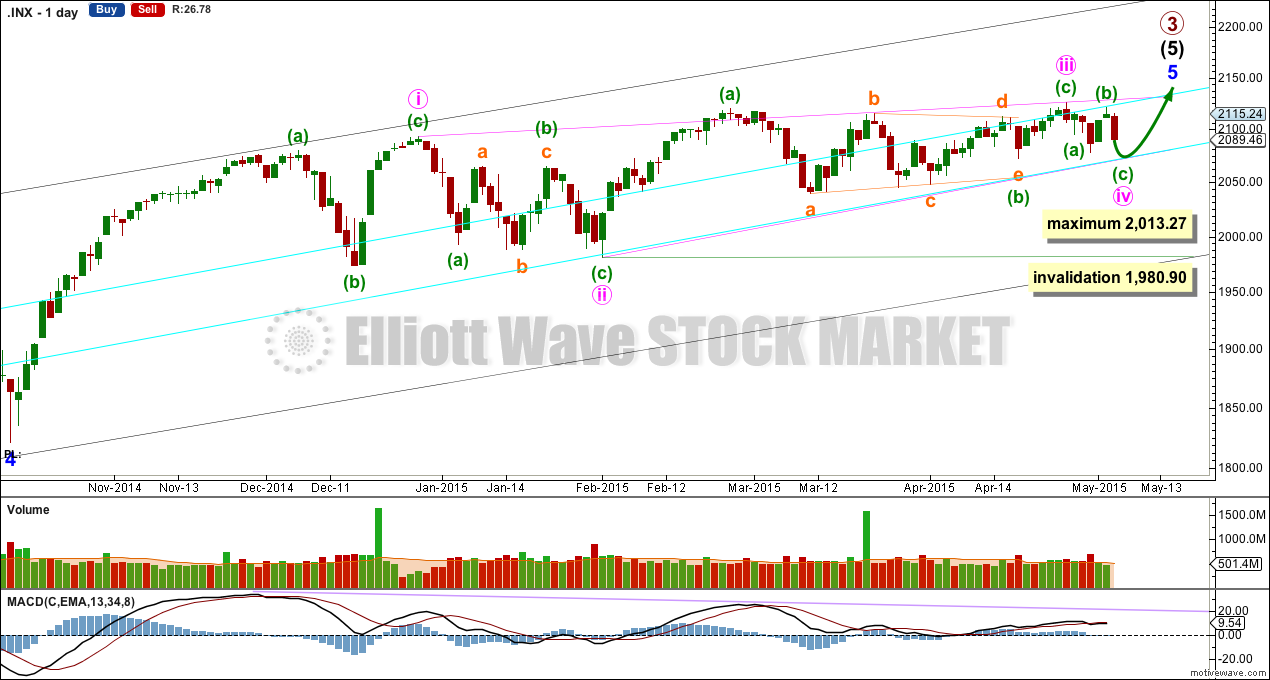
Both bull and bear wave counts see minor wave 5 as an ending contracting diagonal.
Minor wave 5 begins here as labelled. All this choppy overlapping movement with declining momentum fits for a diagonal. An ending diagonal requires all sub waves to be zigzags, and the fourth wave must overlap back into first wave price territory. Elliott wave convention is to always draw the trend lines about a diagonal to indicate the structure is a diagonal.
The diagonal for minor wave 5 would be contracting: minute wave iii is shorter than minute wave i. Minute wave iv must be shorter than minute wave ii, the maximum length for minute wave iv is equality in length with minute wave ii at 2,013.27. The rule for the end of a fourth wave within a diagonal is it must overlap back into minute wave i price territory below 2,093.55 and it may not move beyond the end of minute wave ii below 1,980.90.
Minute wave iv would be most likely to end when price again comes to touch the lower aqua blue trend line.
I don’t have a target for primary wave 3 to end yet because I don’t think minor wave 5 will exhibit a Fibonacci ratio to either of minor waves 3 and 1, because there is already a ratio between 3 and 1. Likewise at intermediate degree: intermediate waves (1) and (3) have a close ratio so intermediate wave (5) may not exhibit a ratio to either of (1) or (3). The best way to see where this upwards movement is likely to end is the i-iii trend line of the diagonal, as it is likely to be slightly overshot.
I still favour the main hourly wave count. Volume for minuette wave (b) is lower than the prior down day, and the second green candlestick to end minuette wave (b) shows a small decrease in volume from the first. If minuette wave (b) was a correction against the trend this is exactly how volume should behave. Volume supports the main hourly wave count.
Main Hourly Wave Count
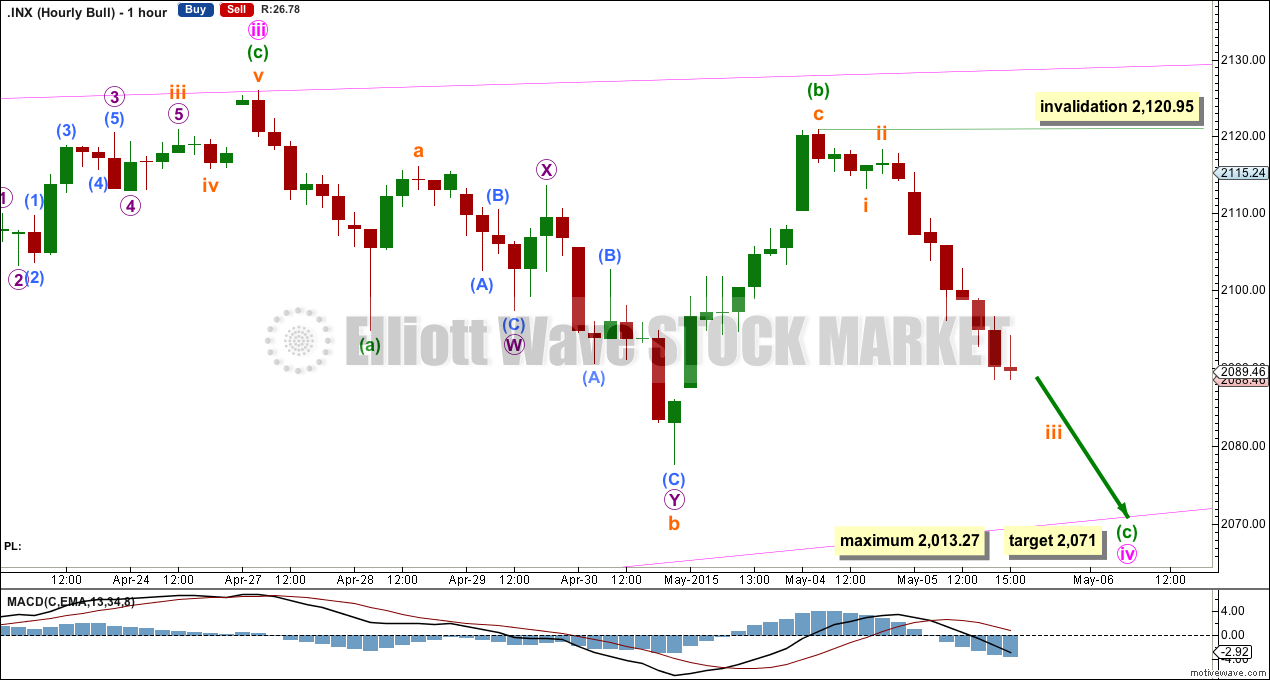
Minute wave iv is still incomplete most likely. At 2,071 minuette wave (c) would reach 1.618 the length of minuette wave (a). This target would probably bring price down to again touch the lower of the double aqua blue trend lines.
If minute wave iv continues lower for two more days it may end in a total Fibonacci eight days / sessions.
Minute wave iv may not be longer than equality in length with minute wave ii, which gives a maximum to expected downwards movement at 2,013.27.
Within minuette wave (c) no second wave correction may move beyond the start of its first wave above 2,120.95.
Alternate Hourly Wave Count
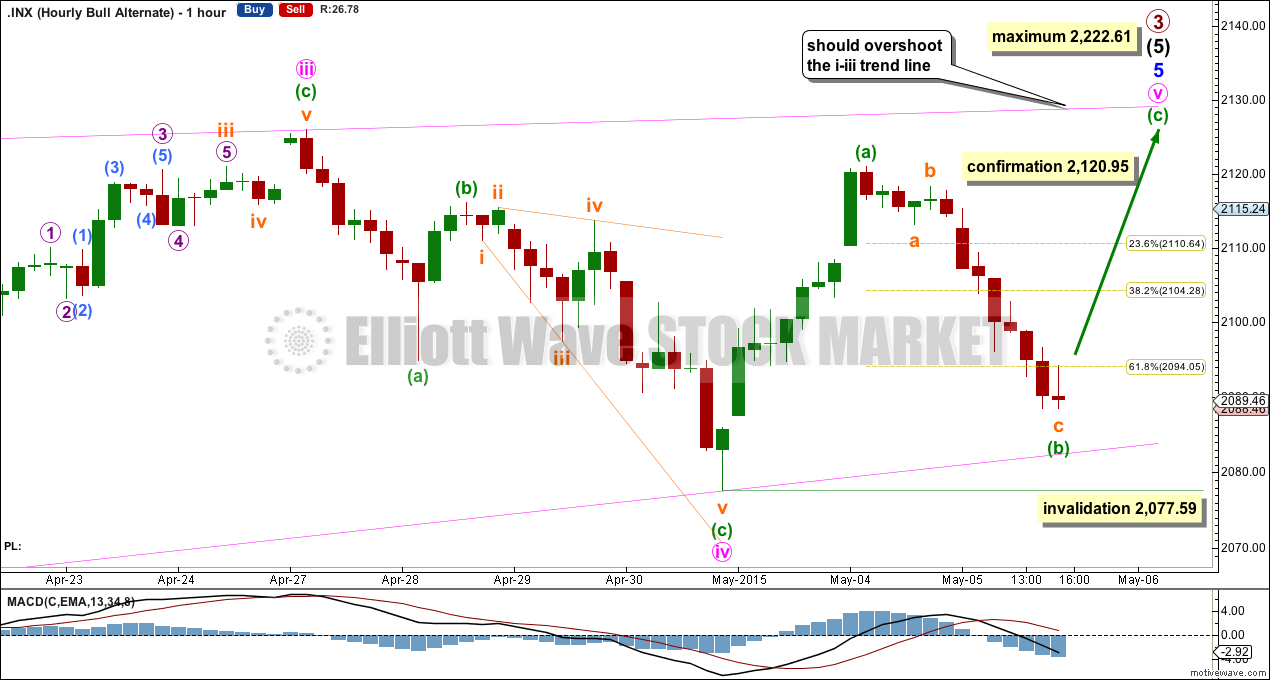
This wave count remains viable. It requires confirmation now above 2,120.95.
If minute wave v has begun then within it minuette wave (b) should be over here or extremely soon. It may not move beyond the start of minuette wave (a) below 2,077.59. If it moves lower it should find strong support at the lower pink ii-iv trend line of the diagonal. If this trend line is breached by downwards movement the probability of this alternate wave count would reduce further.
Bear Wave Count
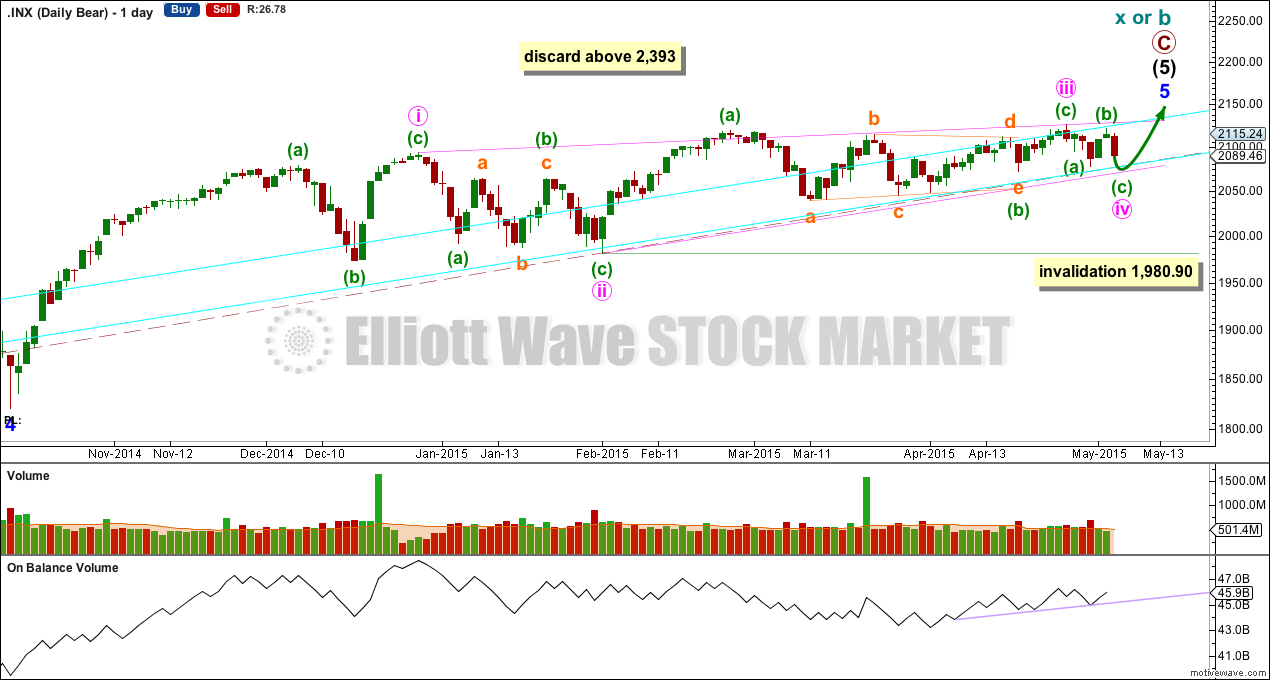
The subdivisions within primary waves A-B-C are seen in absolutely exactly the same way as primary waves 1-2-3 for the bull wave count. The alternate bull wave count idea also works perfectly for this bear wave count.
To see the difference at the monthly chart level between the bull and bear ideas look at the last historical analysis here.
At cycle degree wave b is over the maximum common length of 138% the length of cycle wave a, at 167% the length of cycle wave a. At 2,393 cycle wave b would be twice the length of cycle wave a and at that point this bear wave count should be discarded.
While we have no confirmation of this wave count we should assume the trend remains the same, upwards. This wave count requires confirmation before I have confidence in it. Full and final confirmation that the market is crashing would only come with a new low below 1,370.58. However, structure and momentum should tell us long before that point which wave count is correct, bull or bear.
On Balance Volume has a small trend line providing support over the month on the daily chart. If price moves lower for another one or two days as I expect it to do, then look for OBV to find support at this trend line. When OBV touches that trend line again the downwards move may be over for the short term.
This analysis is published about 08:42 p.m. EST.
Lara, many congratulations on your CMT success!
Thank you very much Nick!
Only one more to go, level III.