
Overall upwards movement was expected.
Summary: The target for the main wave count is now at 2,187. The target for the more bullish alternate is first at 2,571. On the way up a new high above 2,253.79 would indicate the bull market should continue for longer, maybe another one or two years. The short term target is at 2,168.
I am away from home today and without an internet connection which would allow for video upload. There will be no video today. I will say everything I need to say in the text below.
Click charts to enlarge.
Bullish Wave Count
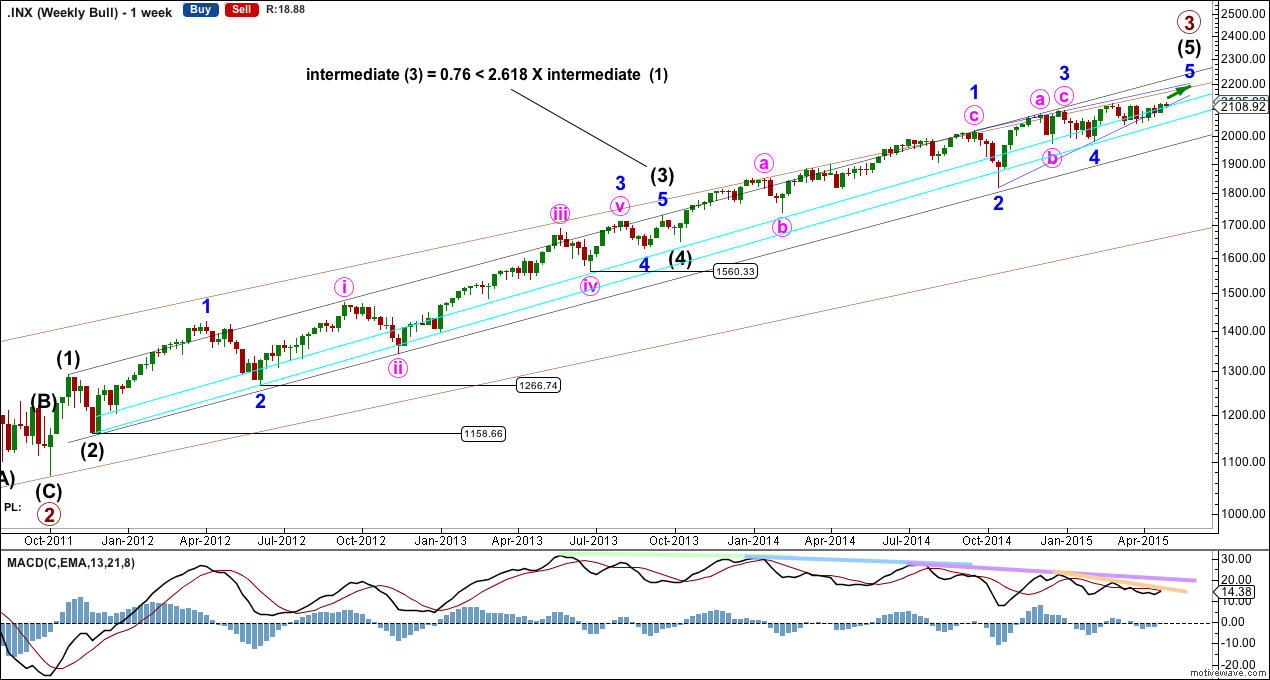
At the weekly chart level I want to see a wave count with intermediate wave (3) at just under 2.618 the length of intermediate wave (1), and subdividing perfectly as an impulse. At the weekly chart level intermediate wave (3) has stronger momentum so far than intermediate waves (1) and (5). This third wave cannot be the weakest.
The two bullish daily charts below both see intermediate waves (3) and (4) as labelled here.
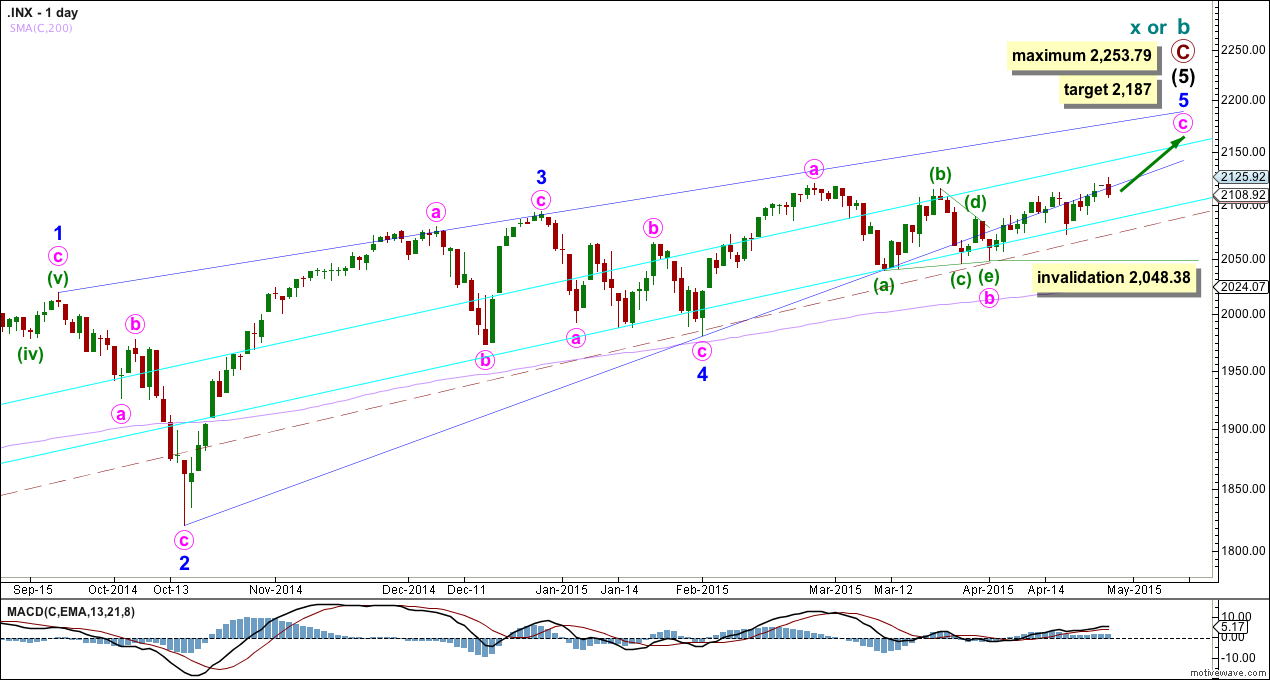
There is now quadruple technical divergence between price and MACD. This indicates a maturing trend. For this reason I will keep the main wave count as the less bullish of the two.

Within intermediate wave (5) the structure may be an ending diagonal. The alternate below looks at the only other structural possibility for a fifth wave, that of an impulse.
Within intermediate wave (5) I cannot see a solution where minor wave 3 ends earlier, because that would see it with weaker momentum than minor waves 1 and 5. While a third wave does not necessarily have to be the strongest wave within an impulse, it should not be the weakest.
An ending diagonal requires all sub waves to subdivide as zigzags and the fourth wave to overlap back into first wave price territory.
The lower 2-4 trend line of the contracting diagonal is now breached by three full daily candlesticks below it and not touching it. Diagonals normally adhere very well to their trend lines and this part of the wave count now looks wrong. Because this part of the wave count looks so wrong I will publish another bullish alternate below.
The breach of the 2-4 trend line is the only problem with this wave count.
Within the final zigzag of minor wave 5 minute wave c must now have begun. It would reach equality in length with minute wave a at 2,187.
The diagonal is contracting, the third wave is shorter than the first and the fourth wave is shorter than the second. A third wave may never be the shortest wave. This limits the final fifth wave to no longer than equality with the third wave at 2,253.79. A new high above this point would see this main wave count invalid and the bullish alternate below confirmed.
Within minute wave c no second wave correction may move below the start of its first wave at 2,039.69.
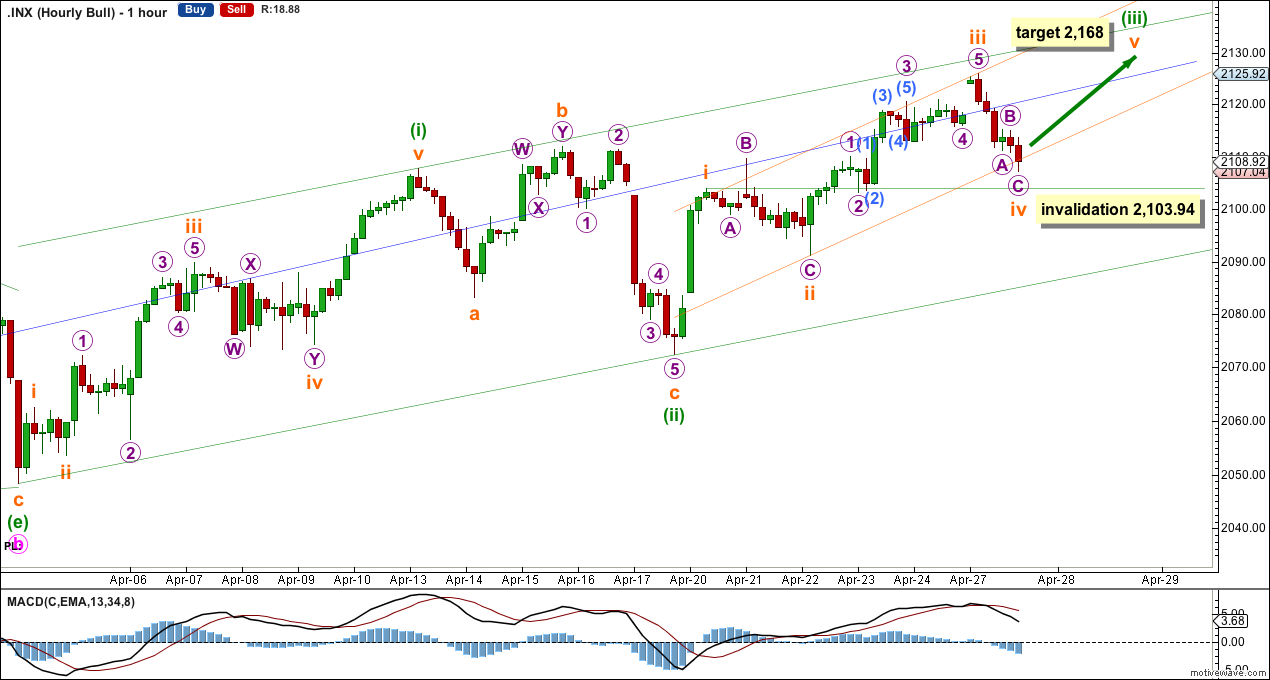
The hourly chart shows all of minute wave c so far.
At 2,168 minuette wave (iii) would reach 1.618 the length of minuette wave (i).
Upwards movement for Monday began with an exhaustion gap, which was quickly filled. Subminuette wave iii looks like it ends here, and has a ratio of equality with subminuette wave i at only 3.3 points longer. Subminuette wave iii has stronger momentum than subminuette wave i, and it subdivides reasonably well as an impulse.
Subminuette wave ii was a shallow 0.41 expanded flat, and subminuette wave iv is a deeper 0.54 zigzag. There is adequate alternation between the two. Subminuette wave iv remains above subminuette wave i price territory at 2,103.94.
This movement of minuette wave (iii) so far fits into an Elliott channel. Draw the first trend line from the ends of subminuette waves i to iii, then place a parallel copy on the end of subminuette wave ii.
This wave count now expects an extended fifth wave up to end minuette wave (iii). So far subminuette wave i is not extended, and subminuette wave iii is extended. The fifth wave may also extend. If it does the subdivisions should be seen clearly on the hourly and daily charts, it may be time consuming, and it may show weaker momentum than suminuette wave iii.
If subminuette wave iv continues it may not move into subminuette wave i price territory below 2,103.94. If this invalidation point is breached then I would move the degree of labelling within subminuette wave iii all down one degree and I would expect downwards movement to be a second wave correction. The invalidation point would move down to the start of subminuette wave iii at 2,072.37.
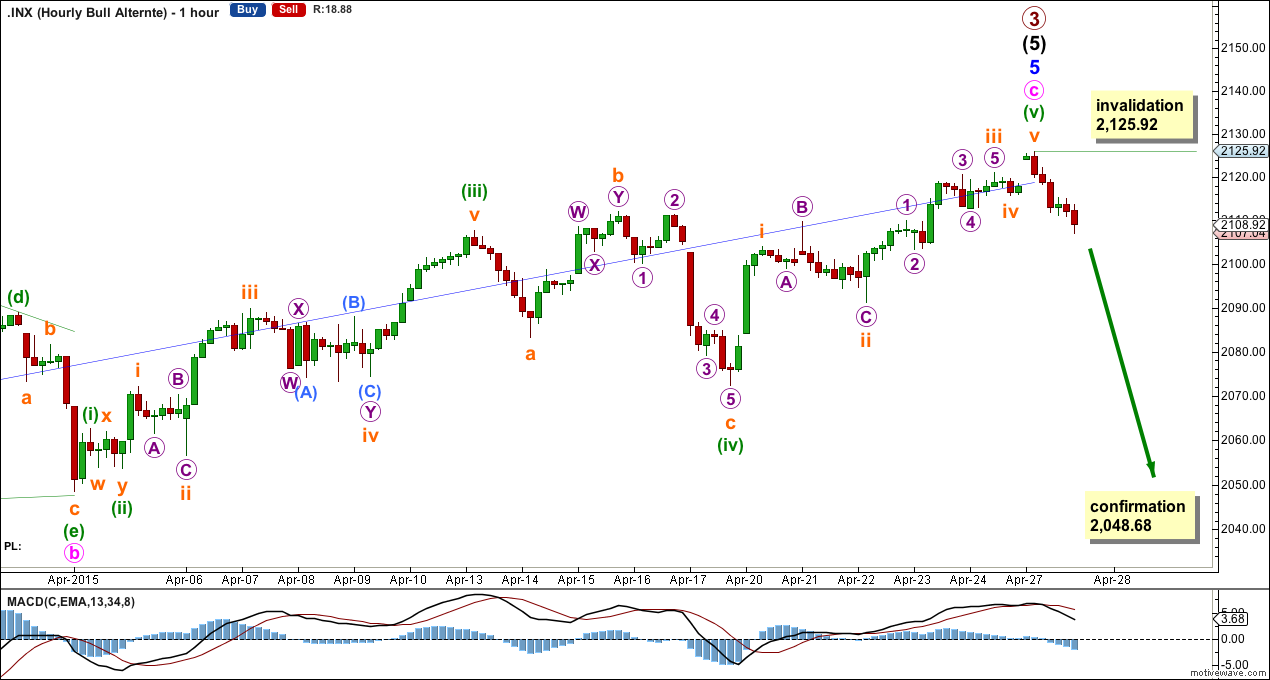
It is possible to see the whole structure complete; minute wave c can be seen as a complete five wave impulse. The third wave of minuette wave (iii) has the strongest upwards momentum and there would be alternation between the combination of minuette wave (ii) and the expanded flat of minuette wave (iv).
However, a big trend change requires some confirmation. Here only a new low below 2,048.68 would see me seriously consider this idea. It would still require confirmation with a breach by a close of 3% or more of market value below the lower aqua blue trend line on the daily chart.
Alternate Bullish Wave Count
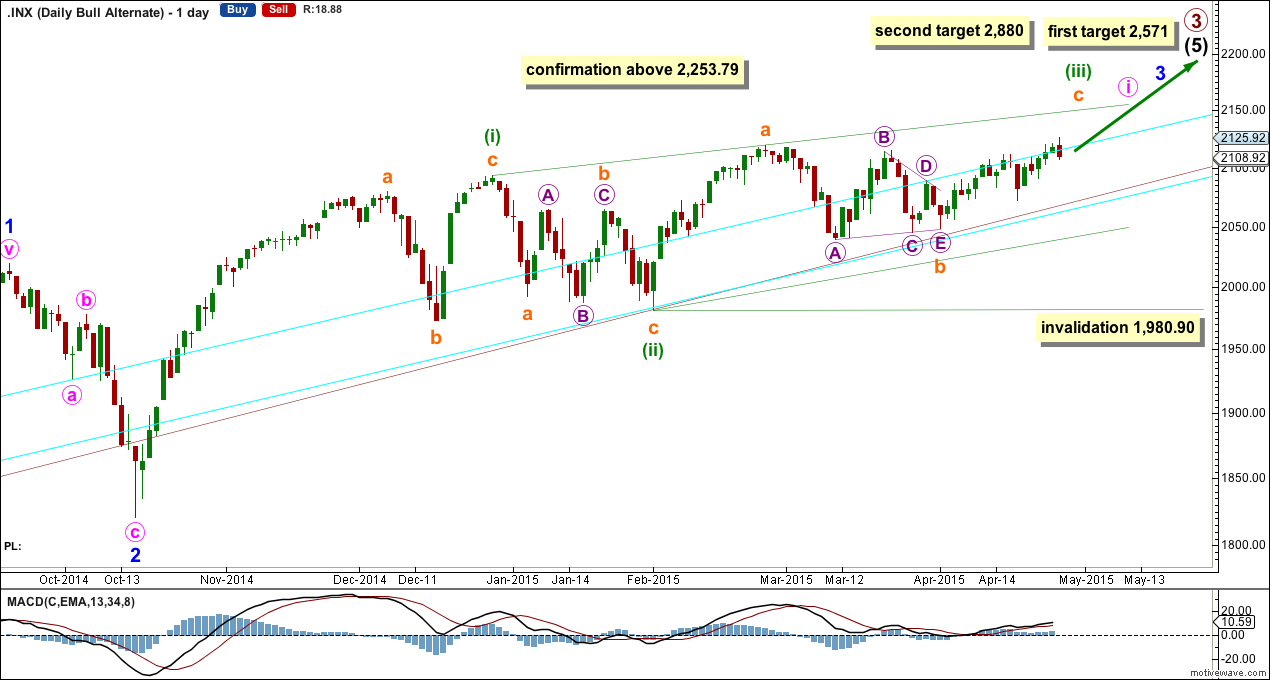
A new high above 2,253.79 would invalidate the main wave count and confirm this alternate. At that stage at least one more year, and probably longer, of a bull market may be expected.
I have looked for a bullish alternate which sees minor waves 3 and 4 within intermediate wave (5) complete. The problem is the deep correction seen here and labelled minor wave 2. This cannot be part of minor wave 3 because then minor wave 3 would not subdivide as an impulse.
It is possible to see minor wave 3 complete at the high labelled here minor wave 1, but then it would have weaker momentum than minor waves 1 and 5. I am not prepared to publish a wave count with a third wave in an impulse weaker than its corresponding first and fifth waves.
Through a process of elimination this leaves me with this very bullish wave count. It sees minor wave 3 as so far having stronger momentum than minor wave 1. It sees minor wave 1 as a complete impulse.
With all the overlapping at the beginning of this possible third wave a leading diagonal for minute wave i is a reasonable explanation.
The diagonal of minute wave i would be incomplete. When minuette wave (iii) is over then the following downward correction for minuette wave (iv) must move back into minuette wave (i) price territory below 2,093.55. Minuette wave (iv) may not move below the end of minuette wave (ii) below 1,980.90.
Because diagonals normally adhere to their trend lines I would expect for this bullish alternate minuette wave (iii) to end where the upper (i)-(iii) trend line is drawn, because here it sits on the high of subminuette wave a within minuette wave (iii).
At 2,571 intermediate wave (5) would reach 2.618 the length of intermediate wave (3). Both intermediate waves (3) and (5) would be extended.
If price keeps rising through the first target, or if when it gets there the structure is incomplete, then the second target would be used. At 2,880 primary wave 3 would reach 2.618 the length of primary wave 1.
Bear Wave Count
The subdivisions within primary waves A-B-C are seen in absolutely exactly the same way as primary waves 1-2-3 for the bull wave count. The alternate bull wave count idea also works perfectly for this bear wave count.
To see the difference at the monthly chart level between the bull and bear ideas look at the last historical analysis here.
At cycle degree wave b is over the maximum common length of 138% the length of cycle wave a, at 167% the length of cycle wave a. At 2,393 cycle wave b would be twice the length of cycle wave a and at that point this bear wave count should be discarded.
While we have no confirmation of this wave count we should assume the trend remains the same, upwards. This wave count requires confirmation before I have confidence in it. Full and final confirmation that the market is crashing would only come with a new low below 1,370.58. However, structure and momentum should tell us long before that point which wave count is correct, bull or bear.
This analysis is published about 07:11 p.m. EST.
Tremendous amount of buying power being expended to keep the major indices (DOW and SPY) above 18000 and 2100. Long lower shadows on candles show lower levels continually being rejected but this cannot go on much longer…somethings’ gotta give…on the sidelines until it does…scalping is the only way to trade this market without getting mercilessly whip-sawed
We’re in a bull market, until proven that we’re not. Super simple.
With any luck, some of us will be taking profits when the crowd finally decides the bull run is over; Looks like I will be able to take profits this morning on short positions entered yesterday…
That’s the thing I’m learning about bull markets, high levels of optimism can be sustained for long periods of time. Figuring out a turn from bull to bear is very hard for this reason. Figuring out the end of a bear market on the other hand is supposedly easier.
The long lower shadows can be a bullish indicator. Today’s candlestick would be a hanging man (bearish) but that depends on your interpretation of the recent trend. I would rather interpret the trend as sideways since December 2014; all that choppy overlapping move doesn’t look like a clear bull run to me. If that’s correct then the hanging man should be ignored.
The immediate filling of the opening gap also had me wondering if C up was already done. If the top is NOT in the VIX should make a new 52 week low tomorrow It also appears that the top Aqua trend line is now providing stiff resistance to upward movement.